Palantir Links AWS, SAP Data Directly to Frontline Factory Actions
Palantir
Enterprise analytics deliver operational value only when data pipelines and external machine learning models bind directly to an operational ontology that enables non-technical staff to execute governed write-backs to core systems.
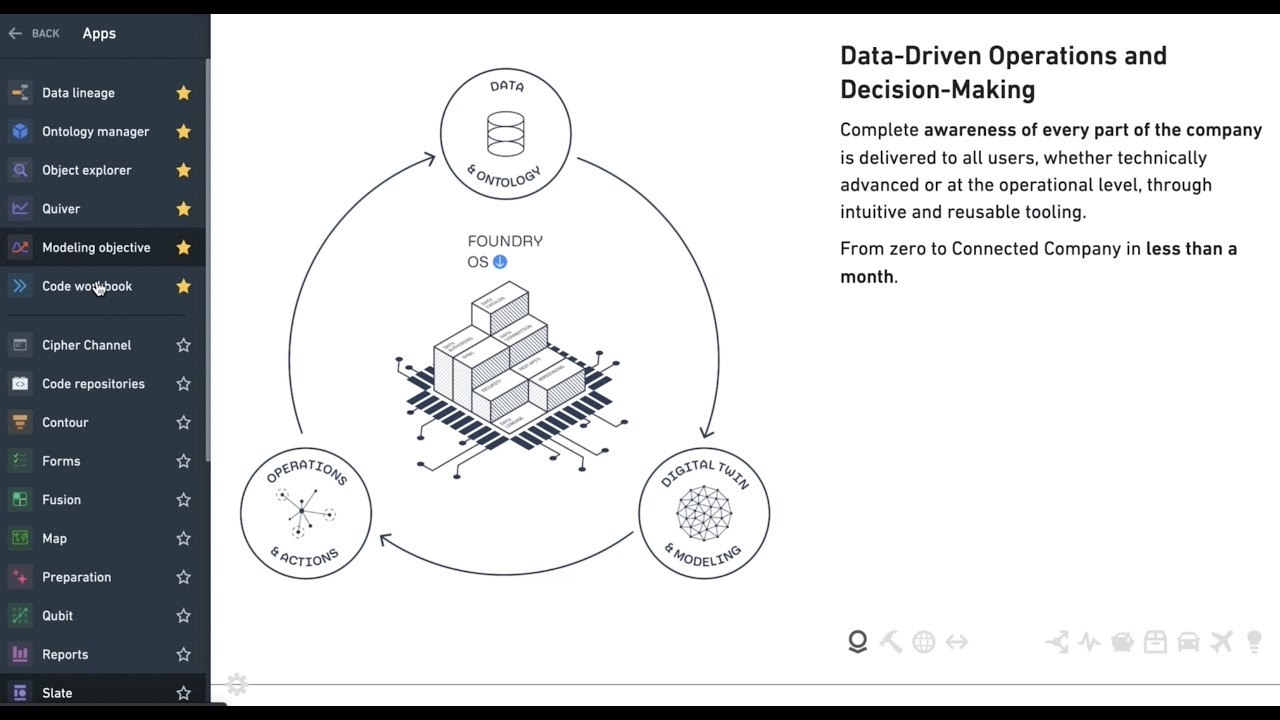
Palantir Foundry acts as an enterprise operating system structured around three pillars: Data & Ontology integration, Modeling & Digital Twin logic, and Operational Applications, with non-technical business operators making up 70% to 80% of its end-user base. (0:11)
The platform introduces an 'Ontology' layer that functions as a semantic and kinetic type system, turning raw pipeline records into real-world business objects and governing how models and users enact changes back into underlying ERP and MES systems. (17:14)
Foundry supports a 'build anywhere' machine learning paradigm where models developed natively or externally in tools like AWS SageMaker, Azure ML, or DataRobot compete against operational objectives before being bound directly to ontology entities. (24:41)
Using tools like Workshop and Vertex, enterprises can construct full-fidelity digital twins and low-code operational applications in hours or days, allowing operators to run multi-model value chain simulations and execute validated write-backs. (38:11)
Detailed notes
## Background
Published by Palantir on YouTube on April 27, 2022, this demonstration features Palantir Foundry Chief Architect Akshay Krishnaswamy providing an in-depth walkthrough of the platform's core architecture and operational workflows. According to the description, the video illustrates how Foundry delivers value across IT, data engineering, data science, and operational business roles by uniting data integration, machine learning, and application building on top of existing enterprise infrastructure.
## TL;DR
Palantir Foundry is presented as an enterprise operating system structured across three functional pillars: data and ontology integration, modeling and digital twin logic, and operational application delivery. Chief Architect Akshay Krishnaswamy demonstrates how data is ingested from ERPs like SAP and API feeds, monitored with health checks and Git-style versioning, and unified into an enterprise ontology governed by dynamic security policies. The platform supports a 'build anywhere' machine learning architecture that benchmarks models against business objectives and binds predictions directly to ontology objects. Operational users can then explore interconnected digital twins, run what-if simulations, and execute controlled write-backs into underlying source systems through low-code tools like Workshop.
## Atmosphere & style
The presentation carries the polished, authoritative cadence of a high-end enterprise technical briefing, delivered with steady confidence and fluid articulation. Krishnaswamy navigates complex architectural layers—from raw PySpark code to visual digital twin graphs—with pragmatic ease, demystifying enterprise buzzwords by tying them directly to live interfaces. The pacing feels intentional, dense, and methodical, creating a compelling balance between deep technical rigors (like granular access controls and lineage rollbacks) and tangible business outcomes for everyday non-technical operators.
## Bulletin
- [00:11](https://www.youtube.com/watch?v=uF-GSj-Exms&t=11s) Palantir Foundry acts as an enterprise operating system structured around three pillars: Data & Ontology integration, Modeling & Digital Twin logic, and Operational Applications, with non-technical business operators making up 70% to 80% of its end-user base.
- [17:14](https://www.youtube.com/watch?v=uF-GSj-Exms&t=1034s) The platform introduces an 'Ontology' layer that functions as a semantic and kinetic type system, turning raw pipeline records into real-world business objects and governing how models and users enact changes back into underlying ERP and MES systems.
- [24:41](https://www.youtube.com/watch?v=uF-GSj-Exms&t=1481s) Foundry supports a 'build anywhere' machine learning paradigm where models developed natively or externally in tools like AWS SageMaker, Azure ML, or DataRobot compete against operational objectives before being bound directly to ontology entities.
- [38:11](https://www.youtube.com/watch?v=uF-GSj-Exms&t=2291s) Using tools like Workshop and Vertex, enterprises can construct full-fidelity digital twins and low-code operational applications in hours or days, allowing operators to run multi-model value chain simulations and execute validated write-backs.
## Key takeaways
- [00:11](https://www.youtube.com/watch?v=uF-GSj-Exms&t=11s) Foundry is built on a microservices architecture powering dozens of integrated applications designed primarily for operational, non-technical business users rather than solely data engineers.
- [02:17](https://www.youtube.com/watch?v=uF-GSj-Exms&t=137s) Monocle provides complete end-to-end data lineage tracking from source systems to business objects, pairing pipeline builds with Git-backed immutable versioning and bidirectional rollbacks.
- [05:22](https://www.youtube.com/watch?v=uF-GSj-Exms&t=322s) Security governance dynamically inherits along data lineage edges, combining Role-Based (RBAC), Classification-Based (CBAC), and Purpose-Based (PBAC) access control without relying on fragile storage-bucket permissions.
- [08:41](https://www.youtube.com/watch?v=uF-GSj-Exms&t=521s) Data is treated like source code via isolated branching, line-by-line diff pull requests, downstream impact reports, and automated health checks tracking freshness and statistical drift.
- [12:16](https://www.youtube.com/watch?v=uF-GSj-Exms&t=736s) Containerized workloads run natively on Kubernetes with Apache Spark and Apache Flink, persisting data in open formats like Apache Parquet and Apache Avro with compute federation support.
- [14:16](https://www.youtube.com/watch?v=uF-GSj-Exms&t=856s) A certified SAP NetWeaver connector dynamically infers ERP schemas, foreign keys, and German metadata acronyms to automatically generate transparent, editable PySpark pipelines within hours.
- [17:14](https://www.youtube.com/watch?v=uF-GSj-Exms&t=1034s) The Ontology Management layer transforms tabular data into real-world digital representations with standardized API names, system IDs, spatial coordinates, and embedded security boundaries.
- [18:54](https://www.youtube.com/watch?v=uF-GSj-Exms&t=1134s) Exploration tools such as Object Explorer, Quiver, and Foundry Map empower users to navigate 360-degree object views, run high-frequency sensor telemetry, and inspect supply chain networks without duplicating underlying data.
- [24:41](https://www.youtube.com/watch?v=uF-GSj-Exms&t=1481s) Foundry employs an open 'build anywhere' data science architecture, allowing teams to train models in AWS SageMaker, Azure ML, or DataRobot and deploy them into unified governance and lineage tracking.
- [28:27](https://www.youtube.com/watch?v=uF-GSj-Exms&t=1707s) The Model Objectives Library operationalizes machine learning by setting explicit operational targets, evaluating competing candidate models side by side, and cordoning off sensitive metrics.
- [31:44](https://www.youtube.com/watch?v=uF-GSj-Exms&t=1904s) Models bind directly to the ontology, creating a strict type system where model inputs draw from business objects and predictions write back to shared properties across multiple front-ends simultaneously.
- [33:50](https://www.youtube.com/watch?v=uF-GSj-Exms&t=2030s) Ontology Actions provide a governed kinetic layer, enabling frontline operators to trigger pre-validated operational interventions and synchronized, non-destructive write-backs to enterprise systems like SAP.
- [38:11](https://www.youtube.com/watch?v=uF-GSj-Exms&t=2291s) Foundry Workshop enables low-code drag-and-drop operational application building bound directly to the ontology, abstracting away underlying compute, indexing, and storage infrastructure.
- [41:06](https://www.youtube.com/watch?v=uF-GSj-Exms&t=2466s) Vertex powers strategic digital twins and graph-based value chain simulations, allowing operators to scrub through time, stress-test supply shock scenarios, and chain complex multi-model simulations.
## Detailed walkthrough
### [00:11](https://www.youtube.com/watch?v=uF-GSj-Exms&t=11s) Foundry Overview and Core Architecture
Palantir Foundry is architected behind the scenes as a network of over 100 microservices presented through more than two dozen out-of-the-box user-facing applications, alongside the ability for organizations to build their own bespoke applications. These tools are designed to span virtually every persona in the modern enterprise, from infrastructure engineers to frontline operators. The platform's functional footprint breaks down into three interconnected core pillars: the data and ontology foundation, the digital twin and modeling layer, and operational applications for end users.
```mermaid
flowchart TD
accTitle: Foundry Architecture Overview
accDescr: The three core functional pillars of Palantir Foundry spanning integration to end-user applications.
subgraph S1["1. Data & Ontology"]
A["Source Systems<br/>(Lakes, Warehouses, APIs, ERP)"] --> B["Data Integration & Cleansing"]
B --> C["Semantic Ontology<br/>(Objects, Links, Actions)"]
end
subgraph S2["2. Modeling & Analytics"]
C --> D["Digital Twin & Logic"]
D --> E["DS, ML & LP Models"]
end
subgraph S3["3. Operational Consumption"]
E --> F["Operational Users<br/>(70-80% Non-Technical)"]
F --> G["Workflows & Frontline Apps"]
end
```
The first pillar centers on data integration and the creation of an ontology. It takes raw inputs from data lakes, enterprise data warehouses, and operational systems, refining them into a unified semantic foundation. The second pillar brings data science, machine learning models, linear programming (LP) solvers, and core business logic into that very same operational plane. Rather than leaving analytics siloed in notebooks, this fuses predictive and analytical modeling directly with the underlying data fabric to establish a digital twin. The third pillar brings these combined capabilities directly into the daily workflows of operational staff, who represent the vast majority of enterprise consumers.
Akshay Krishnaswamy highlights this operational distribution of enterprise users:
> “And this is 70 to 80 percent of users of Foundry in most contexts are sort of quote unquote non-technical users trying to make use of the fruits of all that labor towards real operational workflows and different applications that are kind of existential to the business.”
- Architecture consists of 100+ microservices powering over 24 out-of-the-box applications plus extensible custom app frameworks.
- The platform's core functional layers divide into: Data & Ontology integration, Modeling & Digital Twin logic, and Operational Applications.
- Operational non-technical users comprise approximately 70% to 80% of Foundry's typical user base across enterprise deployments.
---
[02:17](https://www.youtube.com/watch?v=uF-GSj-Exms&t=137s) Foundations of Foundry: Data Lineage and Integration in Monocle
The journey begins in Monocle, Foundry’s data lineage and pipeline graph, which tracks how disparate data streams converge into an operational ontology. In a notional supply chain environment, the ontology surfaces relatable, high-level business concepts such as suppliers, alerts, distribution centers, materials, and manufacturing plants, mapping the relationships and actions that link them. Drilling into an individual concept like the "Plant" object exposes an expansive upstream pipeline where raw source feeds are cleaned, joined, and structured step by step.
```mermaid
flowchart LR
accTitle: Data Lineage to Semantic Plant Object
accDescr: Data flow from raw external sources through transformation steps to the Plant ontology object.
subgraph Semantic["Ontology Layer"]
OBJ["Plant Object"]
end
S1 --> T1
S2 --> T1
S3 --> T2
T1 --> T2
T2 --> T3
T3 --> OBJ
```
Monocle exposes the complete transformation journey from left to right. In this pipeline, the plant object draws concurrently from an enterprise SAP system, an open API feed from Treasury.gov, and a synthetic time-series sensor stream. Every rectangular node in the lineage graph represents an applied transformation, from raw joins to custom PySpark logic, progressively refining the records into clean semantic representations.
Engineers and data stewards can inspect the underlying PySpark transform code directly inside any selected node or consult the dataset's history log. Foundry retains full data versioning across every pipeline build, logging which user or scheduled routine initiated an update, what the output differences were relative to prior builds, and preserving the exact code and metadata state at that snapshot.
Akshay Krishnaswamy underscores the power of this historical auditability:
> “And this is huge because I can go back and take a look and say, 'OK, who actually updated this particular routine or this particular schedule of this data build? What was the actual result for this version of the data versus the current version of the data? And how can you actually roll forward and backwards through different versions of the data with the code and the metadata at each point in time?'.”
- Lineage is visualized through Monocle, converting multi-source pipelines into distinct business concepts (plants, distribution centers, suppliers, materials).
- Supported inputs in the demo include ERP systems (SAP), public REST APIs (Treasury.gov), and streaming/synthetic time-series sensors.
- Full immutable data versioning tracks the exact commit, author, scheduled execution, code, and transformation metadata for every individual dataset build, enabling bidirectional rollbacks.
---
[05:22](https://www.youtube.com/watch?v=uF-GSj-Exms&t=322s) Dynamic Permissioning and Lineage-Based Security
Security and data governance in Foundry are fundamentally intertwined with data lineage. Rather than managing access lists on static folders, storage buckets, or physical server paths, Foundry propagates security policies dynamically along the pipeline edges. As datasets are transformed and combined, child datasets automatically inherit the union of all parent access restrictions, ensuring downstream derivatives remain protected by the upstream sources' governance rules.
Switching Monocle into the permissions view reveals real-time access states across the pipeline. While an administrator view renders the entire graph accessible (highlighted in blue), evaluating the graph from the viewpoint of another user illustrates dynamic containment. For example, when viewed from the perspective of colleague Jason Richardson, the graph turns predominantly inaccessible because Jason only holds source credentials for Treasury.gov. The moment Treasury.gov data is blended with restricted SAP records, the lineage engine revokes his visibility on the downstream join.
Foundry also supports explicit exceptions through situational permission expansions. In Jason's case, access is granted specifically to a downstream sanitized dataset (such as an OFAC clean dataset) without propagating those expanded privileges further down the lineage graph. This architecture accommodates hybrid security strategies, concurrently enforcing Role-Based Access Control (RBAC), Classification-Based Access Control (CBAC), and Purpose-Based Access Control (PBAC).
Akshay Krishnaswamy explains the hard-earned engineering lessons behind this approach:
> “And this was very much built from our own experience in the field as Palantir engineers, where if you thought about just doing security based off of the location of data and some sort of file system or some sort of bucket location, it became really hard to actually make sure that security was robust as that organization organically started to pull that data into other places.”
- Security propagation rule: Downstream child nodes automatically inherit the union of all upstream parent permissions.
- Multi-model security: Natively blends RBAC (Active Directory/identity provider roles), CBAC (data classifications/caveats), and PBAC (purpose-based projects and use cases).
- Granular administrative controls permit selective dataset overrides (such as sanitization pipelines like OFAC clean) without leaking upstream restricted raw tables or downstream composite outputs.
- Lineage-backed access metadata remains immutable across UI workflows, downstream apps, and REST API access points.
---
[07:56](https://www.youtube.com/watch?v=uF-GSj-Exms&t=476s) Ensuring Pipeline and Data Quality
Building high-cadence, production-grade pipelines requires automated observability to ensure data remains sound as sources refresh. Foundry addresses pipeline governance through integrated data health checks directly inside the DataOps build graph. Switching Monocle into the data health view allows users to visually inspect which nodes have active test suites and identify processing failures immediately.
Users can instrument any pipeline node with out-of-the-box health checks using a point-and-click interface. These checks validate operational parameters, including refresh schedules and update deadlines, ensuring incoming data arrives on time. Additionally, they monitor structural properties such as file and partition sizes, column cardinalities, and statistical distributions, triggering alerts if anomalous values deviate from expected parameters.
Akshay Krishnaswamy frames the operational challenge of pipeline maintenance:
> “The second piece I want to call out here as we kind of work through things is 'OK, so I build out these pipelines that get to be quite robust to refreshing all the time. How do I keep these things healthy?'”
- Native data health checks monitor pipeline freshness, scheduled build completion times, and file/volume sizing.
- Statistical anomaly detection tracks column-level data distributions, null rates, and unexpected cardinality shifts.
- Health checks can be configured visually via point-and-click or codified programmatically as pipeline assertions.
[08:41](https://www.youtube.com/watch?v=uF-GSj-Exms&t=521s) Pipeline Authoring and Treating Data Like Code
Akshay Krishnaswamy transitions from reviewing data health checks in the lineage view into the code authoring environment. He explains that keeping health checks integrated alongside transformations saves data engineers from having to hop across different platforms just to monitor data freshness and pipeline integrity while pipelines constantly refresh. Clicking into a single step of pipeline logic launches **Authoring**, Foundry’s integrated development environment (IDE), which provides complete change management directly in the platform.
```mermaid
flowchart TD
accTitle: Treating Data Like Code in Foundry
accDescr: Branching workflow showing how changes are isolated, tested, and merged into production.
subgraph Branching["Isolated Development Branch"]
A["Branch Created from Master"] --> B["Author Logic & Transforms\n(PySpark, Java, Scala)"]
B --> C["Generate Branch Data\n(Sandboxed Output)"]
C --> D["Validate via Analytics & Visualizations"]
end
subgraph Merging["Change Management & CI/CD"]
D --> E["Create Pull Request"]
E --> F["Automated Impact Analysis\n& Security Propagations"]
F --> G["Merge into Master Pipeline"]
G --> H["Commit Log / Time Travel\n(Git-style Semantics)"]
end
```
The core philosophy of Foundry's change management is that teams must treat data with the exact same rigor as source code. Instead of editing the production master branch directly—which risks breaking downstream consumer pipelines—Foundry uses cloud-native logical isolation to virtualize the entire change management lifecycle within a single environment. Users can open an isolated branch, make transform edits, produce branch-specific datasets, run analytical sanity checks, and then open a pull request. Krishnaswamy contrasts this with standard enterprise workflows where developers clone massive pipelines and datasets into a separate User Acceptance Testing (UAT) environment, make edits in isolation, and “hopefully say a prayer and then port them back to master and hope that everything just sort of works.”
Foundry's pull requests provide a line-by-line diff of the underlying code, an automated downstream impact analysis showing which consumer datasets and transforms will be affected, and a report on how permissions and role paradigms will blend across parent layers. Everything is backed by Git semantics, providing a complete commit history with a clone icon and roll-back functionality. “We're never, sort of, out of luck if we merged something in that we realized later has to actually be undone,” Krishnaswamy remarks; teams can simply revert to an earlier commit. This infrastructure gives organizations a robust build system to evolve complex data pipelines organically through rapid iteration rather than relying on brittle, upfront waterfall engineering.
[12:16](https://www.youtube.com/watch?v=uF-GSj-Exms&t=736s) Compute Engines, Open Standards, and Federation
Foundry incorporates auto-scaling compute engines directly out of the box, running containerized workloads on Kubernetes: Apache Flink for real-time streaming computation and Apache Spark for batch processing. Engineers can write logic using any programming language with native bindings to these runtimes, including PySpark, Spark SQL, Java, Scala, and Groovy.
Krishnaswamy highlights Foundry’s commitment to open data standards and unconstrained interoperability. Previewing the datasets and transformation histories shows underlying storage backed by standard, non-proprietary file formats such as Apache Parquet and Apache Avro. Under the hood, Foundry’s build service manages execution by invoking Flink or Spark because they are registered as default runtimes. However, organizations with existing high-performance computing (HPC) clusters, dedicated external Spark platforms, or custom compute runtimes can register those external engines directly with Foundry as external build workers. When scheduled orchestrations or manual pipeline refreshes run, Foundry's build coordinator seamlessly federates compute steps out to those external clusters without locking users into a proprietary engine.
- **Built-in Kubernetes Engines:** Apache Flink (streaming runtime) and Apache Spark (batch runtime).
- **Supported Authoring Languages:** PySpark, Spark SQL, Java, Scala, and Groovy.
- **Open Storage Formats:** Data is structured on disk in Parquet and Avro formats.
- **Extensible Build Workers:** Foundry federates batch or streaming logic out to external HPC clusters and third-party compute runtimes rather than restricting workloads to internal instances.
[14:16](https://www.youtube.com/watch?v=uF-GSj-Exms&t=856s) Software-Defined Data Integration with SAP and ERP Systems
Krishnaswamy turns to source systems that enterprises encounter repeatedly—most notably enterprise resource planning (ERP) systems like SAP and customer relationship management (CRM) software. Rather than requiring engineers to rebuild standard extract, clean, and transform jobs from scratch, Foundry introduces **software-defined data integrations**. By combining native connectors with machine learning-assisted schema techniques, Foundry eliminates the need to recreate standardized ERP transformations manually.
```mermaid
flowchart LR
accTitle: SAP NetWeaver Software-Defined Integration
accDescr: Dynamic metadata extraction from SAP NetWeaver into native PySpark Foundry pipelines.
subgraph SAP["SAP Application Layer"]
A["SAP System\n(NetWeaver RFC/API)"]
B["Standard Modules: MM, SD, DD"]
C["Custom Tables: Z-Tables"]
A --- B
A --- C
end
subgraph Foundry["Foundry Data Layer"]
E["SAP Explorer\n('Shopping Cart' UI)"]
F["Generated PySpark Pipelines"]
G["Foundry Ontology\n(Hydrated Business Objects)"]
end
SAP --> D
D --> E
E --> F
F --> G
```
Demonstrating the SAP Explorer interface, Krishnaswamy connects directly to an internal SAP instance via SAP NetWeaver at the application layer using a certified native connector. This approach inspects deep application metadata rather than merely scanning relational database tables. The connector dynamically reads modules like Materials Management (MM), Sales and Distribution (SD), and Data Dictionaries (DD), while automatically translating German acronyms, reading foreign keys, and inferring semantic relationships. Crucially, this dynamic inference extends to customized enterprise implementations and custom "Z tables."
Through this interface, users browse their ERP estate in a shopping-cart-style workflow to select tables and common workflows. Foundry automatically generates fully functional PySpark pipelines and starting business objects in hours rather than months. Krishnaswamy emphasizes that these generated outputs remain fully editable code, stating: “So even if it gives us a starting set of pipelines, we can always choose to expand that. We're never sort of given some sort of black box output that we can't change.” This software-defined acceleration ensures enterprises can bypass weeks of manual extraction engineering and immediately focus on hydrating the central operational layer: the Ontology.
[17:14](https://www.youtube.com/watch?v=uF-GSj-Exms&t=1034s) Configuring the Semantic Layer in the Ontology Management Application
Moving past backend data pipeline construction, Akshay Krishnaswamy shifts into Foundry’s Ontology Management application. This interface is designed for data governance leads and business liaisons who need to translate cleaned, "golden" datasets into functional, real-world digital representations. Here, administrators decide how each business object—such as an industrial manufacturing plant—should behave across the broader platform. They specify whether the object is visible, hidden, prominently highlighted, marked as an active resource for daily production workflows, or tagged as experimental.
```mermaid
flowchart TD
accTitle: Foundry Ontology and Consumption Layer
accDescr: Diagram showing how integrated datasets feed into the Ontology and surface across different user interfaces.
subgraph Interfaces ["User Consumption Lenses"]
ONT --> OE["Object Explorer\n(Business 360° Views)"]
ONT --> QV["Quiver\n(Time Series & Advanced Analytics)"]
ONT --> MAP["Foundry Map\n(Geospatial & Supply Graph)"]
ONT --> ML["Modeling & AI/ML\n(Operational Digital Twins)"]
end
```
The application maps raw schema attributes directly into standardized object properties, assigning explicit API names, unique identifiers, and geospatial coordinates. Administrators can enforce restricted security views directly within the sidebar or pre-seed metadata tailored to specific operational contexts, such as simulations or geospatial analysis. Krishnaswamy emphasizes that standardizing this configuration accelerates delivery: “And what we can do here is sort of preset some metadata which you can always manually set ourselves that will just get us again time to value faster.” Once configured, the ontology feeds immediately into out-of-the-box business applications without requiring custom frontend engineering.
- **Object visibility controls**: Configurable statuses include normal visibility, hidden, prominent, experimental, or active operational use.
- **Metadata and schema mapping**: Binds golden dataset columns to API property names, system IDs, and geospatial attributes.
- **Granular access control**: Restricted views and additional security boundaries can be placed straight onto the ontology object.
- **Workflow priming**: Pre-configured metadata optimizes objects for downstream simulation and spatial tooling.
---
[18:54](https://www.youtube.com/watch?v=uF-GSj-Exms&t=1134s) Point-and-Click Exploration in Object Explorer
For non-technical business professionals who do not spend their days in data lineage graphs or code workbenches, Foundry exposes the ontology through Object Explorer. This interface offers an intuitive search and browse experience similar to modern consumer web applications. Users can locate items by object type or specific attributes, ranging from aviation assets (aircraft, delays, flights) to marketing assets (interactions, campaigns, offers). Selecting an object type launches a curated exploration environment displaying summary statistics, geospatial maps, and high-level distribution metrics.
Drilling into an individual asset opens a tailored 360-degree view. In the plant operations example, the view aggregates geospatial coordinates, street addresses, unstructured engineering schematics, risk assessments, operational timelines, and enterprise inventory metrics sourced directly from ERP and EMS systems. These dashboards can be customized with different analytical lenses—showing streaming IoT and video feeds to plant engineers, or high-level cost metrics and balance sheet data to a CFO. Krishnaswamy notes that this unified layer operates seamlessly across massive datasets: “And the power of Object Explorer is that allows people to traverse the different objects in a completely security compliant way and at a scale which you could have millions or billions of different objects here where we're actually allowing people to kind of traverse in a way that that makes sense and isn't overwhelming.”
- **Point-and-click navigation**: Simplifies searching across diverse business objects and their linked attributes.
- **360-degree operational view**: Merges 30-day inventory stats, production capacities, unstructured blueprints, and ERP/EMS records into one pane.
- **Role-based operational lenses**: Presents tailored perspectives on the same underlying object, from shop-floor IoT metrics to executive financial views.
- **Enterprise-grade scale**: Allows compliant graph traversal across millions or billions of linked object records without overwhelming the end user.
---
[21:41](https://www.youtube.com/watch?v=uF-GSj-Exms&t=1301s) Advanced Time-Series Analytics with Quiver
Technical analysts and plant engineers who require deeper quantitative capabilities can transition from Object Explorer into Quiver, Foundry’s specialized application for time-dependent and streaming sensor data. Geared toward industrial environments such as oil, gas, and utilities, Quiver replaces static business intelligence reporting with an interactive mathematical workspace. Users can execute point-and-click transformations across streaming telemetry, applying integrals, interpolation algorithms, scatter plot correlations, and custom formulas to compute derived series in real time.
Beyond standard chart building, Quiver lets users calculate differentials between sensors (such as real-time pressure drops), scan histories for threshold violations, or train first-approximation machine learning classifiers without writing code. When an engineer needs to hand off preliminary findings to the data science team, the workspace exports the logic directly into clean Python code equipped with the platform's time-series library semantics. Krishnaswamy underscores that beneath this technical depth lies the same semantic foundation: “And again, the power here is it looks pretty technical, looks pretty custom, but at the end of the day, I'm just interacting with those objects in my ontology like we saw before, so I can just kind of browse for more objects and plop them onto these plots to be able to use them.”
- **Time-series operations**: Point-and-click formulas, summations, integrals, differentials, and interpolation curves.
- **Automated threshold queries**: Fast scans across high-frequency series to pinpoint anomalies where spreads exceed defined tolerances.
- **No-code model prototyping**: Visual training tools for preliminary classification algorithms on incoming telemetry.
- **Python interoperability**: Native export path converting visual analytical cards directly into executable Python code with full platform library support.
---
[23:22](https://www.youtube.com/watch?v=uF-GSj-Exms&t=1402s) Geospatial and Graph Intelligence in Foundry Map
To analyze operational assets in their physical context, users can shift their perspective into Foundry Map. This geospatial interface plots plants, distribution centers, and transportation routes on interactive layers that can be toggled based on the analytical objective. The tool combines spatial mapping with graph analytics, allowing users to select an asset—such as a regional distribution warehouse—and immediately visualize all connected customers, shipping routes, and upstream dependencies.
By rendering physical coordinates alongside relational supply chain links, the application helps operators identify logistics bottlenecks and material shortages before they impact production. Krishnaswamy explains that completing the hard foundational work of connecting source systems, automating pipeline health checks, and defining security rules ultimately pays off by unlocking multiple synchronized views of the enterprise: “And so this hopefully gives you an idea of if you do that work of kind of hopefully being able to rapidly integrate in data from different sources, right, or data lakes or data warehouses and layering in those health checks, having that security built in allows you to quickly assemble this semantic model, which then opens the door to immediate access and exploration for different types of users.”
- **Integrated geospatial layers**: Seamless display of multi-facility infrastructure and supply chain footprints.
- **Graph-relational overlays**: Ability to trace physical logistics paths and dependency trees directly from facilities to customer nodes.
- **Unified semantic backing**: Object Explorer, Quiver, and Foundry Map operate concurrently against the exact same underlying ontology objects without data duplication.
---
[24:41](https://www.youtube.com/watch?v=uF-GSj-Exms&t=1481s) Transitioning from Ontology to Digital Twins and "Build Anywhere" ML
Having demonstrated how data pipelines feed the ontology and power operational user interfaces, Krishnaswamy bridges the discussion to digital twins, predictive modeling, and machine learning. He highlights a core architectural tension within enterprise data science: practitioners rarely agree on a single standardized toolchain. Palantir deliberately designed Foundry’s machine learning infrastructure to be modular and open rather than prescriptive.
He observes the reality of diverse developer preferences with a practical aside: “And so the first thing I'll say here before we kind of go into the data science part of Foundry is if you talk to four or five data scientists inside of Palantir and ask them what tools they love to use, you'll get 10 different answers.” Foundry accommodates this reality by supporting its own native modeling tools while integrating with external platforms like DataRobot, Dataiku, Amazon SageMaker, and Azure Machine Learning. Under this "build anywhere" strategy, data science teams train and validate models in their environment of choice, while Foundry provides the infrastructure to deploy, monitor, and connect those models back into the operational ontology.
- **"Build anywhere" ML architecture**: Welcomes external modeling environments alongside Foundry's internal suites.
- **Supported third-party ecosystems**: Native integration capabilities for DataRobot, Dataiku, AWS SageMaker, and Azure ML.
- **Operational deployment target**: Streamlines the journey from raw research notebooks to live operational workflows embedded in the enterprise ontology.
[25:28](https://www.youtube.com/watch?v=uF-GSj-Exms&t=1528s) The Data Science Persona and Model Development
Akshay Krishnaswamy switches personas away from data engineering and business perspectives to enter the dedicated data science workspace. The interface presents a visual, lineage-style graph designed to feel immediately intuitive to practitioners accustomed to modern data science environments. Zooming out on an active pipeline step reveals the entire end-to-end lineage: upstream ontological objects feed directly into feature creation stages, training sets, and modeling transforms. Every node in this graph executes PySpark, with full support for Pandas, R, and Spark SQL.
```mermaid
flowchart LR
accTitle: Data Science Pipeline Integration
accDescr: Upstream ontology objects flow into feature engineering and training datasets to power batch and live inference endpoints.
subgraph DataFoundation["Data Foundation"]
A["Ontology Objects"]
B["Data Ops Pipelines"]
end
subgraph FeaturePipeline["Feature Pipeline"]
C["Feature Creation"]
D["Training Sets"]
end
subgraph ModelExecution["Model Execution"]
E["PySpark / Pandas / R"]
F["Batch & Live Inference Endpoints"]
end
A --> C
B -.->|"Health alerts"| C
C --> D
D --> E
E --> F
```
Akshay jokes about what truly excites practitioners upon opening the platform: “And you know, the joke that we have internally is that the most interesting thing off the bat to data scientists is the import data button.” Instead of squandering roughly 80 percent of their time reinventing data pipelines, data scientists can directly exploit clean, curated assets built by their data engineering colleagues. Downstream models inherit automated pipeline health checks, ensuring that any pipeline failures alert model builders immediately.
Beyond internal development, the environment manages dependencies and libraries securely. Teams can mirror Conda-Forge, incorporate internal package managers, and apply granular compute and security profiles to license-restricted or sensitive commercial packages. For data scientists who prefer working outside Foundry, open APIs, Python clients, JDBC, REST, and a native Hadoop-compatible file system allow tools like DataRobot, Dataiku, or AWS SageMaker to pull semantic structures, versioning, and lineage straight from the ontology.
- Supported languages and runtimes include PySpark, Pandas, R, and Spark SQL.
- Internal package management mirrors external ecosystems like Conda-Forge while enforcing data governance and license restrictions across custom compute profiles.
- Bi-directional connectivity to external ML platforms (AWS SageMaker, Dataiku, DataRobot) operates via open REST APIs, JDBC, and Foundry's Hadoop FS implementation.
---
[28:27](https://www.youtube.com/watch?v=uF-GSj-Exms&t=1707s) Model Objectives and Competitive Evaluation
To manage and evaluate models, Akshay opens the Model Objectives Library—described as "mission control" for all models accessible within that Foundry instance. Rooted in Palantir's defense deployments, operationalizing machine learning relies on a structured, three-part operational AI paradigm: first defining the explicit operational objective rather than a single technical algorithm; second, competing dozens of candidate models against that shared objective; and third, selecting and promoting winning models into production.
```mermaid
flowchart TD
accTitle: Operational AI Paradigm
accDescr: Three-step operational AI framework moving from objective definition to candidate testing and ontology binding.
subgraph Step1["1. Define Problem"]
A["Model Objective Library"]
end
subgraph Step2["2. Compete Candidates"]
B["Internal Models (Lasso, RF)"]
C["External Models (AWS SageMaker, Azure)"]
D["Comparison Dashboard (ROC, Metrics)"]
end
subgraph Step3["3. Operationalize"]
E["Bind to Ontology Type System"]
F["Deploy to Operational Apps"]
end
A --> B
A --> C
B --> D
C --> D
D -->|"Select winner"| E
E --> F
```
The objective catalog provides a comprehensive 360-degree view: core problem descriptions, shared training data artifacts, downstream application lineage, and dependencies linking models into larger simulation chains. Models competing under an objective need not run within Foundry; external endpoints hosted on AWS, Microsoft Azure, or managed services like DataRobot are registered side-by-side with native builds.
Under the customer demand forecast objective, reviewers track submission histories from colleagues (such as Matt or Andrew), review why specific attempts like a Lasso regression were rejected, and enforce code-like change management. Across model comparison dashboards, teams benchmark candidate models—such as Random Forests, Support Vector Machines (SVMs), and linear regressions—evaluating performance metrics like ROC curves. When datasets contain personally identifiable information (PII) or sensitive parameters, Foundry cordons off specific evaluation metrics so that only cleared personnel can inspect them.
- Evaluation workflows treat machine learning models like software code, recording full audit histories, author details, and explicit rejection rationales.
- Comparative analytics benchmark algorithms side by side on standardized evaluation criteria, including ROC curves and business-specific KPIs.
- Built-in data governance allows organizations to segment and restrict access to sensitive model dimensions and PII features.
---
[31:44](https://www.youtube.com/watch?v=uF-GSj-Exms&t=1904s) Ontology Binding and Operational Control Towers
Once a candidate model wins an objective evaluation, it undergoes what Akshay terms its "coronation": binding directly to the enterprise ontology. This binding acts as an operational type system. In the featured example, a winning AWS SageMaker customer demand model maps input fields directly from the supply chain ontology (specifically unit `cost` and `price`). In return, its live inference endpoint outputs three forecast values—`demand`, `capacity`, and `inventory`—which map back onto ontological objects as model-dependent and time-dependent properties.
```mermaid
flowchart LR
accTitle: Ontology Model Binding Architecture
accDescr: Winning SageMaker model takes ontology inputs and maps predicted properties back into the ontology for operational applications.
subgraph OntologyInputs["Ontology Inputs"]
A["Cost"]
B["Price"]
end
subgraph WinningModel["AWS SageMaker Live Inference"]
C["Demand Forecast Model"]
end
subgraph OntologyOutputs["Ontology Properties"]
D["Demand"]
E["Capacity"]
F["Inventory"]
end
subgraph FrontEnd["Operational Surfaces"]
G["Supply Chain Control Tower"]
H["Operational Business Apps"]
end
A --> C
B --> C
C --> D
C --> E
C --> F
D --> G
E --> G
F --> G
D --> H
E --> H
F --> H
```
Akshay underscores the profound architectural leverage of this step: “Now this is key because this is basically giving us a type system for the models.” Once registered and bound to ontology properties, an ML asset is no longer hardcoded into an isolated tool; it becomes instantly accessible across dozens of business applications without manual custom plumbing.
To demonstrate this operational "final mile," Akshay transitions into a Supply Chain Control Tower application. Designed for frontline operators rather than data engineers, the interface bypasses technical backend definitions entirely, summarizing top-level metrics and rendering dynamic operational objects directly across a map interface.
- Binding binds live inference inputs (`cost`, `price`) to ontology properties and writes inference outputs (`demand`, `capacity`, `inventory`) back as model-dependent object attributes.
- The ontology type system decouples ML deployment from individual front-end builds, allowing one production model to simultaneously feed multiple operational interfaces.
- Control tower applications present roll-up metrics, geographical maps, and operational status without requiring business users to understand the underlying ontology mechanics.
[33:50](https://www.youtube.com/watch?v=uF-GSj-Exms&t=2030s) Operational Alerting and Taking Action
Akshay Krishnaswamy steps into the shoes of an operational end-user who does not need to understand data pipelines, transformations, or backend modeling: “I just know that I have a job to do.” In this scenario, he notices that a plant in Michigan is experiencing a dip in production capacity and needs immediate investigation. Operational alerts can reach users through multiple channels, including automated emails, SMS text messages, or direct integrations with enterprise messaging systems.
Opening the alerts view within the operational application, the user sees a prioritized stream of incoming issues and applies a left-hand filter to focus exclusively on high-priority alerts. Krishnaswamy selects an alert flagging a business interruption related to COVID-19. This alert synthesizes data from across the enterprise stack: it is generated by a model pipeline, pulls connected data from suppliers and plant object types defined in the ontology, identifies the exact impacted facility, and presents recommended interventions produced by predictive models.
```mermaid
flowchart LR
accTitle: Operational Alert to Ontology Action Flow
accDescr: Pipeline alerts feed operational views where user actions trigger audited ontology updates and write-backs.
subgraph Detection["Detection & Alerting"]
A["Model Pipeline / Alert Engine"] --> B["High-Priority Alert<br/>(e.g., COVID Disruption)"]
end
subgraph OperationalView["Operational Application"]
B --> C["Alert Details & Recommendations"]
C --> D["Pre-Configured Actions<br/>(Cancel, Reallocate, etc.)"]
end
subgraph OntologyCore["Ontology Core & Systems"]
D --> E["Ontology Action Engine<br/>(Validations & Permissions)"]
E --> F["Non-Destructive Write-Back<br/>(ERP / MES / Webhook)"]
end
```
The system goes beyond passive monitoring to empower immediate execution. Krishnaswamy emphasizes that operational software cannot simply stop at presenting data:
> “The critical thing here is we're not just stopping with looking at this alert and saying, 'well, OK, looks like we have a problem here.' We're saying we want to be able to take action now to actually do something in response.”
Users are presented with pre-configured action buttons tailored to the context, such as partially fulfilling an order, initiating advanced inventory reallocations, or clicking a "Cancel Customer Order" action. Selecting an action presents a structured form that executes a non-destructive, auditable write-back directly into the ontology.
- Operational alerts can be delivered via email, text, or third-party messaging integrations.
- Pre-built actions on the alert interface include cancelling orders, partial order fulfillment, and multi-facility inventory reallocation.
- Model-generated recommendations are surfaced directly beside operational actions within the same view.
---
[35:40](https://www.youtube.com/watch?v=uF-GSj-Exms&t=2140s) Kinetics of the Ontology: Dynamic Actions and Enterprise Write-Back
To prevent data corruption, actions in Foundry are governed as first-class citizens of the ontology rather than ad-hoc application code. Krishnaswamy points out the inherent risk of ungoverned updates: “I don't want any user to be able to take any action on any part of the ontology and start to update things right. That would be chaos. We can't have people modifying values willy nilly.” Navigating back to the core ontology configuration interface, he explains that while object types define nouns and link types define relationships, action types supply the kinetic layer:
> “And this is the dynamism here that kind of makes the ontology truly special is we're not just talking about kind of semantics, we're also talking about kinetics.”
Opening the library configuration for the `Cancel Customer Order` action reveals its underlying structure, including its unique API name, runtime identifiers, target object types, parameter requirements, property modification rules, and strict validation logic. While this logic can be assembled via a point-and-click GUI, it can also be authored through code using Foundry's DataOps authoring environments.
Because actions are standardized centrally, individual application developers do not write custom mutation logic. Every action incorporates ambient awareness of the user's role and security clearance:
- If a junior employee attempts to cancel an order, the action definition can enforce an approval workflow requiring managerial sign-off before committing.
- Once validated, the action can trigger external webhooks or synchronization routines that execute write-backs into underlying enterprise resource planning (ERP) or manufacturing execution systems (MES).
- The Foundry platform manages orchestration, validation, auditable logging, and backend synchronization transparently behind the scenes.
---
[38:11](https://www.youtube.com/watch?v=uF-GSj-Exms&t=2291s) Rapid Application Development with Workshop and Slate
Krishnaswamy transitions to demonstrating how operational interfaces are constructed. Although the demo's supply chain control tower appears to be an intricate, bespoke enterprise software suite, it is entirely built using Workshop, Foundry's low-code and no-code application builder.
Developers build user interfaces visually by dragging, dropping, and configuring widgets rather than managing disconnected databases or writing one-off queries. Krishnaswamy demonstrates this by dropping a new object table widget onto the canvas, binding it directly to the ontology's plant objects, and typing in "MSC plant." Foundry instantly retrieves the corresponding operational data and renders it in accordance with the logged-in user's data-governance permissions. Pre-defined actions can be wired into interface buttons just as easily as data tables.
This abstraction radically changes the software development lifecycle inside enterprise organizations:
> “All of that is taken care of below the level of the application because of what we saw in the data integration, in the set up of the ontology, and the actions in the actual wiring in of the models that come together in these objectives and the actual binding of the models to the ontology, to these objectives as well, which means you can do a fully feature rich compound applications in a couple of hours or a day or two, as opposed to spending months or quarters of effort.”
Krishnaswamy notes that beyond Workshop, Foundry provides Slate—a sibling application designed for highly bespoke, code-driven UI requirements—alongside comprehensive APIs and developer documentation for building custom external applications against the ontology using standard web frameworks.
- Workshop eliminates boilerplate infrastructure management: database indexing, hosting environments, compute clusters, and custom storage layers are managed automatically.
- User feedback and operational model bindings are captured systematically beneath the UI layer.
- Interface components automatically respect the end-user's granular security and permissioning profiles.
---
[41:06](https://www.youtube.com/watch?v=uF-GSj-Exms&t=2466s) The Strategic Digital Twin Paradigm in Vertex
To illustrate the cumulative power of integrating data, ontology kinetics, and AI models, Krishnaswamy introduces the final demonstration tool: Vertex. He characterizes Vertex as the core graph and digital twin exploration environment within Foundry, designed to visualize complex multidirectional relationships across enterprise entities.
Opening an extensive, interconnected graph network, Krishnaswamy acknowledges that an initial glance might seem overwhelming: “if you were just to look at, we started here, you might think this looks kind of nuts, right? There's so much going on here, but now we know exactly what this is, right? These are this is just showing me kind of the kind of connection that I've built into my ontology”. Every node corresponds to an integrated object type, connected by mapped link types and overlaid with machine learning models.
This specific digital twin deployment is loosely modeled on an anonymized operational use case from one of Palantir's large medical supply customers during the early phases of the COVID-19 pandemic, where rapid visibility across global dependencies and real-time response actions were vital to operations.
[42:08](https://www.youtube.com/watch?v=uF-GSj-Exms&t=2528s) The Strategic Digital Twin and Value Chain Simulation
Akshay Krishnaswamy demonstrates how an organization manufacturing ventilators maps out its entire operational value chain within Foundry, spanning upstream suppliers, intermediate component goods, manufacturing plants, distribution centers, and hospital end customers. The platform offers a bird's-eye view of this connected network, allowing operators to scrub forward and backward across time to pinpoint where alerts fire, where inventory reaches critical thresholds, and where structural supply chain dislocations emerge. While consolidating dozens of previously fragmented data systems and models provides baseline visibility, the critical operational challenge lies in adapting strategy amid volatile conditions. During periods of simultaneous supply and demand shocks, historical forecasting models fail, forcing organizations to simulate urgent scenarios on a daily basis: what happens if a key supplier shuts down due to pandemic disruptions, or what occurs if a medical center suddenly orders ten times its standard allocation of ventilators?
```mermaid
flowchart LR
accTitle: End-to-End Value Chain and Simulation Architecture
accDescr: Diagram illustrating the flow from suppliers through distribution to customers, augmented by a simulation sandbox.
subgraph SupplyChain["Physical Value Chain (Ontology)"]
direction LR
S["Upstream Suppliers"] --> IG["Intermediate Goods"]
IG --> P["Manufacturing Plants"]
P --> DC["Distribution Centers"]
DC --> C["End Customers / Hospitals"]
end
subgraph SimulationSandbox["Simulation & Scenarios"]
direction TB
SP["Parameter Toggles (e.g., Valve Price = $400)"]
CM["Chained Multidisciplinary Models"]
SP --> CM
end
To address these exigencies, Foundry enables users to open a simulation tab and test operational alternatives directly against sandboxed representations of the complete ontology. Users can execute simple parameter adjustments—such as lowering a component valve price per unit to $400—and evaluate the ripple effects across every dependent metric modeled in the ontology. These scenario states can run continuously as live operational data updates. Furthermore, users can chain together compound changes across multiple disparate models, evaluating systemic outcomes across the entire value chain. Krishnaswamy emphasizes that this reflects the broader evolution of Foundry deployments, moving away from isolated point optimizations toward fully connected operations. As Akshay Krishnaswamy explains:
> “So there were simultaneous supply and demand shocks and kind of every pre-built model was kind of thrown out the window.”
He illustrates this transition using the oil and gas sector: organizations initially isolated data science and modeling to subsurface reservoir dynamics, but production optimization ultimately required integrating the subsurface with topside infrastructure, pipeline flow lines, and onshore refining facilities. Unifying these separate optimization and data regimes into a single interconnected ontology allows enterprises across industrials, finance, retail, and healthcare to run macro simulations that optimize end-to-end output. As Akshay Krishnaswamy notes:
> “And we see this sort of again and again, across whether it's sort of industrials or its finance or its retail or its health care, you name it, that that being kind of the North Star for us is how are we helping our customers really re-engineer and reintegrate their operations.”
- **Supply chain visibility**: Operators can scrub temporally across the end-to-end supply chain to isolate bottlenecks, inventory alerts, and dislocations.
- **Sandboxed scenario testing**: Stress-testing contingencies, such as a supplier going offline or a 10x demand spike from medical centers.
- **Model chaining**: Connecting individual functional models into an integrated graph to run compound multi-variable simulations.
- **Cross-industry operational integration**: Shifting enterprise strategy from departmental point solutions (e.g., subsurface oil modeling) to unified operational digital twins.
---
[46:15](https://www.youtube.com/watch?v=uF-GSj-Exms&t=2775s) Demo Recap: Data, Kinetics, and Operational Applications
Wrapping up the deep-dive session, Krishnaswamy summarizes the core architectural pillars that comprise Palantir Foundry. The foundation rests on data integration and ontology, utilizing more than 200 out-of-the-box, extensible connectors to ingest structured, IoT, unstructured, and geospatial data into a harmonized semantic model. The second layer integrates models, machine learning, and linear programming directly onto this foundation, creating an active operational environment. Rather than functioning solely as static representations, models bind directly to ontological objects and actions, governing how physical and digital processes flow based on model outputs. This architecture ensures governed model deployment while equipping model authors with granular visibility into how their models are exercised across operational tools and third-party APIs.
The ultimate destination of this architecture is the operational application layer, where between 70% and 80% of Foundry users spend their time. These front-end interfaces can be assembled using no-code, low-code, or professional developer frameworks, or exposed externally through open REST APIs. Krishnaswamy concludes by pointing toward future topics for subsequent sessions, including specialized interoperability patterns and Foundry's out-of-the-box workflow catalogs—which offer preconfigured templates for common enterprise patterns like automated alerting, entity resolution, resource allocation, and unified 360-degree plant monitoring. As Akshay Krishnaswamy observes regarding the system's interactive modeling capabilities:
> “The second piece is now how do we bring modeling, data science, linear programming into that same frame so we can actually overlay intelligence into that data and build out not just a semantic representation, but as we said before, a kinetic representation?”
- **Data connectivity**: Over 200 native, extensible connectors capable of handling streaming IoT, tabular, unstructured text, and geospatial data feeds.
- **Kinetic modeling**: Binds internal and external machine learning models to business entities, enabling algorithmic outputs to directly dictate operational workflows.
- **Operational user concentration**: Approximately 70% to 80% of the active user base operates primarily inside business-facing applications powered by low-code, no-code, or custom-code tools.
- **Pre-built workflow templates**: Catalogs available for rapid deployment of entity resolution, asset 360 views, smart alerting, and complex resource scheduling.
## Video description
Palantir Foundry Chief Architect Akshay Krishnaswamy takes viewers through a demo showcasing key components of and workflows in the Foundry operating system. Here, Akshay lends his expertise into the value for users – from IT, to data teams, to data scientists, to operational business users. Highlights include powerful data integration workflows, ML/AI integration workflows, analytics, application building, and how Foundry works with and maximizes existing data and analytics architecture and resources.
[0:11] Thank you, everybody, for joining us
[0:12] today to go through this walkthrough
[0:13] of the Foundry platform.
[0:15] There's a lot to cover, so it'll be
[0:16] a bit of a whirlwind tour.
[0:18] I won't be able to get to
[0:19] everything, but I'll try to give you
[0:20] a representative cross sample of
[0:22] kind of the key parts of the
[0:23] platform.
[0:24] Foundry behind the scenes is 100+
[0:26] different microservices kind
[0:28] of surfaced up as kind of two dozen
[0:30] different out-of-the-box user facing
[0:32] applications, actually a bit more.
[0:34] In addition to applications that you
[0:36] can also build. And these
[0:38] applications stretch across
[0:39] effectively every persona in
[0:41] the modern enterprise.
[0:42] So we'll try to take a tour through
[0:43] kind of some of those key personas
[0:45] and call out what kind of tools or
[0:47] services are used at every step
[0:49] along the journey.
[0:50] You know, we can think about the
[0:51] functionality and foundry kind of in
[0:53] three main parts.
[0:55] So there is the data and ontology
[0:57] piece. So how are we connecting to
[0:58] different data sources, data lakes,
[1:00] data warehouses and bringing that
[1:02] data together into a semantic
[1:04] foundation that can then be used by
[1:06] the entire organization.
[1:07] We call this an ontology.
[1:09] So we'll talk about the journey of
[1:10] how we connect into different data
[1:11] sources, refine them, build
[1:13] out data integrations with
[1:15] health checks, security, and kind of
[1:17] build out this ontology as
[1:19] sort of a starting place
[1:21] will then want to bring in kind of
[1:23] data science and modeling into that
[1:25] same foundation.
[1:26] So this is sort of the sphere of
[1:27] digital twin and modeling.
[1:29] So how do we think about leveraging
[1:30] business logic, data science,
[1:32] ML, LP models
[1:34] within the same foundation that
[1:36] we've built on the data side?
[1:38] So kind of trying to fuze data
[1:40] and models together into a common
[1:42] foundation through this ontology.
[1:45] And then kind of finally, we'll talk
[1:46] about how the combination of data
[1:48] and models comes together
[1:50] for different types of end users.
[1:52] So, you know, these are everyday
[1:53] users doing core operational
[1:55] functions in the organization,
[1:57] and this is 70 to 80 percent
[1:59] of users of Foundry in most contexts
[2:01] are sort of quote unquote
[2:02] non-technical users trying to
[2:04] make use of the fruits of all that
[2:05] labor towards real operational
[2:08] workflows and different
[2:10] applications that are kind of
[2:11] existential to the business.
[2:13] So let's start at the
[2:15] top with data and ontology.
[2:17] So what I want to do is first go
[2:18] into a first application
[2:20] here, which is called Monocle, which
[2:21] is sort of our data lineage graph
[2:23] for the story of kind of how the
[2:25] data comes together into an
[2:26] ontology.
[2:27] So here you'll see this is a pretty
[2:28] notional example.
[2:29] So it's a little bit simplified a
[2:31] supply chain ontology, right, which
[2:33] is showing me kind of the
[2:35] different concepts I'm going to work
[2:36] with in my supply chain demo.
[2:38] So I've put together common
[2:40] concepts, right? Like a supplier, an
[2:42] alert, a distribution center,
[2:45] plants, materials, et cetera.
[2:47] And each of these also have each
[2:49] of these objects have links between
[2:50] them. We'll go into how each of
[2:51] these objects also has actions
[2:53] associated with them.
[2:54] But the idea is, is that if we look
[2:56] at kind of any one of these objects,
[2:58] so we're going to go into the plant
[2:59] to begin with here to start.
[3:02] Each of these is the culmination of
[3:03] many different steps of data
[3:04] integration.
[3:06] So if we zoom out here, what we see
[3:07] kind of in this spiderweb diagram
[3:09] is the story of how we integrated
[3:11] different data sources to build this
[3:13] plant object to start with on the
[3:14] right hand side.
[3:16] So reading this from left to right,
[3:18] what we see here is we're actually
[3:19] pulling in kind of a couple
[3:21] different data sources.
[3:22] Typically, these diagrams are much,
[3:23] much larger, much, much more
[3:24] complex. But this is just a starting
[3:26] example of us connecting to.
[3:28] You'll see on the left hand side
[3:30] and SAP system as an example
[3:32] of one business system,
[3:34] Treasury.gov, which is an example
[3:36] of an open API-driven source
[3:38] for connecting to.
[3:39] And then I have a time series source
[3:40] here too, which is a synthetic
[3:42] sensor that I've set up just sort of
[3:43] in my environment to work with.
[3:46] And the idea is that every one of
[3:47] these steps, every one of these sort
[3:48] of rectangles or nodes you see in
[3:50] the graph is one step closer
[3:52] to refining, cleaning, joining,
[3:54] applying business logic to that data
[3:56] to get us to that semantic
[3:57] representation.
[3:58] So for instance, if I kind of take a
[4:00] look at one of these datasets, I can
[4:01] always sort of pop up and say, OK,
[4:03] what does this data actually look
[4:04] like? So let's take a look at the
[4:06] PySpark code here that
[4:08] actually shows us how we're actually
[4:09] applying logic at this step in the
[4:11] pipeline.
[4:12] If I select a different node, I can
[4:14] go and take a look at the history
[4:15] tab, and I can see that we have full
[4:17] data versioning for every
[4:19] version of the data that's updated
[4:20] in this particular part of the
[4:22] pipeline. And this is huge because
[4:23] I can go back and take a look and
[4:25] say, "OK, who actually updated
[4:27] this particular routine or this
[4:29] particular schedule of this data
[4:30] build?
[4:31] What was the actual result for this
[4:33] version of the data versus the
[4:34] current version of the data?
[4:36] And how can you actually roll
[4:37] forward and backwards through
[4:38] different versions of the data with
[4:40] the code and the metadata at each
[4:41] point in time?".
[4:42] So it's a powerful ability for me to
[4:44] not only look at data pipelines as
[4:46] they exist today, but also be able
[4:48] to look at historically how they
[4:49] might have changed over time.
[4:52] There's a few other things I want to
[4:53] make sure that we call out here kind
[4:55] of in this part of the
[4:57] Foundry platform.
[4:58] So kind of the build system for data
[5:00] or the data ops part of things.
[5:03] The first is, you see kind of these
[5:04] lines connecting all these different
[5:06] nodes together, and this is
[5:07] indication of of lineage
[5:09] and. Lineage is actually a concept
[5:11] that is intertwined with security
[5:13] in the Foundry platform.
[5:14] So we think about how we're securing
[5:16] data and how that security will flow
[5:18] into the ontology and into
[5:20] workflows. Beyond that, let's
[5:22] actually change the view here for a
[5:23] second to take a look.
[5:24] So we're going to change here to the
[5:26] permissions view and you'll see here
[5:28] that it's now showing me dynamically
[5:30] what my perms---, what my
[5:31] permissions are across this entire
[5:33] pipeline.
[5:34] So you'll see it's blue, I have
[5:35] access to everything here because
[5:36] I'm sort of the administrator here
[5:37] of this environment.
[5:39] But what's actually happening is
[5:41] we're assigning permissions
[5:43] to the data sources.
[5:44] So the SAP system, Treasury.gov,
[5:46] et cetera.
[5:48] Basically, the role based access
[5:49] permissions that might be coming in
[5:50] from an active directory system or
[5:52] some sort of other authorization
[5:54] scheme that an organization has,
[5:56] and we're then propagating those
[5:57] controls forward.
[5:59] So that means that every child
[6:01] will inherit the union of all the
[6:03] permissions of its parents
[6:05] to make that a little bit less
[6:06] esoteric, let's use another example.
[6:08] If I change this permissions view,
[6:09] which I can do as an admin, to my
[6:11] colleague Jason Richardson,
[6:13] we'll see that Jason doesn't have
[6:15] access to most things here.
[6:17] And that's because he didn't have
[6:18] access to anything except for the
[6:19] Treasury.gov source.
[6:21] And so when the permissions flow,
[6:23] he's going to lose access the moment
[6:24] we start to blend that source with
[6:26] other sources.
[6:28] You'll notice he actually has one
[6:29] sort of exceptional piece of access
[6:31] here where he should have known that
[6:34] he would have not had access
[6:35] originally, which is on this OFAC
[6:37] clean data set because we actually
[6:38] chose to situationally expand
[6:41] his permissions in this case,
[6:43] but not allow that to sort of
[6:44] propagate forward to any other
[6:46] pieces of the pipeline.
[6:48] The point here is is that we can mix
[6:49] and match very different types of
[6:51] security models to get very
[6:52] granular, robust results
[6:54] so we can intermingle role based
[6:56] access controls, classification
[6:58] based access controls and purpose
[7:00] based access controls all here.
[7:03] So we can have very fine grained
[7:04] control over who is doing what,
[7:06] with different personas, different
[7:07] parts of the organization through
[7:09] Foundry.
[7:10] And this was very much built from
[7:11] our own experience in the field as
[7:12] Palantir engineers, where if you
[7:14] thought about just doing security
[7:15] based off of the location of data
[7:17] and some sort of file system or some
[7:19] sort of bucket location, it became
[7:21] really hard to actually make sure
[7:22] that security was robust as that
[7:24] organization organically started to
[7:26] pull that data into other places.
[7:28] So data and security
[7:30] kind of flow together with lineage,
[7:32] and it's immutable as you work
[7:34] throughout the rest, throughout the
[7:35] entire platform or interact through
[7:37] the APIs.
[7:38] So that's sort of the first
[7:40] thing to call out here is security
[7:42] is sort of baked right in as part of
[7:43] the metadata in Foundry.
[7:45] The second piece I want to call out
[7:46] here as we kind of work through
[7:47] things is "OK, so I build out these
[7:49] pipelines that get to be quite
[7:50] robust to refreshing all the time.
[7:52] How do I keep these things healthy?"
[7:54] And so if I change this to now
[7:57] a data health view, what we're going
[7:59] to see here is this is a view into
[8:01] the parts of the pipeline that I've
[8:02] instrumented with data quality
[8:04] checks, and I can always kind of pop
[8:06] this open at the bottom to say,
[8:07] let's take a look at the checks that
[8:08] we have across this part of this
[8:10] pipeline.
[8:11] So I'm going to take a look here
[8:13] at one of these nodes, and we
[8:15] can take a look and say, let's add a
[8:17] data health check here.
[8:19] This is going to pull up a list of
[8:20] out-of-the-box health checks that we
[8:22] can sort of assign to different
[8:23] points in our pipelines.
[8:24] So is this data updating on time?
[8:26] Is it refreshing on the schedule
[8:28] that I expected? Are the files
[8:30] the size that I expect?
[8:31] And are we seeing the cardinality
[8:33] of different data columns with the
[8:35] statistical results that we expect?
[8:37] All of these things can be
[8:38] quantified here through
[8:38] point-and-click, but can also be set
[8:41] through code as well.
[8:43] So we'll go in in a second on how we
[8:44] actually author these
transformations,
[8:45] but the data health
[8:47] component is key to keeping
[8:49] these pipelines healthy as they're
[8:51] sort of refreshing all the time.
[8:53] And so having these checks right
[8:55] here saves you having to go to a
[8:56] different platform to kind of see
[8:58] what's going on there before you
[8:59] kind of come back to this platform
[9:02] here.
[9:03] All right.
[9:04] So let's now switch back
[9:06] to our sort of, our default
[9:08] view, and let's take a look at more
[9:09] detail on what's actually going on
[9:11] in these individual steps.
[9:12] So I'm going to open up one of these
[9:14] sort of, these the steps
[9:16] of logic here, and we're going to go
[9:18] in and take a look at the repository
[9:20] and how this particular result was
[9:22] built.
[9:23] So this is going to launch me into
[9:24] another application in Foundry
[9:26] called Authoring, which is an
[9:28] IDE or an integrated development
[9:29] environment where I can see here
[9:31] how I can actually make changes to
[9:33] this part of this pipeline with kind
[9:34] of full change management built in.
[9:36] So the key thing here is that you'll
[9:38] see, like we saw in Monocle,
[9:39] the previous application, there's
[9:42] sort of this branch icon here at the
[9:43] top. And what this allows us to
[9:45] do is treat data
[9:47] the way that we treat code.
[9:49] And so instead of making changes on
[9:50] the master branch and trying to then
[9:52] propagate my changes through which
[9:54] could cause all sorts of downstream
[9:56] issues of not careful, what
[9:57] we've actually done is virtualized
[9:59] the entire change management process
[10:01] that would normally involve going to
[10:03] a UAT environment, but have done it
[10:05] directly here in one instance,
[10:07] a foundry using logical isolation
[10:09] in a cloud-native paradigm.
[10:11] So what I can do if I want to make
[10:13] changes here is I actually open
[10:15] up a branched version of this
[10:17] part of the pipeline.
[10:18] And then when I've made my changes
[10:20] on that branch, I then create
[10:22] a pull request to actually
[10:23] merge my changes back into
[10:26] the master branch.
[10:27] So if we go into some of the old
[10:28] pull requests, take a look at what
[10:30] these proposed changes look like, we
[10:32] can actually see line-by-line kind
[10:34] of what those changes were.
[10:36] And we can also get an impact
[10:37] analysis of, if we were to merge
[10:39] this into master, what would be
[10:41] affected? And because security again
[10:43] gets blended through different
[10:44] parent permissions and different
[10:45] role paradigms, what security
[10:47] changes would actually occur as
[10:48] well? And you'd see we didn't
[10:49] actually see any in this particular
[10:51] case.
[10:52] This is a huge difference from the
[10:53] normal process of saying, OK, if I
[10:55] wanted to make changes, I'd have to
[10:57] clone all my pipelines and data over
[10:59] to a UAT environment, separate
[11:00] environment, make some changes
[11:03] and then hopefully say a prayer
[11:05] and then port them back to master
[11:06] and hope that everything just sort
[11:07] of works. Here, we can
[11:09] actually do that entire process
[11:11] with total logical isolation, total
[11:13] sandboxing, here.
[11:14] We can iterate on these branched
[11:16] versions of the data and actually
[11:18] use different kind of analytics
[11:19] tools and visualization tools with
[11:21] that branch data that we'll look at
[11:23] later and then we can choose to
[11:25] come back and then merge that into
[11:26] master.
[11:27] And the most powerful thing about
[11:29] this is everything is sort of
[11:31] git-based in terms of semantics.
[11:32] You'll see here the clone icon at
[11:33] the top, which means if we ever want
[11:35] to go back to a prior version of
[11:37] master or any of the other branches,
[11:39] we have a full commit log as well.
[11:41] So we're never, sort of, out
[11:43] of luck if we merged something in
[11:44] that we realized later has to
[11:46] actually be undone.
[11:47] We can always just move back like
[11:49] we can in Git with code to a
[11:51] previous form of the data.
[11:53] And so being able to treat data like
[11:54] code, having tje health checks,
[11:56] having the integrated security, we
[11:58] think gives you the build system to
[11:59] be able to go really fast when it
[12:01] comes to assembling and growing
[12:02] these data pipelines organically,
[12:04] which is always the case, right?
[12:06] These never sort of, sort of,
[12:07] waterfall method to building these
[12:09] things upfront that never changes.
[12:10] It's always a constant sort of state
[12:12] of iteration and being able to try
[12:14] to keep up with the latest demands.
[12:16] I want to show you guys one more
[12:17] thing before we go into the ontology
[12:19] and kind of bump things up a level.
[12:22] We've talked a lot about being able
[12:23] to author kind of data pipelines
[12:24] here the way that you can actually
[12:26] author pipelines and Foundry
[12:28] is, you know, by default, we
[12:30] actually offer two out -of-the-box
[12:32] compute engines that are
[12:33] auto-scaling.
[12:34] So this is Flink.
[12:35] We're running on Kubernetes for
[12:36] streaming computation and spark
[12:38] running on Kubernetes for batch
[12:39] computation.
[12:40] And so you can do any
[12:42] you can basically use any languages
[12:44] that have bindings to those two
[12:46] runtimes.
[12:47] And so if we go back to kind of our
[12:48] repository here, we'll see where
[12:49] we're using PySpark, we can
[12:51] use Spark sequel, we can use Java,
[12:53] we can use Scala.
[12:54] We even have bindings for Groovy.
[12:57] And so we adhere to open standards
[13:00] all the way through when it comes to
[13:01] code authoring and critically when
[13:03] it comes to data formats as well.
[13:04] So if you ever want to look at
[13:05] what's happening with kind of the
[13:07] resulting data in any step
[13:09] of any sort of transformation in
[13:10] Foundry, if we kind of look
[13:12] at what's happening here in the
[13:13] preview or we go to the History tab
[13:14] here, we'll take a look and we can
[13:16] see that any of the data
[13:18] here is effectively
[13:20] just data that's in parquet or
[13:22] in Avro or in sort of any open
[13:24] format that I'd expect.
[13:25] So I can always interoperate easily
[13:27] with any of the data here in
[13:28] Foundry.
[13:29] And critically, even though we're
[13:31] using Spark and Flink as our
[13:32] runtimes, if we take a peek
[13:34] at what's actually happening under
[13:35] the hood with Foundry's build
[13:36] service, we'll see it's just calling
[13:38] those two runtimes because we've
[13:40] registered them with Foundry.
[13:41] And so if you have a high
[13:42] performance computing environment or
[13:44] you have something that's an
[13:45] external compute engine like you're
[13:47] using something like another Spark
[13:48] environment or a proprietary
[13:50] runtime, we can register that
[13:52] runtime with Foundry as an external
[13:54] build worker.
[13:54] And when we refresh these pipelines,
[13:56] you do the orchestrations, Foundry
[13:58] will know at certain steps to go and
[14:00] federate that computation to that
[14:02] build worker, which allows
[14:04] you again to have a totally
[14:05] extensible compute framework here
[14:07] with what we think is great starting
[14:09] defaults. But you're never sort of
[14:10] locked in to just using the compute
[14:12] that we provide as part of Foundry.
[14:14] All right.
[14:16] So one more thing to show you guys
[14:17] and then let's bump it up a level.
[14:19] So we talked about being able to
[14:20] compute these pipelines and
[14:22] author them manually.
[14:23] What about data systems that we've
[14:25] seen over and over again, like the
[14:26] SAP's and the other ERPs of the
[14:28] world or the CRMs?
[14:30] So what we try to do there
[14:32] is try to say, can we actually
[14:33] implement what we think of as
[14:34] software-defined data integrations
[14:36] where you don't have to manually
[14:37] redo the kind of cleaning
[14:39] and transforming work that we
[14:41] think is actually quite standardized
[14:43] and possible through kind of
[14:44] ML-assisted techniques?
[14:46] So what I'm going to do is actually
[14:47] open up the kind of data source
[14:49] for this SAP instance we're
[14:51] connected to internally.
[14:52] And we're going to take a look here
[14:54] at kind of how this looks.
[14:55] So this is the SAP explorer
[14:58] that we have kind of as a kind of a
[14:59] rich connection interface here.
[15:01] And you'll see it's showing me kind
[15:02] of all the modules in my ERP estate
[15:05] like my MM, my data dictionaries.
[15:07] And it's also even pre-populating
[15:09] some workflows I might want to do
[15:11] typically that are common for SAP.
[15:14] And the power here is that instead
[15:15] of having to think about browsing
[15:17] through all the individual tables
[15:18] myself, we have a
[15:20] native connector connecting at the
[15:22] application layer, which is called
[15:24] NetWeaver, and we're actually
[15:25] dynamically pulling out all the rich
[15:27] metadata that actually tells us
[15:29] much more than just the raw table
[15:31] information in SAP.
[15:32] Like we're able to see all the
[15:34] German acronyms auto-translated
[15:36] for me. We're able to see kind of
[15:37] the foreign keys, the relationships,
[15:39] and the idea here is that we can
[15:41] kind of derive out that federated
[15:42] lineage and then auto build
[15:44] pipelines and even starting objects
[15:47] in a matter of hours, as opposed
[15:49] to weeks or months of manually
[15:50] recreating SAP transformations
[15:53] on the Foundry side.
[15:54] And this applies critically not just
[15:56] to standard modules like MM
[15:58] or SD or DD, but also
[16:00] Z tables that you might have
[16:01] customized. Because we're not just
[16:02] doing static mapping, we're doing a
[16:04] dynamic inference of the metadata
[16:06] through NetWeaver.
[16:07] And so if you have a very custom SAP
[16:09] estate or CRM estate and many people
[16:11] do, it's very simple to
[16:13] install the SAP connector, which
[16:15] is, you know, certified native,
[16:17] and be able to browse around
[16:19] and then kind of in a shopping cart
[16:20] like experience, pull in the data
[16:22] that's of interest to you into
[16:24] a set of pipelines in Foundry that
[16:26] you then start to work with.
[16:27] And actually, that was how we
[16:29] created these green pipelines here
[16:30] that we saw before, and we saw
[16:33] what was actually produced was
[16:34] PySpark.
[16:35] So even if it gives us a starting
[16:37] set of pipelines, we can always
[16:39] choose to expand that.
[16:41] We're never sort of given some sort
[16:42] of black box output that we can't
[16:43] change.
[16:44] And so that's an example of,
[16:46] for more common systems, the
[16:48] CRMs, the ERPs, the others of
[16:50] the world, how we're trying to
[16:51] invest in speed, time
[16:53] to value speed for our customers
[16:55] to say "we don't want you to have to
[16:56] redo all those integrations if it's
[16:58] not required."
[17:00] All right.
[17:01] So we've talked a lot about, in this
[17:03] first mile, kind of getting data
[17:04] into the ontology.
[17:05] Now let's actually talk about the
[17:07] ontology itself and a little bit
[17:08] more depth.
[17:09] So I'm going to go now into one
[17:11] of these objects and kind of pop the
[17:12] hood on what's actually happening
[17:14] here. So to do that, I'm going to
[17:16] jump into our ontology management
[17:18] application.
[17:19] And this is a view that a data
[17:20] governance kind of team
[17:22] member or a part of the business
[17:24] working with it might start to get
[17:25] involved. Or they might say, "OK,
[17:27] we've done all the integration work
[17:28] now let's decide how we're going to
[17:29] actually make this appear to end
[17:31] users," right?
[17:32] So everything from this plant object
[17:34] we've been working with, is it a
[17:35] normally visible object?
[17:37] Is it hidden? Is it prominent?
[17:39] Is it something we're experimenting
[17:40] on? Or is it actually an active
[17:41] object that people should be using
[17:43] daily for different workflows?
[17:45] Literally, how are we mapping in
[17:47] every element from those kind of
[17:48] golden kind of datasets we
[17:50] produced into object
[17:52] form? So things like geospatial
[17:54] properties, how are those coming in?
[17:56] What is the API name for these
[17:57] different properties and the actual
[17:59] IDs as well?
[18:00] Because we're gonna want to use this
[18:01] with all of our different tools kind
[18:02] of in lots of different kind of
[18:04] architectures,
[18:06] and you'll see we have all this
[18:07] information kind of rolled up here,
[18:08] right? Including kind of the link
[18:10] types, usage information
[18:13] and on the sidebar here, we even
[18:14] have ways to go in and say, I want
[18:15] to apply additional security
[18:17] here, restricted views.
[18:18] I can do that here as well.
[18:20] I can also prime these objects
[18:23] for different types of workflows.
[18:25] So it might be the case that this
[18:26] plan objects going to be be
[18:27] primarily doing simulation based
[18:28] workflows or geospatial workflows.
[18:31] And what we can do here is sort of
[18:32] preset some metadata which
[18:34] you can always manually set
[18:35] ourselves that will just get us
[18:37] again time to value faster.
[18:38] Let's get these objects up and
[18:40] running so we can now start to work
[18:41] with them.
[18:42] And the idea is you do a little bit
[18:43] of configuration work here, which
[18:44] again can be templatized to a large
[18:46] degree, and business users can then
[18:48] dive in and immediately start to
[18:49] make use of this data in a host of
[18:51] different out-of-the-box
[18:52] applications in Foundry.
[18:54] So let's take a look at some of
[18:55] those applications that kind of come
[18:56] to life for a business user, for
[18:58] somebody who's non-technical, who
[18:59] probably isn't starting their
[19:00] journey in Foundry in the data
[19:02] lineage application, in the coding
[19:04] environments or kind of in the
[19:05] ontology management interface,
[19:07] either. They're probably starting in
[19:08] an application like Object Explorer,
[19:11] which is a kind of point-and-click
[19:12] way to be able to browse around
[19:13] different information in the
[19:14] ontology and sort of
[19:16] feel very familiar to folks who are
[19:18] kind of searching for information
[19:20] or kind of using kind of different
[19:21] sort of web applications day in and
[19:23] day out.
[19:24] So you'll see here that
[19:25] I have a lot of different objects
[19:27] here that are surface to me in
[19:28] Object Explorer.
[19:29] I've got my aircraft, my delays, my
[19:31] flights, from my aviation demo.
[19:33] I've got some marketing objects here
[19:35] called interactions campaigns,
[19:37] offers, things like that, and
[19:39] to search for something, it's as
[19:40] simple as searching for a type of
[19:41] object I'm looking for or any
[19:43] individual object property.
[19:45] So in this case, I want to look at
[19:46] those plants we saw before, and
[19:48] what this will do is actually launch
[19:50] me into an investigation or
[19:51] exploration that's been kind of
[19:53] pre-configured for me
[19:55] to be able to start to explore this
[19:56] data.
[19:57] So this is it's a very simple sort
[19:59] of set of visualizations here,
[20:01] right? It's showing me kind of where
[20:02] the where the plants are geospatial
[20:04] based on that geo data that we
[20:05] affixed.
[20:06] It's showing me some roll-up
[20:07] statistics like 30 days of
[20:08] inventory, production capacity,
[20:10] things like that.
[20:12] And if I want to go into a 360-view
[20:14] and one of these plants, I have a
[20:15] list here to be able to start to
[20:16] kind of dive in and take a look at
[20:18] some of this information at kind of
[20:19] a higher level.
[20:21] And the idea here is that, you know,
[20:22] it's intended to feel familiar again
[20:24] to folks who have worked with kind
[20:25] of business intelligence or
[20:27] visualization software and
[20:29] just roll up all that information
[20:31] that's coming from all those
[20:32] different data sources in a single
[20:33] view. Right. So I can see
[20:35] information about, like again, the
[20:36] geospatial information.
[20:37] It's address some unstructured
[20:39] data, like a schematic, maybe some
[20:41] risk factors or material information
[20:42] coming in from the ERP and EMS
[20:44] systems and even things like
[20:46] timelines as well here.
[20:48] And these, like 360 views, can look
[20:50] very custom and very different,
[20:51] depending on the user type or the
[20:53] business unit.
[20:55] And you might imagine that you know
[20:56] there are certain users that want to
[20:57] see IoT information or video
[20:58] information embedded here and others
[21:00] that want to see financial
[21:01] information or kind of more kind of
[21:03] CFO style of use.
[21:05] And so you can have different lenses
[21:07] or different kind of views assembled
[21:09] on the same types of objects here
[21:11] and the power of object you splurge
[21:12] that allows people to traverse the
[21:14] different objects in a completely
[21:15] security compliant way
[21:18] and at a scale which you could have
[21:19] millions or billions of different
[21:20] objects here where we're actually
[21:22] allowing people to kind of traverse
[21:23] in a way that that makes sense and
[21:24] isn't overwhelming.
[21:26] Or isn't too granular or unfamiliar
[21:27] for folks who are familiar with kind
[21:29] of -- more business centric tooling.
[21:32] So this is just one view into the
[21:34] data, though, I think it's important
[21:36] to realize that so you know, it's
[21:37] point and click, it's kind of based
[21:38] off of the object's in
[21:40] this paradigm.
[21:41] But if I'm somebody who is a more
[21:43] technical user like an engineer
[21:45] or somebody who's an analyst that
[21:47] maybe is used to working with series
[21:48] data, I might use a sibling
[21:50] application of object explorer,
[21:51] which is called Quiver. And Quiver
[21:53] here actually allows me to look at
[21:54] charting information on time
[21:56] dependent data coming in.
[21:57] So this is going to be streaming
[21:59] data coming in in real time
[22:00] in an oil and gas context or in
[22:02] utilities context.
[22:03] And as a user who might be using an
[22:05] application like this, I'm probably
[22:07] thinking in terms of not just
[22:08] point-and-click, but in terms of
[22:09] formulas and integrals
[22:11] and interpolation and scatter
[22:13] plots. And I can actually derive
[22:15] new data here.
[22:16] Just through point-and-click.
[22:17] So I can say, you know, give me the
[22:18] summation of these two series,
[22:19] produce another series.
[22:21] Let me actually look at the
[22:23] ongoing differential between these
[22:25] two pressures, and let's produce
[22:27] another pressure.
[22:28] I can even do things that are more
[22:29] sophisticated, like let me do a
[22:31] search across these series for any
[22:32] time the difference in these values
[22:34] is beyond a certain threshold.
[22:36] Or let me actually do a
[22:37] point-and-click training of a first
[22:39] approximation machine learning
[22:40] model. So I actually want to build a
[22:42] classifier, and maybe
[22:44] I kind of tinker with that here as
[22:45] somebody who is an engineer.
[22:47] And then I want to be able to then
[22:48] collaborate with somebody who's a
[22:50] data scientist on my team.
[22:51] And so I can export kind of my first
[22:53] approximation to Python
[22:56] code, kind of with full library
[22:58] semantics for interacting with this
[22:59] time series data in Python as well.
[23:02] And again, the power here is it
[23:03] looks pretty technical, looks pretty
[23:05] custom, but at the end of the day,
[23:06] I'm just interacting with those
[23:08] objects in my ontology like we saw
[23:10] before, so I can just kind of browse
[23:11] for more objects and plop them onto
[23:13] these plots to be able to use them.
[23:15] So another view into that
[23:17] ontology that we built that
[23:19] can be serviced by another type
[23:21] of user.
[23:22] If I think geospatial, let's say
[23:24] not just IoT centric or maybe object
[23:26] centric, I might want to use
[23:28] an application like the Foundry map,
[23:30] where I'm looking at kind of all my
[23:31] plants and distribution centers
[23:33] kind of here, and I can kind of
[23:34] toggle layers on and off as I
[23:36] expect.
[23:37] And I might want to say, you know,
[23:38] let's take a look at, you know, for
[23:40] this particular distribution center,
[23:42] show me kind of
[23:44] in a graph-oriented manner, all the
[23:46] customers connected to this
[23:47] distribution center, and it's going
[23:48] to visualize that here and allow me
[23:50] to kind of explore, you
[23:52] know, the different flows or kind of
[23:53] supply or logistics information that
[23:55] might pertain to the dependencies
[23:57] between different objects.
[23:58] And so this is another common view,
[24:00] again, looking at the same ontology
[24:02] just through a different lens.
[24:04] And so this hopefully gives you an
[24:06] idea of if you do that work of kind
[24:07] of hopefully being able to rapidly
[24:10] integrate in data from different
[24:11] sources, right?
[24:12] Or data lakes or data warehouses
[24:14] and layering in those health checks.
[24:16] Having that security built in allows
[24:18] you to quickly assemble this
[24:19] semantic model, which then opens
[24:21] the door to immediate access
[24:23] and exploration for different types
[24:25] of users.
[24:26] Whether it's an object explorer or
[24:27] it's in Quiver, or it's in sort of a
[24:29] map-based application.
[24:31] And that really is sort of the
[24:32] journey in a very, very
[24:34] short form of kind of the first mile
[24:36] of the platform, right?
[24:37] Which is sort of data and
[24:39] ontology.
[24:41] If we now think about how digital
[24:43] digital twins and modeling and data
[24:45] science come into this, it gets
[24:46] really exciting.
[24:48] And so the first thing I'll say
[24:49] here before we kind of go into the
[24:51] data science part of Foundry is
[24:54] if you talk to four or five data
[24:55] scientists inside of Palantir and
[24:57] ask them what tools they love to
[24:58] use, you'll get 10 different
[25:00] answers. People love to use,
[25:02] you know, Foundry's built in machine
[25:03] learning capabilities and authoring
[25:04] capabilities, but also they love to
[25:05] use data robot Dataiku,
[25:07] SageMaker, Azure ML,
[25:09] you name it.
[25:10] And so we've tried to build this
[25:12] part of the stack to set,
[25:14] with the philosophy in mind, of
[25:15] build anywhere and then when you're
[25:17] ready to deploy into operational
[25:19] applications, let's give you a
[25:20] streamlined way of doing that.
[25:22] And so as an example of how I might
[25:24] build a model end-to-end using
[25:26] Foundry's existing, kind of, data
[25:28] science tooling, I'm going to open
[25:30] up and kind of switch personas
[25:31] again. So we talked about the data
[25:33] engineering persona, some of the
[25:34] business personas, now let's think
[25:36] about the data science persona,
[25:38] where I'm now here in an environment
[25:40] that again looks kind of graph like
[25:42] or sort of a
[25:44] sort of lineage like, but
[25:46] is intended to feel very familiar to
[25:47] those who have used other data
[25:49] science tooling. So if I pop
[25:51] open one of the steps in my model
[25:53] here and I kind of zoom out, you'll
[25:54] see concepts like training sets
[25:56] and feature creation, kind
[25:58] of all the way back to
[26:00] the objects I'm actually pulling
[26:02] data from.
[26:03] And so every one of these nodes is a
[26:05] step of PySpark based
[26:07] transformation. I could be using
[26:08] Pandas.
[26:09] I can be intermixing R or Spark SQL.
[26:11] And you know, the joke that we have
[26:13] internally is that the most
[26:14] interesting thing off the bat to
[26:15] data scientists is the import data
[26:17] button.
[26:18] It's being able to say, "hey, you
[26:19] can get clean, consistent access
[26:21] to that data that you've built into
[26:22] the ontology or anywhere else in
[26:24] Foundry." And as a data scientist,
[26:25] I don't spend 80 percent of my time
[26:28] rebuilding these data pipelines
[26:30] myself. I can just tap into the good
[26:31] work of my data ops colleagues
[26:34] or my data engineering colleagues.
[26:35] And if anything goes wrong with
[26:37] those data pipelines like the ones
[26:38] we saw before, I can get immediately
[26:40] alerted to that because the health
[26:42] information will flow down to me as
[26:43] well.
[26:44] And so I have a stable, rich,
[26:46] healthy foundation to build on, and
[26:48] I can then kind of use all the
[26:49] packages and all the techniques that
[26:51] I am familiar with here to actually
[26:53] build out kind of different
[26:55] models end-to-end batch
[26:57] or live inference end points
[26:59] and then actually plug them directly
[27:01] into different operational
[27:02] workflows.
[27:04] And of course, I can make use of
[27:05] kind of all of the packages I would
[27:07] expect so we can mirror things
[27:09] like can't afford you.
[27:10] If you have your own package
[27:11] managers, we have the added
[27:13] benefit here of kind of
[27:14] you can set up custom profiles that
[27:16] not only have different sort of
[27:17] compute profiles
[27:19] associated with them, but also if
[27:21] you have particularly sensitive or
[27:22] license restricted libraries, you
[27:24] want only certain users to be able
[27:25] to use.
[27:26] We can enforce that to the same
[27:28] security perimeter that's enforcing
[27:30] data security and ontology security
[27:32] that we saw before.
[27:33] So it allows people to make kind of
[27:34] secure use of commercial libraries
[27:36] as well.
[27:38] And so the idea here is you
[27:40] know, build here. We think it's a
[27:41] great, streamlined set of tooling,
[27:43] or you can also connect in
[27:44] the same way that these tools are
[27:46] connecting.
[27:47] You can connect directly from the
[27:48] DataRobot to Dataiku, the
[27:50] SageMakers of the world to the
[27:51] ontology through open APIs
[27:53] or through Python clients that we
[27:55] provide to all to build your models
[27:57] and those environments as well.
[27:59] And you can connect via REST
[28:01] via JDBC via direct
[28:03] file access.
[28:04] We have an we have kind of a Foundry
[28:05] version of Hadoop FS, and
[28:07] it's super streamlined to get data
[28:09] sort of in and out of Foundry and
[28:10] not just data, but also lineage
[28:12] information, the semantic
[28:13] representations, all the versioning
[28:15] information, all that's available
[28:16] through the APIs.
[28:17] And so the idea is you build your
[28:19] models, you've built some here,
[28:21] you've built some on other tools.
[28:22] Now I want to be able to register
[28:23] them and use them in a variety of
[28:25] different end user applications.
[28:27] And so what I'm going to do now is
[28:28] open up my model objectives
[28:30] library.
[28:31] This is kind of mission control for
[28:32] all the models that I've been
[28:34] working with in this particular
[28:35] instance of Foundry that I have
[28:36] access to.
[28:37] And a lot of this paradigm was
[28:39] informed by some of our work in the
[28:40] defense space where
[28:42] there's kind of this three part sort
[28:44] of approach to deploying operational
[28:46] AI. There is, I first want to define
[28:48] the modeling problem, right?
[28:50] Not actually think about a
[28:50] particular model, but what is the
[28:51] objective I'm actually trying to run
[28:53] with here.
[28:54] I'm probably then testing dozens,
[28:56] if not more models against that
[28:57] objective.
[28:58] And then I'm figuring out how I want
[29:00] to then deploy
[29:02] the winning models into production.
[29:04] And so I'm going to open up a few of
[29:07] the objectives we have here so we
[29:08] can take a look at what's actually
[29:09] going on. And
[29:11] the critical thing here is this does
[29:13] not mean deployed in Foundry
[29:14] necessarily.
[29:16] Several of these models are living
[29:17] in other environments in Azure, in
[29:19] AWS and through managed services
[29:21] like DataRobot.
[29:22] And so we're just registering these
[29:24] models here, and we're going
[29:26] to basically have a holistic
[29:27] approach to comparing them as
[29:29] we think about which ones are going
[29:30] to be deployed into production.
[29:32] So if I open up my customer demand
[29:34] forecast, sort of objective here,
[29:36] you'll see at a top level it shows
[29:38] me all this kind of 360 information
[29:40] about the model, right?
[29:41] Hey, what are we trying to do with
[29:42] this?
[29:43] What's the approach kind of broadly
[29:44] defined?
[29:45] Some information about the latest
[29:46] releases, relevant files that
[29:48] actually informed or were used to
[29:49] train this particular model that
[29:51] we're commonly used by every
[29:52] different model that we tested,
[29:54] and even lineage information about
[29:56] the applications that are going to
[29:57] be depending on this model.
[29:59] And also, as we'll see a little bit
[30:00] later on, some information that
[30:02] we can about how we're actually
[30:04] chaining this model with other
[30:05] models inside of simulation
[30:07] environments.
[30:08] And it's all of that is kind of
[30:09] rolled up here for me and
[30:11] I can go in on the sidebar here, for
[30:13] instance, take a look and say, let's
[30:14] take a look at all the models that
[30:15] we've actually proposed to be
[30:17] kind of deployed against this
[30:19] objective right now.
[30:20] See, some from my colleague Matt,
[30:21] some from my colleague Andrew, and I
[30:23] can always look back in time to say,
[30:24] OK, for like this lasso model, we
[30:27] actually can see the details about
[30:28] where it was built, when it was
[30:30] built, and also if it was rejected,
[30:32] why that was.
[30:33] And so kind of the full kind of life
[30:34] cycle around kind of the approval
[30:36] process like we saw with data,
[30:38] how we're treating data
[30:40] ----- like code. We're also kind of
[30:42] treating models like code in kind of
[30:43] the same way the metadata around the
[30:45] approval process.
[30:47] And, you know, if I kind of switch
[30:48] over to another objective here,
[30:50] which might be my sort of campaign
[30:51] model, I can even go into the
[30:53] comparisons tab here and take a look
[30:54] and say, OK, so for different models
[30:56] that we're assessing, we rejected
[30:57] one of them, but let's still add it
[30:58] into the comparison.
[31:00] We have a random forest model and
[31:01] SVM model and then your regression
[31:03] model, and I want to I compare kind
[31:05] of the key theories, the key
[31:06] criteria across these models.
[31:07] So, you know, things like the ROC
[31:09] curves and how basically
[31:11] the different kind of core
[31:12] dimensions of evaluation
[31:14] are performing across these
[31:15] different models.
[31:17] And so you can kind of even
[31:18] customize very easily kind of what
[31:19] these core dimensions are,
[31:21] and you can even segment out things
[31:23] that are sensitive.
[31:24] So there might be, you know,
[31:26] personally identifiable information
[31:28] or things that have to be locked
[31:29] down.
[31:30] And you can actually cordon off that
[31:32] kind of feature comparison or that
[31:33] kind of dimensionality comparison
[31:35] inside of a different set of
[31:38] parts of the objective that are
[31:39] only open to certain types of people
[31:41] or certain folks with certain
[31:42] permissions.
[31:44] And so all this information is here,
[31:46] and the idea is that once you've
[31:47] sort of made our selection and
[31:49] tagged, the model is being ready for
[31:50] production.
[31:51] The kind of key step here, the kind
[31:53] of coronation is we're then
[31:55] going to actually bind this
[31:57] model to the ontology.
[31:59] Now this is key because this is
[32:00] basically giving us a type system
[32:02] for the models.
[32:03] And so what you see here at the
[32:04] bottom here with the modeling
[32:05] objective API is
[32:07] the winning model, which in this
[32:08] case was a SageMaker model
[32:10] is actually going to take,
[32:12] as two of its inputs, two
[32:14] properties from the ontology
[32:16] from from our supply chain ontology.
[32:17] We've been working with this entire
[32:18] time, so it's going to take the
[32:20] cost.
[32:21] It's going to take in the price into
[32:23] this live inference end point.
[32:25] And then every time it returns a
[32:26] value for the endpoint, we're going
[32:28] to basically take those three values
[32:30] - demand, capacity, inventory -
[32:32] and map those back onto the
[32:33] objects in our ontology as time
[32:35] dependent properties or, in this
[32:37] case, model dependent properties
[32:38] that could be time dependent as
[32:39] well. And so the idea is that we
[32:41] have configured the ontology
[32:43] to basically have
[32:45] to recognize to be aware of the fact
[32:47] that it's going to be receiving
[32:48] values from a model.
[32:50] And so this is huge because what
[32:51] this means is, with this binding in
[32:52] place, I can now use this
[32:54] model. That's sort of one,
[32:56] you know, ----- it's been competed,
[32:58] it's one it's now bound to the
[32:59] ontology.
[33:00] I can now through that ontology
[33:02] binding, insert the model into not
[33:04] just one application or five
[33:05] applications, but dozens of
[33:06] different applications and sort of
[33:08] seamlessly have it appear to end
[33:09] users.
[33:10] And so as an example of how that
[33:12] kind of comes together here in this
[33:13] kind of takes us to kind of our
[33:15] final mile, which is sort of
[33:17] operational applications.
[33:19] Let's open up a supply chain control
[33:20] tower example and take a look at how
[33:22] the data in the models kind of weave
[33:24] together for an end user
[33:26] application.
[33:27] And so what we're going to open up
[33:29] here is just an example of
[33:31] an application that again, might be
[33:32] a starting point for many users in
[33:34] the enterprise.
[33:36] This is sort of my top level control
[33:38] tower. It's showing me some roll-up
[33:39] statistics at the top, and
[33:41] I see here that we've got different
[33:43] objects here on a map.
[33:45] As an operational user, I probably
[33:47] don't care about what an ontology is
[33:49] or kind of all the things that we've
[33:50] been through. I just know that I
[33:51] have a job to do.
[33:52] So I see, you know, we have a plant
[33:53] here in Michigan that need to go
[33:55] take a look at actually that
[33:56] production capacity is starting to
[33:57] dip, and I want to know why.
[33:59] Maybe I received an alert about
[34:01] this, and so, you know, that alert
[34:02] could have come in via email or it
[34:04] could have come in via text or kind
[34:05] of any sort of integration with a
[34:06] messaging system.
[34:08] And I can go into my alerts tab now
[34:10] and take a look at kind of a
[34:11] prioritized ---- set of like
[34:13] kind of different alerts that I can
[34:14] start to action here.
[34:16] So you'll see there's all sorts of
[34:17] things that are coming in here, and
[34:18] maybe I just want to look at those
[34:19] that are high priority.
[34:20] So I'm going to filter here on the
[34:21] left hand side, and I'm going to
[34:23] take a look at one of these alerts
[34:24] here, which is a business
[34:25] interruption related to COVID.
[34:27] And you'll see that this is pulling
[34:28] together lots of different
[34:29] information from everything we've
[34:30] covered so far.
[34:31] Right. This alert was generated
[34:33] maybe by a model pipeline.
[34:35] It is pulling in data from the
[34:37] supplier, and the plants are
[34:38] different links in my ontology.
[34:40] It's showing me the impacted plant
[34:42] that this pertains to, and it's
[34:44] actually showing you recommended
[34:45] actions as well, which are in this
[34:47] case coming in from a model that
[34:48] I've built.
[34:50] The critical thing here
[34:52] is we're not just stopping with
[34:53] looking at this alert and saying,
[34:55] "well, OK, looks like we have a
[34:56] problem here." We're saying we want
[34:57] to be able to take action now to
[34:59] actually do something in response.
[35:00] And you'll see that we have
[35:02] different actions that we've
[35:03] actually pre-assembled for these
[35:04] users canceling an order
[35:06] or partially fulfilling an order or
[35:08] actually going into more advanced
[35:09] actions like reallocation that will
[35:11] look at in just a second.
[35:13] But if I hit this cancel customer
[35:14] order button, you'll see that it
[35:16] allows me now to sort of it kind of
[35:18] preconfigured and action I can take
[35:20] here on this particular alert or a
[35:21] related alert, and I can then choose
[35:23] to submit this in a way that
[35:25] will be nondestructively captured
[35:27] back into the ontology.
[35:28] And you might be asking, well, how
[35:30] does this work, right?
[35:31] I don't want any user to be able to
[35:32] take any action on any part
[35:34] of the ontology and start to update
[35:36] things right. That would be chaos.
[35:37] We can't have people modifying
[35:38] values willy nilly.
[35:40] Turns out, the way that actions work
[35:42] is they're actually part of the
[35:43] ontology at the core level.
[35:46] So if we go back to the ontology
[35:48] configuration interface that we saw
[35:49] before we were talking about
[35:51] bringing our plant together and all
[35:52] of the connections here, if we go
[35:54] back to kind of the main page, we'll
[35:55] see their object types, of course,
[35:57] that we're defining.
[35:58] There are link types which we've
[35:59] seen all throughout, but the
[36:01] critical third element is actions
[36:03] as well. And this is the dynamism
[36:05] here that kind of makes the ontology
[36:07] truly special is we're not
[36:09] just talking about kind of
[36:10] semantics, we're also talking about
[36:12] kinetics.
[36:13] We're talking about the kind of
[36:14] actions that can modify the
[36:16] state of the ontology in a compliant
[36:18] manner.
[36:19] And so if I, for instance, search
[36:20] for that cancel customer order
[36:23] action that we saw before, we'll see
[36:25] this is in our library of actions.
[36:27] And if I open this up, you'll see
[36:28] all sorts of related information
[36:30] like we have with other parts of the
[36:31] ontology, the API
[36:33] name for this, this cancel custom
[36:35] order, the actual ID that we can
[36:37] use, we can programmatically
[36:38] interact with this and the actual
[36:40] logic used to create this particular
[36:42] cancel customer order action.
[36:44] So we see here
[36:46] what objects that pertains to, what
[36:48] properties it will be updating,
[36:50] what parameters it takes and even
[36:52] what validations it uses as well.
[36:54] And this is all kind of configured
[36:56] here through point-and-click, but it
[36:57] could be configured through a much
[36:59] more kind of robust kind of
[37:00] code-based interface as well,
[37:02] using the authoring tools that we
[37:03] saw before here
[37:05] and kind of the more data ops part
[37:07] of the stack.
[37:08] And so with this action essentially
[37:11] defined every time I want to cancel
[37:13] a customer order, I can do so
[37:15] in a reliable, repeatable, auditable
[37:17] way.
[37:18] And so that means that every
[37:19] application builder isn't
[37:20] implementing their own version of
[37:22] what it means to cancel a custom
[37:23] order. It means they simply use
[37:25] this action of the library, and
[37:27] it knows intelligently how to
[37:29] basically modify different objects.
[37:32] It knows what sort of precautions
[37:34] to take. So if I'm a junior
[37:35] employee, it might be that when
[37:37] I click the cancel customer order,
[37:38] it's aware of who I am and it has
[37:40] to go and then get approval from my
[37:42] manager before it actually
[37:44] gets confirmed.
[37:45] And then it might be that the last
[37:47] part of this is a webhook or some
[37:48] sort of write-back routine that then
[37:50] actually synchronizes this change
[37:52] back to an ERP or back to
[37:54] an MES system.
[37:55] Again, all of that is a pretty
[37:56] complex flow for an action or a
[37:58] piece of logic that I don't want the
[38:00] application builder to have to think
[38:01] about. I just want them to be able
[38:02] to embed that piece of logic here as
[38:04] an action and have Foundry
[38:06] at a system level be able to deal
[38:07] with all that orchestration that
[38:08] happens thereafter.
[38:11] So we've kind of alluded to this,
[38:12] but what this means for the
[38:14] application builder is that even
[38:15] though these applications we've been
[38:17] looking at here in this particular
[38:18] supply chain control tower example
[38:20] looks very custom - It's
[38:22] actually all just built using a
[38:24] low code application builder, and in
[38:25] this case, a no code application
[38:26] builder. And if I want to add
[38:28] something here to the top, for
[38:29] instance, it's very simple, just a
[38:31] point-and-click my way into adding
[38:33] a new widget here in
[38:35] this particular view, so I could add
[38:36] an object table, for instance.
[38:38] And it's super simple to start to
[38:39] wire in different things
[38:41] into these views, right?
[38:42] Because I'm not dealing with pulling
[38:44] data into kind of a
[38:46] kind of siloed database and trying
[38:48] to do kind of things in a one-off
[38:49] manner. I'm connected directly to
[38:51] the ontology and so I can easily
[38:53] open up a set of objects
[38:55] you've been working with before,
[38:57] like the plants, and I can
[38:58] start to actually pull them in here
[39:01] and take a look at how they will
[39:02] actually get bound to these
[39:04] widgets that we've set up.
[39:06] And so here, I'll type in our MSC
[39:08] plant in this case, and
[39:10] it will now be able to pull in all
[39:12] that data in a way that is aware of
[39:13] who I am and my security profile.
[39:16] I can add all the properties here,
[39:17] and just like that, I've added in a
[39:19] new widget in the same
[39:21] way that I can add in data.
[39:22] I can add in those actions as well.
[39:25] And what this means is, as an
[39:26] application developer, I no longer
[39:28] have to think about the full stack
[39:29] of considerations myself every time
[39:31] I want to deploy a new operational
[39:33] workflow or application.
[39:35] I don't have to think about setting
[39:36] up a new hosting environment.
[39:37] The databases, the indexing, the
[39:39] compute, the storage, that's maybe
[39:41] non-database.
[39:42] How am I capturing back feedback
[39:44] from users? How am I binding models
[39:46] to the different application states?
[39:48] How am I capturing feedback from
[39:49] those models?
[39:50] All of that is taken care of below
[39:52] the level of the application because
[39:54] of what we saw in the data
[39:56] integration, in the set up of the
[39:57] ontology, and the actions in
[39:59] the actual wiring in of the models
[40:02] that come together in these
[40:03] objectives and the actual binding
[40:05] of the models to the ontology, to
[40:06] these objectives as well, which
[40:08] means you can do a fully feature
[40:10] rich compound applications
[40:12] in a couple of hours or
[40:14] a day or two, as opposed to
[40:16] spending months or quarters of
[40:17] effort.
[40:19] So we think this is a really
[40:21] powerful part of the platform, and
[40:22] oftentimes, you know, this is this
[40:24] is just, you know, an example of
[40:25] kind of where the kind of
[40:27] operational capability gets
[40:28] surfaced.
[40:29] Kind of what we've been looking at
[40:30] here is one example
[40:32] of an operational application
[40:34] builder called Workshop.
[40:35] There are other application builders
[40:37] in Foundry as well.
[40:38] So there's another one called Slate
[40:39] as sort of a sibling application.
[40:41] And the key thing here is, of
[40:42] course, you can go and you can build
[40:44] your own custom applications as
[40:46] well, and you can kind of do it an
[40:48] object oriented manner or even do
[40:50] it in a tabular manner or a more
[40:51] classical manner as well.
[40:53] There's kind of a full set of
[40:54] documentation here around not just
[40:56] sort of interacting with existing
[40:57] applications, but building your
[40:59] own applications, using the APIs
[41:01] and Foundry using every part of what
[41:03] we've talked about kind of
[41:04] throughout this demo.
[41:06] Awesome.
[41:07] Now I have one last thing to show
[41:09] you guys.
[41:10] And then then we'll sign off here
[41:11] for this particular demo,
[41:13] and that is kind of how these things
[41:14] start to come together in
[41:16] kind of a more strategic kind of
[41:18] digital twin paradigm.
[41:21] So what am I open up here is
[41:22] one final application here in
[41:24] Foundry that we call Vertex.
[41:26] Vertex is kind of like the map
[41:27] application in Foundry.
[41:28] Sorry, the graph application in
[41:30] Foundry you might think of, right?
[41:31] It's showing me kind of all the
[41:32] relationships here, kind
[41:34] of between all my different objects,
[41:35] right? Like if you were just to look
[41:36] at, we started here, you might think
[41:37] this looks kind of nuts, right?
[41:38] There's so much going on here,
[41:40] but now we know exactly what this
[41:42] is, right? These are this is just
[41:43] showing me kind of the kind of
[41:45] connection that I've built into my
[41:46] ontology, right, where every one of
[41:47] these object types has a lot of data
[41:49] being integrated into it.
[41:51] And then we've also overlaid the
[41:52] different machine learning models
[41:53] and data science approaches as well.
[41:55] So in this case, this is an example
[41:57] that's based off of
[41:59] one of our medical supplier
[42:00] customers, kind of loosely based
[42:03] off of anonymized, of course,
[42:04] from the work they did during COVID
[42:06] kind of the early phases of COVID,
[42:08] where they needed to really map out
[42:09] kind of the full flow of how they
[42:10] were building and shipping
[42:11] ventilators from everything
[42:13] from their upstream suppliers to
[42:14] intermediate goods to their plants
[42:16] all the way down to their actual
[42:18] distribution centers and their end
[42:20] customers themselves.
[42:22] And so what this is showing here is
[42:23] sort of the bird's eye view of the
[42:25] entire value chain, right?
[42:26] And being able to kind of scrub
[42:27] backwards and forwards in time and
[42:29] saying, show me where alerts are
[42:30] firing, where inventory is getting
[42:32] to dangerous levels, where we're
[42:34] basically experiencing kind of
[42:35] fundamental dislocations, right?
[42:37] And I can always kind of go
[42:38] backwards and forwards kind of scrub
[42:39] through kind of different points in
[42:41] time here to be able to look at kind
[42:43] of where things were in kind of the
[42:44] danger zone at different points in
[42:46] time.
[42:47] And so that's useful, of course, to
[42:49] be able to kind of be able to get
[42:50] visibility into the whole kind
[42:52] of connected chain here, which was
[42:53] spread across dozens of different
[42:55] data systems and models before.
[42:57] But the more important thing is, I
[42:58] need to now be able to kind of
[43:00] update my strategy and actually
[43:02] operate now in this sort of very
[43:04] volatile environment, which it was
[43:06] last year. Right. So there were
[43:07] simultaneous supply and demand
[43:09] shocks and kind of every pre-built
[43:11] model was kind of thrown out the
[43:12] window. And so they needed to be
[43:14] able to simulate kind of different
[43:16] scenarios that were exigent day in
[43:17] and day out.
[43:19] What would happen if one of our
[43:20] suppliers went completely offline
[43:21] given the pandemic?
[43:23] What would happen if one of our
[43:25] medical center customers had 10
[43:27] times normal demand they normally
[43:28] have for ventilators?
[43:29] How would we actually be able to
[43:30] meet these different requirements,
[43:32] given how we're currently doing
[43:33] allocation, how we're currently
[43:34] doing different supply tactics?
[43:37] And so what we can open up here is
[43:39] actually a simulation tab
[43:41] to think about running those
[43:42] simulations, those scenarios
[43:44] directly on top
[43:45] of sandbox versions of your
[43:47] world, right, of the full ontology.
[43:51] And so we can actually simulate
[43:52] directly here, given that we
[43:53] have the data in the models
connected,
[43:55] what would happen if that supplier
[43:56] went offline, for instance, and you
[43:58] can kind of run these simulations as
[44:00] kind of contained case studies.
[44:02] And so in this case, I can make a
[44:03] very trivial change, right, where I
[44:04] could say, let's literally just
[44:06] update the valve price per unit.
[44:08] What if it dropped to four hundred?
[44:10] Let's literally now simulate across
[44:12] the entire chain what effects that
[44:14] would have across kind of every
[44:16] dependent property that we have
[44:17] here, kind of modeled
[44:19] in the ontology.
[44:21] And so that's a very trivial
[44:22] example. We can now kind of have
[44:24] this sort of modified simulation
[44:26] of the scenario state continuously
[44:28] run as new data comes in
[44:30] and we can kind of continuously
[44:31] assess what its impact is.
[44:33] And as you can imagine, it gets much
[44:34] more complicated and sophisticated
[44:36] when you're testing compound changes
[44:37] to parameters across not just one
[44:39] model, but potentially many
[44:41] different models. So you can say I'm
[44:42] not just taking one model in, but
[44:43] I'm going to chain different models
[44:45] together and run a compound
[44:47] simulation across kind of the entire
[44:49] state or the entire value chain.
[44:51] And this this is, I think, where we
[44:53] really see kind of the the
[44:55] progression of customers working
[44:57] with Foundry kind of kind of move
[44:59] towards where you first were working
[45:00] with point applications or
[45:02] kind of starting workflows to begin
[45:04] with. But really, it's about the
[45:05] connected operations paradigm that
[45:07] unfolds by virtue of bringing
[45:09] together the ontology kind of
[45:10] incrementally and, you know,
[45:12] as an example, in oil and gas,
[45:13] initially, they
[45:15] were doing kind of point
[45:16] optimizations and simulations
[45:18] for one part of kind
[45:20] of a connected value chain, right?
[45:21] Just the subsurface.
[45:22] So they had one team working on
[45:24] the subsurface, integrating data,
[45:26] building models and kind of just
[45:28] looking at that element of what was
[45:29] going on.
[45:30] But of course, it's part of a
[45:32] network, right? The subsurface
[45:33] connects to the top side, connects
[45:34] to the flow lines, connects to the
[45:36] onshore.
[45:36] Each of those different functions
[45:38] had their own kind of siloed
[45:41] simulation and optimization and data
[45:43] regimes, and to really understand
[45:45] how to optimize production as a
[45:46] whole, for instance, they had to
[45:47] connect together all of
[45:49] those different parts of the
[45:50] organization into one ontology,
[45:52] connect together all the different
[45:53] models into a single chain
[45:55] representation.
[45:56] And then they could actually try to
[45:57] run these full-scale
[45:59] continuous simulations and begin to
[46:01] optimize production in that case,
[46:03] a kind of a full scale.
[46:04] They started to work towards really
[46:05] connecting or reconnecting their
[46:07] operations.
[46:08] And we see this sort of again and
[46:09] again, across whether it's sort of
[46:11] industrials or its finance or
[46:13] its retail or its health care,
[46:16] you name it, that that being
[46:18] kind of the North Star for us is how
[46:19] are we helping our customers really
[46:20] re-engineer and reintegrate their
[46:22] operations.
[46:24] So I know we've covered a lot today,
[46:26] so I won't I won't keep keep
[46:28] yammering on longer, but I just want
[46:29] to make sure that we can recap here
[46:31] a bit of what we've been through.
[46:33] Just to leave you with this.
[46:34] So, you know, we started at the top
[46:36] here with how do we think about kind
[46:37] of data and ontology.
[46:39] So data coming together from many,
[46:40] many different sources, structured,
[46:41] IoT, unstructured, geospatial,
[46:43] you name it, over 200 plus
[46:45] out-of-the-box data connectors that
[46:46] we've built for Foundry and
[46:49] is extensible so you can build your
[46:50] own and being able to bring
[46:52] kind of all of those kind of
[46:54] different pieces of data together
[46:55] into a semantic representation that
[46:57] allows for people to instantly start
[46:59] to look, interact and kind of wield
[47:00] that data.
[47:02] The second piece is now how do we
[47:03] bring modeling, data science,
[47:05] linear programing into that same
[47:07] frame so we can actually overlay
[47:09] intelligence into that data and
[47:11] build out not just a semantic
[47:12] representation, but as we said
[47:14] before, a kinetic representation?
[47:15] So how does how do things actually
[47:17] flow or get dictated in business
[47:18] process based on what the models
[47:20] dictate?
[47:21] And how can you sort of build models
[47:23] within Foundry, but also outside of
[47:24] Foundry, and then bind those models
[47:26] to the ontology?
[47:27] So you can then insert those models
[47:29] into operations in a way where
[47:31] you're both allowing
[47:33] for very robust and safe deployment
[47:35] of models, but also very rich
[47:37] feedback to model builders who can
[47:38] know because of the data lineage,
[47:40] the model lineage, kind of all the
[47:42] bookkeeping that Foundry does,
[47:43] exactly how users are using those
[47:45] models in different applications
[47:48] and also in external applications
[47:50] that are using the APIs.
[47:52] And then finally, we talked about
[47:53] kind of how this all comes together
[47:55] in again, where 70
[47:57] to 80 percent of Foundry users live,
[47:59] which is operational applications,
[48:01] which you can build using low code,
[48:02] no code or pro code application
[48:04] builders and can also,
[48:06] of course, be surfaced directly
[48:08] via the APIs if you want to build
[48:09] external applications as well.
[48:12] So there's a lot more
[48:14] we can cover in follow-on sessions.
[48:16] You've only shown you kind of a
[48:16] glimpse of kind of how all these
[48:18] different tools come together and
[48:20] Foundry into a cohesive platform.
[48:22] We've only shown you a glimpse of
[48:23] kind of all the different
interoperability
[48:25] patterns that exist in Foundry.
[48:27] We've only shown you a glimpse of
[48:28] how you can actually kind of
[48:30] deploy workflows using a workflow
[48:32] catalog out-of-the-box to get
[48:34] started really quickly, if you're
[48:35] doing an alerting workflow or an
[48:37] entity resolution workflow or a
[48:38] plant-360 or resource allocation
[48:40] workflow and all the pre-built
[48:42] templates we have for getting
[48:43] started super quickly.
[48:45] But we'll save a lot of that stuff
[48:47] for another time.
[48:48] Thank you everybody for listening
[48:49] and I hope
[48:51] we can talk to you guys soon.