Laser diode self-mixing: Range-finding and sub-micron vibration measurement
Applied Science
AI-assisted summary of Laser diode self-mixing: Range-finding and sub-micron vibration measurement — original source. Check the original for full context.
Source published:
Key ideas
- Self-mixing interferometry enables a single laser diode with an internal monitor photodiode to measure sub-micron target vibrations without external optical beam splitters or sensors. (0:00)
- Each full interference fringe cycle detected by the diode corresponds to approximately 325 nm of physical target displacement when operating with a standard 650 nm red laser. (9:24)
- The setup functions as a Doppler tachometer when targeted tangentially at a rotating shaft, generating an optical frequency peak on an FFT that scales proportionally with rotational speed up to 100 kHz. (18:12)
- Absolute range-finding on stationary targets is achievable by ramp-modulating the diode's injection current to induce an optical frequency chirp, creating interference beat fringes whose count correlates directly with target distance. (21:33)
Detailed notes
## Background This video was produced and published by Ben Krasnow on the YouTube channel Applied Science on December 10, 2018. According to the description, it demonstrates how a plain laser diode can easily measure sub-micron vibrations from centimeters away using self-mixing interferometry, as well as how the same optical feedback technique can be applied to absolute range-finding.
## TL;DR Ben Krasnow demonstrates self-mixing interferometry using a standard laser diode package containing an internal monitor photodiode, deconstructing various commercial diodes to explain their construction and optical feedback mechanisms. By coupling the photodiode output to a homebuilt battery-powered transimpedance amplifier and oscilloscope, he detects nanometer-scale vibrations on a miniature speaker cone, observing fringe counts and directional sawtooth waveforms. He then applies the setup as a laser Doppler tachometer to track the rotational speed of a spinning motor shaft using an FFT spectral display. Finally, Krasnow modulates the diode injection current with an AC ramp to sweep optical frequency over time, demonstrating stationary absolute range-finding through discrete interference beat fringes while examining practical noise and stability limitations.
## Atmosphere & style The presentation carries the calm, deliberate, and deeply curious ethos characteristic of benchtop experimental physics. Krasnow speaks in an approachable, matter-of-fact tone, breaking down intimidating electro-optical concepts with practical shop-floor demonstrations like de-capping diode cans on a lathe and wiring clean battery supplies. Watching the experiments feels intimate and methodical; the quiet hum of the lab is punctuated by oscilloscope traces jumping to life, revealing invisible acoustic ringing and sub-micron air currents that highlight the extreme sensitivity of the physical universe.
## Bulletin - [00:00](https://www.youtube.com/watch?v=MUdro-6u2Zg&t=0s) Self-mixing interferometry enables a single laser diode with an internal monitor photodiode to measure sub-micron target vibrations without external optical beam splitters or sensors. - [09:24](https://www.youtube.com/watch?v=MUdro-6u2Zg&t=564s) Each full interference fringe cycle detected by the diode corresponds to approximately 325 nm of physical target displacement when operating with a standard 650 nm red laser. - [18:12](https://www.youtube.com/watch?v=MUdro-6u2Zg&t=1092s) The setup functions as a Doppler tachometer when targeted tangentially at a rotating shaft, generating an optical frequency peak on an FFT that scales proportionally with rotational speed up to 100 kHz. - [21:33](https://www.youtube.com/watch?v=MUdro-6u2Zg&t=1293s) Absolute range-finding on stationary targets is achievable by ramp-modulating the diode's injection current to induce an optical frequency chirp, creating interference beat fringes whose count correlates directly with target distance.
## Key takeaways - [00:00](https://www.youtube.com/watch?v=MUdro-6u2Zg&t=0s) Laser diode self-mixing interferometry relies on coherent emitted light reflecting off a target back into the diode cavity, interfering directly with internal standing waves. - [01:24](https://www.youtube.com/watch?v=MUdro-6u2Zg&t=84s) Traditional three-lead laser diode cans house two distinct semiconductor dies: the forward/backward laser emitter junction and a rear-facing monitor photodiode originally intended for optical power regulation. - [01:24](https://www.youtube.com/watch?v=MUdro-6u2Zg&t=84s) Modern low-cost laser pointers often discard the internal photodiode to reduce costs, driving the diode via constant current and relying on mechanical shells that leave the third lead unbonded. - [03:58](https://www.youtube.com/watch?v=MUdro-6u2Zg&t=238s) Reverse-biasing the internal monitor photodiode generates a small reverse leakage current that changes proportionally to optical interference inside the laser cavity. - [05:46](https://www.youtube.com/watch?v=MUdro-6u2Zg&t=346s) A transimpedance amplifier converts microamp-level optical feedback current into a readable voltage signal, with AC coupling filtering out the static 50–60 µA DC emission background. - [09:24](https://www.youtube.com/watch?v=MUdro-6u2Zg&t=564s) Target displacement is quantified strictly by counting interference fringe cycles rather than measuring voltage amplitude, where one fringe represents a half-wavelength round-trip change (~325 nm). - [12:27](https://www.youtube.com/watch?v=MUdro-6u2Zg&t=747s) Driving a miniature speaker cone demonstrates sub-micron excursion tracking and directly visualizes inaudible mechanical ringing caused by asymmetric or square-wave drive signals. - [15:13](https://www.youtube.com/watch?v=MUdro-6u2Zg&t=913s) The interference fringes exhibit an asymmetric sawtooth-like waveform due to non-linear cavity dynamics, allowing unambiguous detection of whether the target is moving toward or away from the sensor. - [18:12](https://www.youtube.com/watch?v=MUdro-6u2Zg&t=1092s) Tangential alignment of the laser beam against a spinning motor shaft produces a continuous Doppler shift readable as a distinct spectral peak using an oscilloscope FFT. - [21:33](https://www.youtube.com/watch?v=MUdro-6u2Zg&t=1293s) Modulating the diode's injection current alters its emission frequency over time, enabling absolute distance measurement to a stationary target via photon round-trip time delays. - [24:26](https://www.youtube.com/watch?v=MUdro-6u2Zg&t=1466s) Current-ramped range-finding displays discrete stair-step interference fringes on the photodiode output, with the fringe count per cycle scaling directly with distance to the target. - [24:26](https://www.youtube.com/watch?v=MUdro-6u2Zg&t=1466s) While self-mixing enables vibration, velocity, and distance sensing from a single package, extreme sensitivity to ambient acoustic noise and mechanical bench vibration limits its practical industrial deployment.
## Detailed walkthrough ### [00:00](https://www.youtube.com/watch?v=MUdro-6u2Zg&t=0s) Introduction to Self-Mixing and the Nerd Thunder Collaboration
Ben Krasnow introduces the premise of the video: demonstrating how an ordinary laser diode can be used to make sub-micron vibration measurements from several centimeters away without requiring any other optical components. Before jumping into the bench demonstration, he mentions "Nerd Thunder," describing it as “a collection of youtubers that are doing a little cross promotion in December including Jeri Ellsworth who actually inspired me to start making youtube videos in 2011 so be sure and go check out those channels in the description.”
He begins with a simple bench setup featuring a raw laser diode emitting light without any external lens attached, producing a wide beam pattern. The diode draws close to 24 milliamps of current. A digital multimeter is hooked up to measure the current coming out of the diode’s internal monitor photodiode. When Krasnow passes a simple white card beneath the laser beam, the monitor current visibly changes on a live graph display. As Krasnow observes, “Did you expect that? That's actually kind of a surprise, right? I mean what's going on here? There's no sensor other than the laser diode itself.” When an external collimating or focusing lens is placed in front of the diode, the detection range increases because the lens collects and focuses more scattered light back into the diode package. When he replaces the plain white card with a card bearing a retro-reflector, the resulting signal becomes roughly ten times larger due to the retro-reflector returning a massive fraction of the emitted light directly along the beam axis.
[01:24](https://www.youtube.com/watch?v=MUdro-6u2Zg&t=84s) Deconstructing Laser Diode Packages
To explain how the diode detects returning light, Krasnow explains that traditional laser diodes contain a built-in monitor photodiode inside the can. Standard can packages usually feature three leads, signaling that there is more inside than just an emitting diode junction. To examine their internal architecture, Krasnow prepared several cross-sections: he mounted the metal cans in a lathe collet and carefully ground away the outer metal shells using a Dremel tool until the caps fell off.
Looking at the de-capped packages reveals two distinct dies inside classic designs: the laser diode junction itself and a monitor photodiode mounted directly behind it on the backstop. Because a laser diode junction emits light both forwards out of the package and backwards into the package cavity, the rear emission continuously strikes the monitor photodiode. The industrial purpose of this setup is closed-loop optical power control. As Krasnow explains, “The point of this is that if you want to really carefully control how much light is coming out of the laser junction due to things like manufacturing tolerances and temperature changes, you really want to know how much light it's emitting not just how much current it's consuming.”
However, modern low-cost laser diodes frequently omit the internal photodiode. In ubiquitous cheap red laser pens (which Krasnow notes can be purchased off eBay for about twelve dollars for a three-pack), opening the diode packages reveals that the photodiode die is entirely missing, even though the outer package retains three leads due to legacy manufacturing tooling. Manufacturers simply leave the third pin disconnected or bond it across another lead, driving the diode using a constant current source instead and tolerating optical output variations. In another dissected diode, Krasnow discovered a full integrated circuit die with a photodiode that handles autonomous regulation internally—a design unsuitable for external measurement experiments. In the extreme case of cheap mass production, the metal can is discarded completely, leaving a bare laser die mounted directly onto a scrap of PCB material.
```mermaid flowchart LR accTitle: Laser Diode Internal Power Monitoring accDescr: Diagram showing how a traditional laser diode uses forward and backward emission for optical power monitoring. subgraph Package["Laser Diode Package"] PD["Monitor Photodiode"] LD["Laser Diode Junction"] end Target["Target / Reflector"]
PD <-- "Backward emission" --> LD LD --> "Forward emission" --> Target Target -.-> "Reflected feedback".-> LD ```
- Dissected samples were machined in a lathe collet and ground open with a Dremel. - Classical three-lead cans include both a laser diode emitter and an internal monitor photodiode die. - Modern $12 three-pack laser pointers typically omit the monitor photodiode despite retaining three-pin packages. - Some specialized units integrate the regulation IC internally, while ultra-low-cost versions mount the bare die directly to PCB material.
[03:58](https://www.youtube.com/watch?v=MUdro-6u2Zg&t=238s) Basic Photodiode Wiring and Coherent Feedback
Older components with true monitor photodiodes have become difficult to source cheaply. Krasnow managed to acquire a closeout batch from Jameco, buying out the remainder of their stock. He explains the schematic configuration used in his first experiment: the laser emitter receives 24 mA of forward current, while the monitor photodiode is reverse-biased with roughly 2 volts applied across its cathode and anode pins. In this reverse-biased mode, the photodiode produces a reverse leakage current proportional to incident light, measuring roughly 50 to 60 microamps when the laser is operating steadily.
As the target card moves back and forth, the reflected light entering the package alters the photodiode reading, turning the assembly into an analog distance sensor. Krasnow points out that laser emission is coherent—meaning its waves share a uniform phase. Consequently, when reflected light re-enters the laser cavity, it interferes with the light being generated inside the diode itself: “What's cool here is that the laser diode light is coherent, meaning it's all in one phase, like one wave coming out of the package, so when we put a reflector down here, it's actually coherent light being reflected back into the package and we have the possibility of getting the light to interfere with itself.” This optical self-mixing phenomenon produces interference patterns that make sub-micron distance variations readable.
[05:46](https://www.youtube.com/watch?v=MUdro-6u2Zg&t=346s) The Transimpedance Amplifier Circuit
To measure dynamic interference fringes rather than just steady-state DC shifts, Krasnow replaces the slow digital multimeter with an oscilloscope and builds a transimpedance amplifier (TIA) circuit. The laser diode is driven with a steady 24 mA using a laboratory power supply running in constant voltage mode with a carefully preset current limit, chosen because the specific diode had been thoroughly pre-characterized.
```mermaid flowchart TD accTitle: Transimpedance Amplifier Schematic accDescr: Schematic showing the photodiode input feeding an op-amp transimpedance amplifier with dual 9V battery power. PD["Monitor Photodiode\n(Reverse-biased)"] -->|"Current signal (µA)"| InvIn["Op-Amp Inverting Input (-)"] GND["Ground"] --> NonInvIn["Op-Amp Non-inverting Input (+)"]
subgraph Feedback["Feedback Loop"] Rf["100 kΩ Resistor"] Cf["Small Capacitor\n(Bandwidth limiting)"] end
InvIn --- Feedback Feedback --- Vout["Voltage Output\n(100 mV / µA)"]
subgraph Power["Isolated Dual Supply"] B1["+9V Battery"] B2["-9V Battery"] end Power -.-> Vout ```
The transimpedance amplifier converts the tiny microamp current fluctuations into a workable voltage signal: - **Operational Principle**: With the non-inverting input grounded, the op-amp servos its output to drive current through the feedback network, holding the inverting node at a virtual ground (zero volts). - **Gain Setting**: A 100 kΩ feedback resistor yields a transfer ratio where 1 microamp of photodiode current produces 100 millivolts at the amplifier output. - **Filtering & Stability**: A small feedback capacitor is wired in parallel with the 100 kΩ resistor. While stray capacitance usually curtails amplifier bandwidth (which sits around a few hundred kilohertz to a couple megahertz), Krasnow intentionally includes a small capacitor here to suppress high-frequency noise and sharpen the oscilloscope waveform. - **Power Supply**: The op-amp is powered by two series 9V batteries wired back-to-back to establish clean, isolated +9V and -9V rails that float independently from mains ground, preventing ground loop interference and offering generous voltage headroom. - **Oscilloscope Coupling**: Although the amplifier itself is DC-coupled, Krasnow sets the oscilloscope channel to AC coupling. This rejects the large 50–60 µA DC background current caused by internal emission and displays only the microamp-level ripple current caused by optical feedback.
[08:11](https://www.youtube.com/watch?v=MUdro-6u2Zg&t=491s) Dynamic Vibration Testing with a Speaker
On the oscilloscope, a full-scale deflection of 200 mV corresponds to roughly ±1 microamp of current ripple around the stable 23.5 mA diode operating point. When a card bearing a retro-reflective sticker is moved or lightly tapped by hand, the signal responds vigorously, but manual movement introduces chaotic, irregular oscillations that are difficult to analyze systematically.
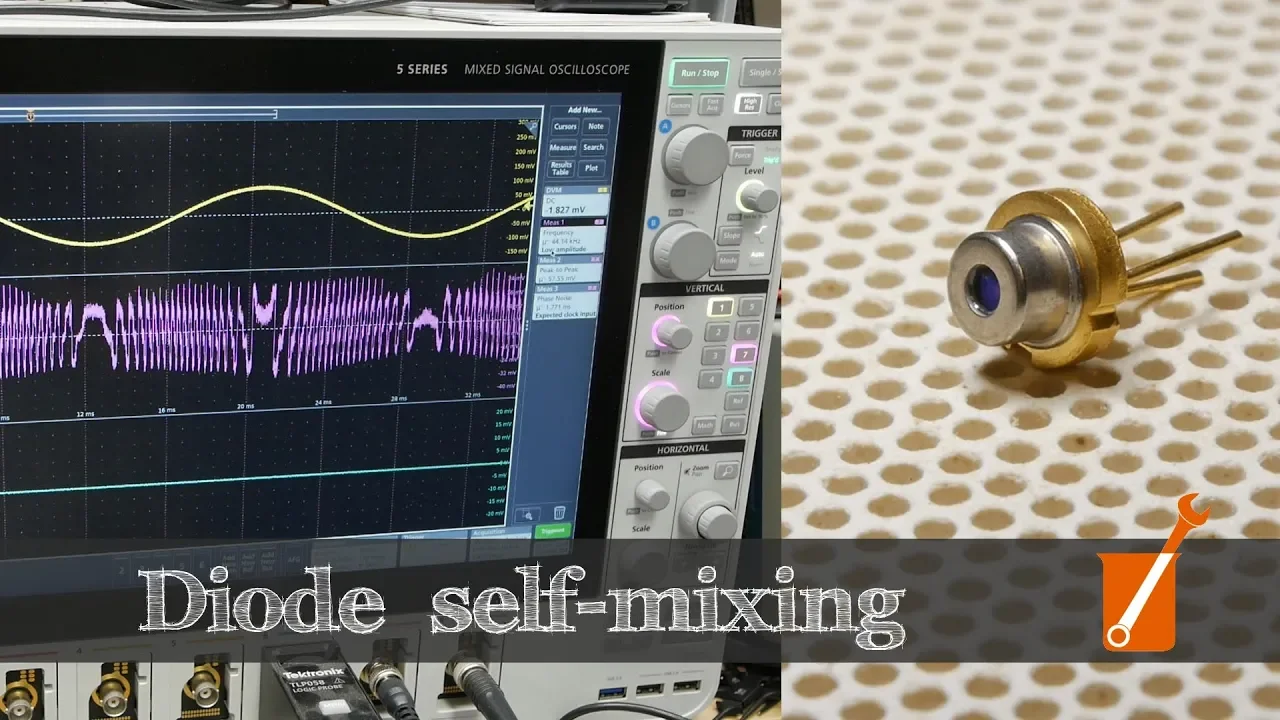
To generate a controlled, quantifiable vibration, Krasnow sets up an electromechanical test target: a miniature loudspeaker fitted with a small retro-reflective tag directly on its center cone. He drives the speaker using a function generator delivering a 60 Hz sine wave at 300 millivolts peak-to-peak. On the oscilloscope display, the yellow trace monitors the 60 Hz drive waveform fed to the speaker terminals, while the other trace visualizes the AC-coupled current signal streaming from the monitor photodiode transimpedance amplifier. Zooming into the photodiode trace reveals a distinct, highly repeatable waveform corresponding to the tiny physical excursion of the speaker cone.
[09:24](https://www.youtube.com/watch?v=MUdro-6u2Zg&t=564s) The Physics of Self-Mixing Interferometry
The demonstration begins with an oscilloscope displaying the signal from the monitor photodiode inside the laser diode package while aiming at a small speaker driven by a 60 Hz sine wave. When the speaker cone is in motion, the scope registers a high-speed alternating signal. Whenever the speaker reaches the apex or nadir of its travel and comes to a momentary stop to change direction, the output signal abruptly drops in speed and changes character before speeding back up during motion. Zooming in on the physical bench shows the laser diode aimed through a focusing lens beneath it, focusing a red spot directly onto a piece of retroreflective tape affixed to the speaker cone. At 60 Hz and driven by an amplitude of merely 300 mV peak-to-peak, the speaker is completely silent to human hearing due to poor low-frequency response, yet the laser picks up the movement clearly from centimeters away.
```mermaid flowchart LR accTitle: Self-mixing interferometry beam path accDescr: Optical path showing emission, reflection from a moving target, feedback into the laser cavity, and readout via the internal monitor photodiode. subgraph Diode["Laser Diode Package"] LD["Laser Diode Cavity"] PD["Monitor Photodiode"] end Lens["Focusing Lens"] Target["Target with Retroreflective Tape"]
LD -->|"Emitted coherent light"| Lens Lens --> Target Target -.->|"Reflected light (phase shifted)"| Lens Lens -.->|"Optical feedback"| LD LD -->|"Mixed optical power"| PD ```
The underlying mechanism relies on optical feedback. The diode emits coherent light that travels across the free-space gap, strikes the retroreflective target, and returns along the same path while preserving its phase coherence. If the reflected wave re-enters the laser diode in phase with the standing wave inside the cavity, constructive interference occurs, driving an increase in detected optical power at the integrated monitor photodiode behind the laser emitter. If the target position shifts by a half-wavelength ($\lambda/2$), the round-trip distance changes by a full wavelength, causing destructive interference and dropping the optical power on the photodiode. As Ben Krasnow explains, “This is basically an interferometer it's just built with no extra components basically the diode is doing the mixing for us which is why it's called a self mixing interferometer.”
- The red laser light has an approximate wavelength of $\lambda \approx 650\text{ nm}$. - Each constructive or destructive peak on the oscilloscope corresponds to the target traversing a distance of half a wavelength ($\approx 325\text{ nm}$ per half-cycle, or one full wave of displacement per fringe cycle). - Counting approximately 10 interference fringe peaks between turnaround points indicates a total mechanical excursion of about $10 \times 650\text{ nm} \approx 6.5\text{ }\mu\text{m}$.
---
[12:27](https://www.youtube.com/watch?v=MUdro-6u2Zg&t=747s) Speaker Excursion, Ringing, and Waveform Dynamics
To verify the relationship between physical displacement and optical fringe counts, the speaker's drive amplitude is adjusted while monitoring the yellow trace on the scope. Lowering the drive voltage reduces the fringe count to only four interference peaks between turnaround points. Cranking the drive amplitude up to 500 mV and then 800 mV peak-to-peak causes a massive burst of fringes to crowd between the endpoints, matching the expected increase in cone displacement. Next, switching the drive from a sine wave to an asymmetric ramp (sawtooth) waveform forces the speaker to move slowly in one direction and rapidly in the other; the photodiode signal shows fringes that are widely spaced during the slow ramp and tightly packed during the fast ramp.
When the ramp symmetry is driven to extreme asymmetry, the sudden edge delivers a mechanical impulse that rings the speaker cone like a bell. The resulting mechanical oscillation appears directly as secondary high-frequency ripples on the optical interference signal, visible even before any ringing manifests on the electrical drive monitor. Returning to a pure sine wave and adjusting only the drive frequency causes the interference peaks to compress or stretch along the horizontal time axis, but the absolute number of peaks between turnarounds remains constant because the travel distance has not changed. Krasnow notes, “So the amplitude of this signal actually doesn't tell us much of anything it's really the number of peaks and there's actually something else that's interesting here that we can check out.”
- The raw voltage amplitude of the photodiode waveform conveys little information; the metric of displacement is the cumulative count of interference peaks. - Changing the target motion velocity alters fringe frequency, whereas shifting amplitude directly scales the fringe count. - The optical readout functions as an ultra-sensitive vibrometer, revealing sub-micron structural ringing that is completely inaudible.
---
[15:13](https://www.youtube.com/watch?v=MUdro-6u2Zg&t=913s) Directionality, Cavity Feedback, and Audible Steps
Inspecting a paused trace of the fringe fringes reveals a distinctly asymmetric, sawtooth-like optical waveform rather than a pure sinusoid. The slope during target approach is noticeably different from the slope during target recession. This directional asymmetry is a hallmark of optical feedback interferometry: the non-linear interaction between the reflected optical phase and the diode cavity dynamics alters the laser's operating mode, making it possible to determine whether the target is moving toward or away from the sensor without quadrature detectors. Krasnow candidly admits regarding the literature, “I'll link to the paper that covers all this because the physics is slightly over my head.”
The physical setup is remarkably sensitive: ambient thermal drift, slight variations in diode drive current, and target retroreflection quality all affect performance. Krasnow touches on the stair-step appearance of the signal and points out that because the optical feedback alters the laser junction voltage and impedance, external monitor photodiodes are not strictly necessary. Monitoring the drive current or terminal voltage of the laser diode with a high-gain transimpedance amplifier can measure the interference fringes directly, though achieving this without a dedicated monitor photodiode proves difficult outside formal laboratory literature.
Switching the driver to a 60 Hz square wave produces a sharp snap that finally makes the speaker audible to the ear. Leaning in close, Krasnow demonstrates that the audible sound does not stem from the instantaneous edge itself, but rather from the severe mechanical oscillation ringing out across the cone membrane following the step impulse. This ringing decays gradually across the trace until the next edge arrives. Replacing the square wave with a gently sloped trapezoidal ramp silences the acoustic click by preventing cone resonance, bringing the motion trace almost flat. At this nanometer scale, Krasnow notes that a laser diode held only by an alligator clip on a workbench is likely moving by 650 nm simply from ambient room air currents.
---
[18:12](https://www.youtube.com/watch?v=MUdro-6u2Zg&t=1092s) Doppler Velocity Sensing of a Rotating Shaft
Moving beyond oscillating targets, the same self-mixing setup is repurposed to measure continuous constant velocity. The test object is a small DC motor whose cylindrical output shaft is wrapped in retroreflective tape. The laser is aligned to graze the outer radius of the spinning shaft tangentially, ensuring that the retroreflective surface travels at a continuous linear velocity directly toward or away from the beam path depending on the direction of rotation.
Powering the motor through a precision variable power supply allows smooth, fine adjustment of the rotational speed. Looking back at the oscilloscope, the photodiode output displays a continuous, densely packed waveform. Because the surface speed of the spinning shaft is orders of magnitude faster than a 60 Hz speaker cone moving across a few microns, the resulting optical fringe frequency is far higher. Krasnow observes that manually counting fringes individual wave by wave at these velocities is impractical, transitioning the scope over to a Fast Fourier Transform (FFT) mode to track the Doppler velocity peak in the frequency domain.
[19:19](https://www.youtube.com/watch?v=MUdro-6u2Zg&t=1159s) Motor Speed Measurement and Laser Tachometry
Ben Krasnow examines the Fast Fourier Transform (FFT) display on his oscilloscope to determine where the signal holds the most energy. Initially, the signal clips due to excessive amplitude, requiring him to turn the level down. He explains that the roll-off visible across the spectrum stems primarily from the amplifier circuit and general background noise rather than the optical signal itself. When he physically moves the motor out of the laser beam's optical path, the prominent spectral peak abruptly disappears, confirming that the minor surrounding noise spikes are not part of the physical phenomenon under test.
```mermaid flowchart LR accTitle: Laser Tachometry Signal Flow accDescr: Optical feedback from spinning motor shaft detected by photodiode and converted to frequency peak via FFT. subgraph Optics["Optical Domain"] LD["Laser Diode"] -->|"Emitted beam"| Shaft["Spinning Motor Shaft"] Shaft -->|"Reflected feedback"| LD end subgraph Electronics["Detection & Processing"] LD --> PD["Internal Monitor Photodiode"] PD --> AMP["Amplifier Circuit"] AMP --> Scope["Oscilloscope FFT Display"] end ```
Moving the motor back into the beam causes the peak to reappear at a frequency directly proportional to the rotational speed of the motor shaft. Ben demonstrates this relationship by adjusting the drive voltage supplied to the motor:
- Lowering the motor drive voltage causes the spectral peak to slide downward across the frequency spectrum. - At a lower voltage of 500 millivolts, the peak drops down to roughly 10 kHz, where individual raw signal waves become visible in the time-domain trace. - Increasing the motor voltage back up to 3.5 volts pushes the spectral peak all the way up to approximately 100 kHz. - Clearing the motor from the path extinguishes the peak, and reinserting it restores the spike immediately.
Ben highlights the versatility of this arrangement: “So it's actually a very effective tachometer: you can aim this at anything that's moving and not only determine its vibration to within 600 nanometer accuracy, you can also determine its speed very easily just by looking at the spectrum of a signal coming back there—pretty cool.”
[21:33](https://www.youtube.com/watch?v=MUdro-6u2Zg&t=1293s) Absolute Range-Finding via Current Ramp Modulation
Ben turns to absolute distance measurement, acknowledging the fundamental limitation of standard self-mixing interferometry: “Wouldn't it be nice if we could use this system to measure the distance from here to here? Seems almost impossible because this interferometry approach requires some sort of movement to actually get a signal, right? Like no matter where you are in the waveform, if this thing isn't moving, there's no signal we get, so there's no way you can measure an absolute distance with it.”
```mermaid flowchart TD accTitle: Ramped Frequency Modulation for Distance Sensing accDescr: Modulation of laser drive current shifts optical frequency over time to create interference with delayed reflections. CurrentRamp["Current Ramp Generator"] -->|"Modulates drive current"| DiodeFreq["Laser Diode Frequency Shift (Color)"] DiodeFreq -->|"Emits photon at t0"| Target["Stationary Target at Distance D"] Target -->|"Delayed return photon (t0 + dt)"| Mixing["Laser Cavity Self-Mixing"] DiodeFreq -->|"Operating at new frequency at (t0 + dt)"| Mixing Mixing -->|"Beat interference steps"| PD["Monitor Photodiode Readout"] ```
He overcomes this limitation by exploiting the optical property where altering the injection current into the laser diode slightly shifts its emission frequency (its color toward slightly red or slightly blue depending on whether current increases or decreases). By applying a ramped current waveform, the diode constantly shifts frequency over time:
1. The diode emits a photon at an initial frequency. 2. The photon travels to a stationary target, reflects, and returns to the diode cavity after a round-trip delay. 3. During that transit time, the current ramp has shifted the laser diode to a new instantaneous frequency. 4. The returning "old" photon interferes with the newly generated light inside the active cavity, yielding an interferometric beat signal. 5. Greater target distances increase photon round-trip time, creating a larger frequency differential and generating a higher number of interference cycles.
To implement this, Ben couples channel 2 of a function generator into the laser diode circuit using a capacitor. The primary DC operating current is supplied by a precision Source Measurement Unit (SMU) operating in constant voltage mode, while the function generator superimposes a 520 Hz, 30 mV AC ripple waveform on top of the DC bias. The physical target is a card backed with retroreflective tape mounted on the table, alongside a sliding block with retroreflective tape positioned approximately 2 cm closer to evaluate distance shifts.
[24:26](https://www.youtube.com/watch?v=MUdro-6u2Zg&t=1466s) Observing Stair-Step Interference and Practical Trade-offs
Ben inspects the oscilloscope traces to verify the operation of the modulated range-finding setup. The turquoise trace displays the AC injection from the signal generator (520 Hz, producing a ±5 mV swing at the laser diode), while the SMU registers a corresponding sinusoidal current fluctuation as it maintains constant voltage. The pink trace shows the monitor photodiode output, which exhibits a broad sinusoidal envelope caused by the laser cycling between brighter and dimmer states.
```mermaid flowchart LR accTitle: Step Count Comparison by Target Distance accDescr: Comparison of interference fringe count between far and close targets under current modulation. subgraph FarDistance["Far Target Position"] Ramp1["Modulation Slope"] --> StepsFar["~4 Stair-steps (Fringes) per Half-Cycle"] end subgraph NearDistance["Near Target Position (~Half Distance)"] Ramp2["Modulation Slope"] --> StepsNear["1 Stair-step (Fringe) per Half-Cycle"] end ```
Superimposed on top of the monitor photodiode's sinusoidal slope is a distinct, jagged "stair-steppy" modulation pattern representing the actual optical interference fringes:
- When current modulation is turned off, the regular stair-step pattern disappears, leaving only minor random fluctuations caused by ambient table vibrations. - Turning the 520 Hz modulation back on produces regular stair-steps across the rising and falling edges of the waveform. - With the retroreflective card at its far position, the waveform exhibits approximately four distinct stair-steps on each up-and-down slope of the wave. - Sliding the retroreflective block into the path to cut the target distance roughly in half reduces the count to just a single stair-step per slope, demonstrating that fringe count directly tracks target distance for a given slew rate and diode tuning coefficient.
Despite successfully proving the concept, Ben notes severe practical limitations. Simply tapping on the optical bench creates vibration artifacts that overpower the delicate single-fringe distance signal. He concludes: “The technique requires a fair bit of signal massaging and sort of compensation to be useful, which is why typically this is not used in fact in industry very much, but it is a pretty cool technique nonetheless, being able to extract, you know, submicron vibration information, distance information, and speed information all from one laser diode without really any external components—pretty cool.”
## Notable quotes > [01:24](https://www.youtube.com/watch?v=MUdro-6u2Zg&t=84s) if you want to really carefully control how much light is coming out of the laser junction due to things like manufacturing tolerances and temperature changes, you really want to know how much light it's emitting not just how much current it's consuming. — Ben Krasnow
## Mentioned Ben Krasnow, Applied Science, Jeri Ellsworth, Dean Segovis, Becky Stern, John Schuch, Darren Landrum, Joe Grand, Mark VandeWettering, Alan Wolke, Nerd Thunder, Jameco, Dremel, eBay, YouTube, Patreon
## Video description A plain laser diode can easily measure sub-micron vibrations from centimeters away by self-mixing interferometry! I also show how this technique can be used for range-finding.
http://sci-hub.tw/http://iopscience.iop.org/article/10.1088/1464-4258/4/6/371/pdf
https://www.jameco.com/Jameco/Products/ProdDS/2120428.pdf
https://www.spiedigitallibrary.org/journals/optical-engineering/volume-57/issue-05/051506/Overview-of-self-mixing-interferometer-applications-to-mechanical-engineering/10.1117/1.OE.57.5.051506.full?SSO=1
Nerd Thunder! Check them out! Dean Segovis: https://www.youtube.com/user/HackaweekTV Jeri Ellsworth: https://www.youtube.com/user/jeriellsworth Becky Stern: https://www.youtube.com/user/bekathwia Ben Krasnow: https://www.youtube.com/user/bkraz333 John Schuch: https://www.youtube.com/user/HackersBenchTV Darren Landrum: https://www.youtube.com/user/dmlandrum Joe Grand: https://www.youtube.com/user/kingpinempire Mark VandeWettering: https://www.youtube.com/user/brainwagon Alan Wolke: https://www.youtube.com/user/w2aew/
https://www.patreon.com/AppliedScience
[Source](https://www.youtube.com/watch?v=MUdro-6u2Zg)