Solar Roadways Faces Deficit as In-Road LEDs Drain Solar Output
EEVblog
Embedding photovoltaic cells beneath flat, textured glass slashes energy capture so severely that baseline LED lane markers consume a quarter of daily generation, making commercial payback impossible.
Solar Roadways surpassed $2.1 million in Indiegogo crowdfunding despite five years of development and an $850,000 government grant failing to produce baseline operational or vehicular safety data. (0:00)
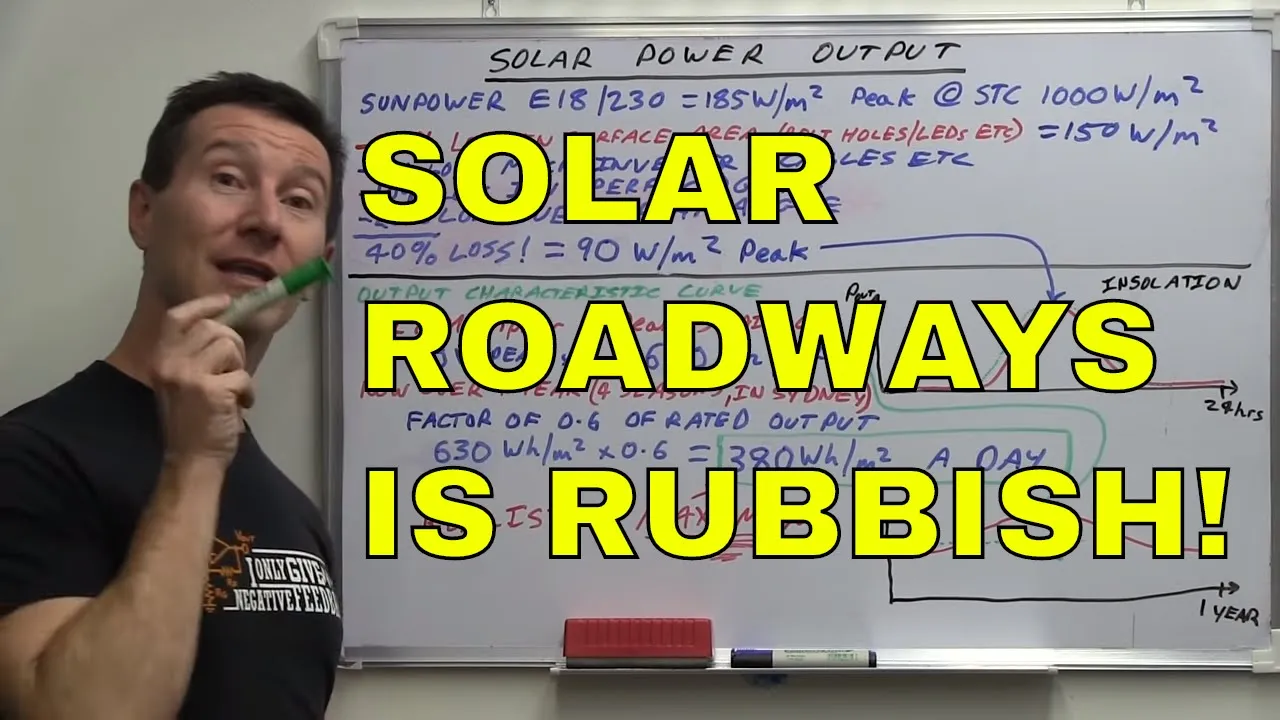
Practical derating factors—such as non-optimal flat mounting, surface cuts, thick textured glass, and inverter losses—cut baseline PV output from 185 W/m² down to an optimistic annual average of 380 Wh/m²/day. (9:49)
Continuous illumination of baseline LED lane markings on a 1 km stretch consumes approximately 720 kWh per day (30 kW continuous), cannibalizing roughly 24% of the road's ideal daily generation. (20:12)
At an optimistic feed-in tariff of $0.24/kWh, each modular tile generates under $10 of electricity per year, failing to recover basic hardware and microinverter costs before reaching end-of-life. (26:29)
Detailed notes
## Background
Published on June 20, 2014, by EEVblog on YouTube, this video features host Dave Jones addressing the viral Solar Roadways crowdfunding project that secured over $2.1 million on Indiegogo alongside nearly a million dollars in U.S. government grants. According to the show notes, Dave sets out to run the engineering and solar generation calculations to determine whether the concept is physically viable or economically absurd.
## TL;DR
Dave critically examines the technical and economic claims behind the Solar Roadways project, breaking down why embedding photovoltaic cells into pavement is fundamentally unviable. He calculates how active cell area losses, thick textured glass attenuation, flat horizontal mounting, and conversion inefficiencies drop ideal peak output down to roughly 380 Wh/m² per day. He then shows that baseline power requirements for embedded LED road striping alone would consume around a quarter of that daily output under optimal conditions, while overcast weather or road grime would turn the system net-negative. Ultimately, Dave demonstrates that the pitiful annual revenue of less than $10 per tile cannot even begin to justify the massive manufacturing, installation, civil engineering, and microinverter maintenance costs.
## Atmosphere & style
The presentation is vintage EEVblog: raw, energetic, mathematically rigorous, and delivered with passionate exasperation. Dave channels blunt engineering skepticism, tearing through promotional marketing with whiteboard calculations and datasheet comparisons rather than cynical malice. Watching it feels like sitting beside a seasoned electrical engineer who is simultaneously amused and deeply agitated by the triumph of viral hype over basic laws of physics.
## Bulletin
- [00:00](https://www.youtube.com/watch?v=obS6TUVSZds&t=0s) Solar Roadways surpassed $2.1 million in Indiegogo crowdfunding despite five years of development and an $850,000 government grant failing to produce baseline operational or vehicular safety data.
- [09:49](https://www.youtube.com/watch?v=obS6TUVSZds&t=589s) Practical derating factors—such as non-optimal flat mounting, surface cuts, thick textured glass, and inverter losses—cut baseline PV output from 185 W/m² down to an optimistic annual average of 380 Wh/m²/day.
- [20:12](https://www.youtube.com/watch?v=obS6TUVSZds&t=1212s) Continuous illumination of baseline LED lane markings on a 1 km stretch consumes approximately 720 kWh per day (30 kW continuous), cannibalizing roughly 24% of the road's ideal daily generation.
- [26:29](https://www.youtube.com/watch?v=obS6TUVSZds&t=1589s) At an optimistic feed-in tariff of $0.24/kWh, each modular tile generates under $10 of electricity per year, failing to recover basic hardware and microinverter costs before reaching end-of-life.
## Key takeaways
- [00:00](https://www.youtube.com/watch?v=obS6TUVSZds&t=0s) The viral crowdfunding campaign appeals heavily to environmental enthusiasm while ignoring core electrical engineering and physical limitations.
- [02:48](https://www.youtube.com/watch?v=obS6TUVSZds&t=168s) Static load demonstrations using a sub-1,000 kg tractor do not validate wet braking performance, tire traction, or resistance to abrasive road wear.
- [05:58](https://www.youtube.com/watch?v=obS6TUVSZds&t=358s) Dave categorizes the concept's flaws into five failure points: glass road surfaces, poor power generation, LED visibility and heat, harsh environment reliability, and unviable ROI.
- [09:49](https://www.youtube.com/watch?v=obS6TUVSZds&t=589s) Embedding PV modules into road tiles reduces active surface area by roughly 20% due to bolt holes, borders, and embedded LED cutouts.
- [09:49](https://www.youtube.com/watch?v=obS6TUVSZds&t=589s) A horizontal 0° tilt combined with optical attenuation from 12–15 mm textured glass and inverter wiring reduces peak module output to 90 W/m².
- [14:18](https://www.youtube.com/watch?v=obS6TUVSZds&t=858s) Integrating daily generation curves and seasonal weather factors limits realistic maximum daily production to roughly 380 Wh/m²/day.
- [17:18](https://www.youtube.com/watch?v=obS6TUVSZds&t=1038s) A standard 1 km, two-lane road section yields approximately 3,000 kWh per day under ideal, unshaded, dirt-free conditions.
- [20:12](https://www.youtube.com/watch?v=obS6TUVSZds&t=1212s) Shallow viewing angles from a driver's perspective cause an order-of-magnitude drop in perceived LED luminous intensity, demanding higher operating currents.
- [20:12](https://www.youtube.com/watch?v=obS6TUVSZds&t=1212s) Continuous operation of 60,000 lane-marking LEDs draws a 30 kW continuous load, causing the system to consume more energy than it generates on overcast days.
- [24:04](https://www.youtube.com/watch?v=obS6TUVSZds&t=1444s) Treating the electrical grid as an infinite, lossless bidirectional battery bank ignores fundamental instantaneous grid balancing and remote transmission losses.
- [26:29](https://www.youtube.com/watch?v=obS6TUVSZds&t=1589s) An annual gross revenue of roughly $33 per square meter means individual tiles yield under $10 per year, making financial payback an economic impossibility.
- [30:45](https://www.youtube.com/watch?v=obS6TUVSZds&t=1845s) Scattering thousands of microinverters and complex networking electronics beneath vibrating, traffic-bearing pavement introduces severe reliability and maintenance liabilities.
## Detailed walkthrough
### [00:00](https://www.youtube.com/watch?v=obS6TUVSZds&t=0s) The Indiegogo Sensation and the Allure of Solar Roadways
Dave opens by addressing the avalanche of viewer requests regarding the viral Solar Roadways campaign running on Indiegogo. With under 48 hours left to go, the campaign has raised an astounding $2.1 million, vastly exceeding its original $1.0 million goal—a target Dave already considers completely absurd. The creators pitch a grandiose vision: repaving every roadway across the United States with modular, solar-powered panels. On paper, it sounds seductively intuitive. Bitumen roads across the nation sit in the baking sun, absorbing heat, cracking, and crumbling. If billions of dollars must be spent repairing failing infrastructure anyway, why not replace it with power-generating solar panels instead?
Beyond simply harvesting green energy, the promoters load the concept with endless bells and whistles. They claim the panels can heat themselves to melt snow and ice automatically, feature embedded dynamic LED lane markers that reconfigure road layouts on the fly, and even offer far-fetched military applications. Dave acknowledges why the campaign resonates so strongly: it pulls hard on public environmental sympathy and eco-conscious strings. As a committed environmentalist and long-time solar energy proponent himself, Dave was initially willing to give the concept a chance. However, that goodwill evaporated almost immediately upon closer inspection. As Dave bluntly sums it up:
> “Hmm, this smells like some quality gold-plated bullshit here.”
- Crowdfunding haul: $2.1 million raised versus a $1.0 million target with under 48 hours remaining.
- Core promotional pitch: Replacing crumbling asphalt with modular solar panels, melting winter ice/snow, and dynamically rendering lane lines via integrated LEDs.
---
[02:48](https://www.youtube.com/watch?v=obS6TUVSZds&t=168s) Credentials, Prototypes, and the Lack of Hard Data
Dave notes that the founder behind the project holds a master's degree in electrical engineering and previously served as head of R&D in tech companies, meaning he ought to possess the fundamental engineering competence required to evaluate feasibility. Yet despite nearly five years of development backed by an $850,000 government grant, the execution reveals a massive disconnect. Dave compliments the physical look of the manufactured hexagonal prototypes, noting that impressive hardware engineering went into building them. However, behind the glossy presentation, the team appears to have bypassed foundational physics and engineering realities in favor of designing networked, LED-illuminated glass novelties without verifying whether the core concept actually works.
The campaign brazenly presents the technology as "proven" and ready for immediate mass production once funding is secured, but Dave points out an utter absence of real-world operational data. As physical proof of load-bearing strength, the founders showcase a tractor driving over the panels. Dave dismisses this as an unconvincing parlor trick, pointing out that laminated structural glass supporting static loads has been an industry standard for decades. More importantly, the vehicle featured is merely a John Deere 3038E—a compact utility tractor weighing under 1,000 kilograms (less than a typical passenger car). Critical verification data—such as dynamic vehicular stopping distance tests, wet braking performance, tire traction, and glass abrasive wear—is completely missing. Daytime visibility of the embedded LEDs is similarly unproven, brushed off by the inventors with hand-waving assertions that production models will just use higher-efficiency LEDs without considering the severe thermal design penalties involved.
> “So, after almost 5 years and 850,000 or more dollars they've spent on this thing, well, where's the data to show for it?”
---
[05:58](https://www.youtube.com/watch?v=obS6TUVSZds&t=358s) The Five Fundamental Engineering Hurdles
Dave structures his critique into five critical technical failure points that plague the Solar Roadways concept, outlining why the project is inherently flawed:
```mermaid
flowchart TD
accTitle: The Five Fatal Flaws of Solar Roadways
accDescr: Diagram illustrating the five core engineering and economic issues Dave identifies with the Solar Roadways project.
subgraph Physical ["1. Physical & Mechanical"]
A["Load-bearing glass surface<br/>Wear, abrasion, and stopping grip"]
end
subgraph Electrical ["2 & 3. Electrical & Optics"]
B["Power Generation Deficit<br/>Flat mounting, shading, dirty glass"]
C["LED Daytime Visibility<br/>High power draw and extreme heat"]
end
subgraph Systems ["4 & 5. Reliability & Economics"]
D["System Reliability<br/>Mesh networking, inverters, cables"]
E["Return on Investment<br/>Astronomical upfront hardware cost"]
end
Physical --> Electrical
Electrical --> Systems
```
1. **Glass as a Road Surface:** Static load tests under a sub-one-ton tractor fail to prove that textured glass can survive real road abuse. There is no proof of adequate vehicle braking performance, skid resistance in wet conditions, or resistance to abrasive micro-pitting caused by road grit.
2. **Usable Power Output:** Solar generation claims lack practical baseline evidence. Placing flat, non-optimal solar panels under thick, textured, inevitably dirty glass on the ground guarantees terrible yields, leaving questions about how much net excess energy can ever reach the grid.
3. **LED Visibility and Thermal Load:** Making LEDs sunlight-visible to drivers approaching from shallow road angles requires enormous luminous intensity and power. Their rebuttal—comparing road modules to head-on LED traffic lights—ignores the shallow viewing angles of drivers, light pollution, and the extreme thermal degradation of components sealed beneath glass.
4. **Harsh Environment Reliability:** Embedding micro-inverters, power cabling, complex switching electronics, and an ambitious wireless mesh network into a roadway creates an operational nightmare subject to vibration, mechanical shock, thermal cycling, and water ingress.
5. **Economic Return on Investment (ROI):** Once the staggering manufacturing, installation, civil engineering, and continuous maintenance costs of hardened electronic tiles are tallied, the solar payback period becomes an economic impossibility.
Dave rejects the notion that the founders are malicious con artists; rather, they are passionate true believers trapped in confirmation bias. As Dave observes of their blind dedication:
> “Yeah, they're not scammers, they're just delusional.”
He directs viewers to thorough testing and debunking experiments previously published by fellow science YouTuber Thunderf00t, who covered LED daylight washing, surface scratch resistance, and physical wear, before transitioning into his own detailed power and optical calculations.
[09:49](https://www.youtube.com/watch?v=obS6TUVSZds&t=589s) Real-World Solar Generation and Derating Losses
Dave sets out to determine whether a "solar freaking roadway" can realistically generate enough surplus energy to justify itself once practical infrastructure losses are accounted for. Using the benchmark recommended directly on the Solar Roadways website—the high-efficiency SunPower E18 230 W panel—Dave normalizes its output to a standard unit area. Because the physical module is slightly larger than a single square meter, its rated output scales to $185\text{ W/m}^2$ peak under Standard Test Conditions (STC: $1{,}000\text{ W/m}^2$ insolation at perpendicular incidence).
```mermaid
flowchart TD
accTitle: Solar Roadways Efficiency Derating Pipeline
accDescr: Flowchart illustrating the sequential efficiency losses reducing 185 W peak solar panel output to an annual daily yield of 380 Wh per square meter.
subgraph AreaLoss["Surface Area Loss"]
A["SunPower E18 Baseline<br/>185 W/m² peak (STC)"] -->|"Minus 20% (bolt holes, LEDs, borders)"| B["Available Active Area<br/>150 W/m² peak"]
end
subgraph OpticalAndElec["System & Environmental Losses (40% Total)"]
B --> C["10% Microinverter & Cabling Loss<br/>10% Glass Attenuation (12–15 mm)<br/>20% Flat Horizontal Tilt Loss"]
C --> D["Realistic Peak Output<br/>90 W/m² peak"]
end
subgraph TemporalDerating["Temporal & Seasonal Integration"]
D -->|"x7 (Ideal Daily Bell Curve)"| E["Ideal Summer Day Yield<br/>630 Wh/m²/day"]
E -->|"x0.6 (Annual Seasonal & Cloud Factor)"| F["Real-World Average Maximum<br/>380 Wh/m²/day"]
end
```
Dave proceeds to step through every inescapable real-world loss factor inherent to embedding PV modules into a roadway:
- **Surface Area Reductions (20% loss):** The hexagonal road tiles cannot have 100% active cell coverage. Bolt holes required to secure the panels to the concrete sub-base, cutouts for embedded LEDs, and perimeter borders subtract roughly 20% of the active PV area, bringing the theoretical peak down from $185\text{ W/m}^2$ to $150\text{ W/m}^2$.
- **Inverter and Cabling Overhead (10% loss):** Microinverters (typically handling roughly four tiles each) introduce around 5% conversion loss, while internal wiring and trunk lines running through concrete cable pits at standard utility voltages (110 V in the US) suffer significant $I^2R$ copper losses.
- **Glass Attenuation (10% loss):** The protective textured structural glass surface is estimated at 12 mm to 15 mm thick. Even assuming pristine, low-iron glass completely free of road dirt or tire grime, optical attenuation will reduce transmission by at least 10%.
- **Flat Orientation Penalty (20% loss):** Unlike rooftop arrays tilted around 20° toward the equator or active two-axis tracking systems, roads must lie flat. Horizontal mounting ($0^\circ$ tilt) incurs an inherent 20% insolation loss over panels oriented perpendicular to the sun.
Combining the cabling, glass, and angle penalties yields an immediate 40% loss against the available cell surface, reducing the operational peak power output down to just $90\text{ W/m}^2$:
> “So, 40% of loss on 150 W per square meter is 90 W per square meter, and that's a peak number.”
---
[14:18](https://www.youtube.com/watch?v=obS6TUVSZds&t=858s) Translating Peak Output to Daily Annual Yield
Peak power only occurs briefly when the sun is at its zenith on an unclouded day. To convert peak watts into usable energy (watt-hours per day), Dave integrates the area under the daily solar generation curve using empirical telemetry from his own 3 kW residential rooftop solar system in Sydney, Australia. On an ideal, clear November day (late spring/early summer in the Southern Hemisphere), daily output correlates to roughly seven times the peak instantaneous rating:
However, an ideal summer day does not reflect annual reality. Roads experience seasonal variance, low winter sun angles, overcast skies, and intermittent cloud cover. Applying a realistic year-round seasonal derating multiplier of 0.6 (derived from measured annual rooftop generation data comparable to regions like California), Dave calculates the true average daily output:
Dave underscores that this figure represents a generous upper ceiling, as it deliberately ignores real-world road realities like car shadows, roadside trees, dirt accumulation, and tire rubber marks:
> “That is the absolute best possible, I think, you can expect from these solar freaking roadway tiles and system. It's not going to get any better than that.”
---
[17:18](https://www.youtube.com/watch?v=obS6TUVSZds&t=1038s) Energy Generation vs. LED Power Consumption for a 1 km Road
Armed with the benchmark generation figure of $380\text{ Wh/m}^2/\text{day}$, Dave evaluates the net energy balance of a 1-kilometer stretch of standard two-lane roadway. Assuming a typical road width of 8 meters, a 1 km section represents a total surface area of $8{,}000\text{ m}^2$:
Next, Dave investigates how much of that power is cannibalized simply to illuminate the embedded lane markings. Replacing painted road striping requires at least three distinct lines: two outer edge lines and a center divider. Because road markings must appear substantial from the shallow viewing perspective of an approaching motorist, and to maintain redundancy against individual diode failures, each line requires at least two LEDs placed side-by-side:
| Lane Marking Component | Configuration Detail |
|:--- |:--- |
| **Marking Lines Required** | 2 outer shoulder lines + 1 center divider line |
| **Line Construction** | Double-strip (2 LEDs wide per line) = 6 parallel strips across road width |
| **Longitudinal Spacing** | 10 cm between consecutive LEDs |
| **LED Density per Kilometer** | 10,000 LEDs per strip $\times$ 6 strips = 60,000 LEDs per kilometer |
| **Power Rating per LED** | Estimated minimum of 0.5 W per LED |
To ensure markings remain visible in broad daylight through thick glass—especially considering standard LED emission angles (around 120°) relative to the shallow viewing angles of drivers—each LED must draw at least 0.5 W, and likely more. Dave prepares to examine commercial LED datasheets to see what continuous operation of 60,000 daylight-visible diodes will do to the road's net daily power budget:
> “You're going to need at least half a watt, even more per LED to get these things bright during the day.”
[20:12](https://www.youtube.com/watch?v=obS6TUVSZds&t=1212s) LED Viewing Angles and Continuous Power Consumption
Examining the datasheet for the Philips Lumileds Luxeon Rebel LEDs proposed for road markings reveals severe optical and electrical problems. When viewed from inside a vehicle at very shallow roadway angles (angular displacements exceeding 100 degrees), the relative luminous intensity drops by an entire order of magnitude compared to looking straight down into the diode, meaning the light virtually vanishes to the driver. Electrically, an amber Luxeon Rebel LED requires 350 mA (approximately 1 W) to reach rated luminous flux, while a comparable white Luxeon Rebel requires 700 mA (2 W). Even if the markers are aggressively dimmed at night to yield a conservative 24-hour average of 0.5 W per LED, 60,000 LEDs along a single kilometer of road draw a continuous 30 kW.
```mermaid
flowchart TD
accTitle: Daily Energy Budget per Kilometer
accDescr: Comparison of ideal solar energy generated versus energy consumed by basic LED line markings on one kilometer of roadway.
subgraph Generation["Energy Generation"]
A["Ideal Solar Generation<br/>3,000 kWh / day"]
end
subgraph Consumption["Baseline Line Marking Draw"]
B["60,000 LEDs @ 0.5 W avg<br/>30 kW continuous load"]
C["24-Hour LED Total<br/>720 kWh / day"]
B --> C
end
A -->|"~24% consumed under ideal sun"| C
D["Cloudy / Dirty Road Conditions<br/>Drops by 50% to 90%+"] -.->|"Consumes more than generated"| A
```
Multiplying 30 kW across 24 hours results in 720 kWh per day consumed purely by baseline line markings, excluding any illuminated warning signs, arrows, or hazard displays. Against an ideal practical generation of 3,000 kWh per day per kilometer, basic line markings instantly devour roughly 24% to 25% of the road's total energy output. Because road markings must stay illuminated around the clock regardless of weather, a heavily overcast day or a surface coated in standard road grime will cause the system to consume far more power than it produces. Adding heating elements to melt snow under these energy budgets is physically impossible given the meager power density available. Dave expresses his disbelief at the sheer scale of the mismatch: “On a bad day, you're going to be consuming more power than you generate.”
- **Viewing angle attenuation:** Relative luminous intensity drops by roughly an order of magnitude at the shallow viewing angles typical of a driver's sightline.
- **LED power requirements:** 350 mA (1 W) for amber and 700 mA (2 W) for white to hit datasheet rated luminous flux.
- **Average operating power:** Estimated at 0.5 W per diode factoring in daytime running and nighttime dimming.
- **Baseline electrical load:** 60,000 LEDs per kilometer equate to 30 kW continuous power.
- **Daily consumption:** 720 kWh per day dedicated strictly to standard lane markers.
- **Energy cannibalization:** Approximately 24% of maximum ideal generation is consumed by line marking alone under perfect conditions.
---
[24:04](https://www.youtube.com/watch?v=obS6TUVSZds&t=1444s) The "Virtual Grid" Fallacy and Solar Industry Realities
When the panels do generate a surplus on clear days, the project proponents claim the excess electricity can be fed into the power grid and later pulled back out at night to power the LEDs and heating elements. Treating the power grid as a free "virtual battery" fundamentally misunderstands how modern grid electrical systems function. Grids operate on an instantaneous supply-and-demand basis where electricity must generally be used as it is generated, rather than stored indefinitely without dedicated bulk storage infrastructure. Furthermore, routing power back and forth across remote highway stretches lacking nearby load centers introduces prohibitive transmission and distribution losses. Dave points out the absurdity of this oversight: “This guy has a master's degree in electrical engineering. This is basic stuff. The grid doesn't store energy like that.”
Mainstream solar installations struggle with return-on-investment timelines even when engineering every variable for peak performance: angling panels toward optimal solar insolation, eliminating shading, using thin, highly transmissive specialized glass, and building arrays near substations or directly on rooftops. Solar Roadways discards all of these design principles simultaneously by laying panels completely flat, covering them with thick, textured, lossy glass, placing them in dirty roadside environments, and saddling them with continuous 24-hour parasitic loads.
- **Grid dynamics:** The electrical grid requires immediate load balancing ("use it or lose it") rather than functioning as a lossless, bidirectional battery bank.
- **Transmission penalties:** Long stretches of rural roadways far from suburban demand centers suffer substantial resistive losses feeding low-density power into the wider network.
- **Standard solar best practices:** Roof-mounted and utility-scale installations rely on optimal tilt, maximum unshaded exposure, high-transmittance glass, and minimal internal loads to achieve financial viability.
- **Hostile operating environment:** Solar Roadways intentionally places photovoltaic cells in the worst possible mechanical and optical orientation.
---
[26:29](https://www.youtube.com/watch?v=obS6TUVSZds&t=1589s) The Comical Economics of Solar Roadway Payback
Evaluating the financial payback of these tiles reveals an unviable business model, even when granting extraordinarily generous assumptions such as zero power consumption from onboard LEDs and electronics. Operating at an ideal maximum yield of 380 Wh per square meter per day (0.38 kWh/m²/day) and assuming an optimistic US feed-in tariff of roughly 24 cents per kilowatt-hour, a single square meter generates only about 9 cents worth of electricity per day. Over a full 365-day year, this produces a gross revenue of just $33 per square meter under flawless, dirt-free conditions.
```mermaid
flowchart LR
accTitle: Annual Revenue Calculation per Square Meter
accDescr: Flowchart illustrating the math from daily insolation to annual revenue per tile.
A["Ideal Daily Generation<br/>0.38 kWh / m² / day"] -->|"x $0.24 feed-in tariff"| B["Gross Revenue<br/>~$0.09 / m² / day"]
B -->|"x 365 days"| C["Annual Revenue<br/>~$33 / m² / year"]
C -->|"Divided across ~4 tiles"| D["Annual Revenue per Tile<br/>Under $10 / tile / year"]
```
Because approximately four hexagonal tiles occupy a square meter, each individual tile generates under $10 per year in electricity sales. Factoring in real-world component lifespans degrades the financial outlook further; while LED luminosity might degrade by 50% to 60% after 100,000 hours, the mean time between failures (MTBF) for power electronics and microinverters in harsh, vibrating pavement is an order of magnitude lower (closer to 10,000 hours, or roughly one to two years). Even assuming an unrealistically long 5-year tile lifespan without component failure, a tile yields at best $50 of total revenue over its working life; a full 10-year run yields merely $100. That revenue is insufficient to cover the base bill of materials for the structural glass, circuit boards, LEDs, and microinverter, let alone the costs of roadbed preparation, installation, and ongoing maintenance. Dave underscores the inescapable financial failure: “You'd be losing money on this thing. And like even under ideal conditions, you're probably losing money on the whole deal.”
- **Feed-in tariff metric:** Evaluated at 24 cents ($0.24) per kilowatt-hour against a standard US retail baseline of 12 cents per kilowatt-hour.
- **Daily square-meter revenue:** 0.38 kWh × $0.24 = ~$0.09 per square meter per day.
- **Annual square-meter yield:** $0.09 × 365 days = ~$33 per square meter per year.
- **Per-tile revenue:** Under $10 per tile annually (assuming four tiles per square meter).
- **5-year cumulative return:** ~$50 per tile in total generated revenue.
- **10-year cumulative return:** ~$100 per tile, failing to offset the initial manufacturing cost of the module and its microinverter.
[30:45](https://www.youtube.com/watch?v=obS6TUVSZds&t=1845s) The Fantasy of Grid Feed-In and Infrastructure Realities
Dave wraps up his critique by highlighting that even the numbers he calculated represent an absolute best-case, ideal scenario. In reality, actual energy generation will be substantially lower—likely cut in half or reduced even further due to real-world inefficiencies, meaning the system simply cannot work. He takes direct aim at the promoters' naive assumptions regarding power distribution, venting his frustration at how detached from reality the concept is. As Dave puts it: “The grid isn't some magical utopia land in Willy Wonka's chocolate factory.” Interfacing with and exporting electricity back to the utility grid involves massive, complex engineering challenges that the broader solar industry already struggles with every day on standard rooftop and utility installations.
Instead of addressing these intricate transmission, safety, and balance-of-system hurdles, the project treats electrical integration like a trivial detail. Dave mocks their attitude toward power conversion: “And they're proposing, 'Oh yeah, we'll just throw in a couple of micro inverters for each, you know, a couple of panels and she'll be right. Bob's your uncle.' Well, no. It's not going to work. It's just ridiculous.” He points out that integrating the physical and electrical infrastructure beneath miles of highway cannot merely be hand-waved away as an afterthought. When it comes to real engineering answers for these monumental grid and infrastructure issues, Dave concludes that the project offers “None. Zip. Nada.”
- **Real-World Degradation:** Practical power output is expected to fall well below paper calculations—easily dropping by half or more once installed in an actual roadway environment.
- **Grid Integration Complexities:** Exporting distributed power into the utility network requires addressing grid stability, regulation, and transmission losses that Solar Roadways completely glosses over.
- **Microinverter Simplification:** The idea of scattering thousands of microinverters under roadway tiles ignores serious maintenance, reliability, and interconnect challenges.
- **Absence of Solutions:** No viable technical solutions have been presented to handle the immense electrical infrastructure required beneath traffic-bearing surfaces.
## Mentioned
EEVblog, Dave Jones, Solar Roadways, Indiegogo, Thunderf00t, SunPower E18, John Deere 3038E, Philips Lumileds Luxeon Rebel
## Video description
Dave debunks the Solar Roadways project that generated over $2.1M on Indiegogo, as well as almost another million dollars in US government funding.
PART 2 HERE: https://www.youtube.com/watch?v=HOZBrHqTJk4
In this video Dave does the solar generation calculations to see if this system is viable from an energy generation viewpoint, and also how much power the LED's might typically consume.
What are the losses in a typical practical system like this?
Are Solar Freakin Roadways feasible?, or just pie-in-the-sky rubbish?
This debunking covers only a couple of the likely dozens of major technical issues with this concept.
The main take-away form this video is that these solar roadways panels will never EVER be economically viable, and the solar payback is simply comical. EVen if they can meet ann the ridiculously high demands on a physical roadway.
Also, no amount of research will EVER make this a viable idea. You can't just take existing solar technology (which is borderline viable at best of times) and put it in the most hostile physical environment possible, least efficient environment possible, and most costly environment possible and expect it to be viable. It won't be viable, ever.
Datasheets & Links:
http://www.solarroadways.com
Sunpower E18 Solar Panels: http://hvce.com/admin/content/uploads/Sunpower230.pdf
Dave's solar system data:
http://pvoutput.org/intraday.jsp?id=22501&sid=20402&dt=20131104
John Deere 3038E tractor: http://www.tractordata.com/farm-tractors/005/9/1/5912-john-deere-3038e-dimensions.html
Philips Luxeon Rebel LED: http://www.philipslumileds.com/uploads/265/DS68-pdf
http://www.philipslumileds.com/uploads/17/DS61-pdf
EEVblog host Dave Jones evaluates the viral Solar Roadways crowdfunding campaign, arguing that foundational physical, electrical, and economic constraints render the concept of replacing bitumen roads with solar-generating glass tiles fundamentally unviable.
Absence of Critical Real-World Test Data (2:48)
Despite spending roughly five years in development and utilizing an $850,000 government grant, the Solar Roadways team has failed to supply rigorous operational verification data. Dave points out that the campaign's proof of physical resilience—driving a sub-1,000-kilogram John Deere 3038E tractor over the panels—demonstrates only static load bearing on laminated structural glass, which is already an established industrial standard.
Critical vehicular safety and endurance metrics remain unaddressed. Dave notes the absence of testing for dynamic braking distances, wet tire traction, abrasive wear, micro-pitting from road grit, and the daytime visibility and thermal impact of sealed LEDs. Rather than conducting these evaluations, the campaign has bypassed physical realities to promote networked, illuminated glass prototypes as mass-production ready.
Compounding Losses Reduce Usable Solar Yield (9:49)
Starting from the campaign's recommended SunPower E18 230 W panel, Dave calculates that standard test condition output of 185 W/m² quickly degrades once installed in pavement. Deducting 20% of surface area for bolt holes, borders, and LED cutouts leaves 150 W/m². Subsequent losses—including 10% for microinverters and cabling, 10% for optical attenuation through 12–15 mm of textured glass, and 20% for horizontal flat mounting rather than optimal equatorial tilt—slash operational peak output by 40%, down to 90 W/m².
Applying empirical rooftop telemetry, Dave maps this peak to an ideal summer day output of 630 Wh/m²/day, which seasonal derating (a 0.6 multiplier for clouds and winter sun angles) drops to an annual average ceiling of 380 Wh/m²/day. For an 8-meter-wide, 1-kilometer road stretch (8,000 m²), total ideal daily output tops out at approximately 3,000 kWh, before factoring in road shading, tire marks, and surface grime.
Parasitic LED Loads Cannibalize Power Generation (20:12)
To replace painted striping on a two-lane road, Dave calculates that three double-strip lines spaced 10 cm longitudinally require 60,000 LEDs per kilometer. Because driver viewing angles from vehicle cabins exceed 100 degrees, luminous intensity drops by an entire order of magnitude relative to a perpendicular view, requiring high-power diodes like Philips Lumileds Luxeon Rebels to remain visible.
Assuming a conservative 24-hour average of 0.5 W per diode after nighttime dimming, line markers alone impose a continuous 30 kW electrical load, consuming 720 kWh daily. This base marking overhead immediately cannibalizes roughly 24% of the road's ideal daily generation. Under overcast skies or with dirty glass, consumption quickly exceeds production, making additional ambitious features like automated heating elements for melting snow physically impossible.
Financial and Grid Integration Realities (26:29)
Evaluating revenue potential under an optimistic feed-in tariff of $0.24 per kilowatt-hour, Dave finds that a square meter generating 0.38 kWh/day yields only 9 cents daily, or about $33 annually. Across four tiles per square meter, an individual tile generates under $10 per year, yielding roughly $50 over 5 years or $100 over 10 years—revenue insufficient to cover the basic bill of materials for structural glass, microinverters, and circuit boards, let alone civil installation and maintenance.
Dave also criticizes the assumption that excess daytime energy can be fed into a 'virtual grid' and extracted loss-free at night. The electrical grid relies on continuous supply-and-demand balancing rather than acting as a cost-free bidirectional battery, and remote highway power generation faces severe transmission losses and balance-of-system hurdles that the promoters treat as trivial afterthoughts.
Dave concludes that the project's promoters are trapped in confirmation bias rather than being intentional scammers, promising unworkable infrastructure novelties. Real-world power yields will likely fall by half or more relative to ideal estimates, failing to justify the immense manufacturing, reliability, and grid distribution costs.
## Background
本期视频由 Dave Jones 于 2014 年 6 月 20 日发布在 YouTube 频道的 EEVblog 上。视频旨在系统拆解并揭露在 Indiegogo 上众筹超过 210 万美元、并获得近百万美元政府资助的“太阳能公路”(Solar Roadways)项目,通过光伏发电与 LED 能耗的底层计算,论证其在能源产出与经济回报层面的彻底不可行性。
## TL;DR
Dave 从系统工程与电气原理出发,指出太阳能公路缺乏制动摩擦、抗磨损和实际并网等核心实测数据。即便选用顶级光伏板,在扣除结构开孔、微型逆变器损耗、厚重承重玻璃以及 0° 平铺无倾角等现实折减后,全天候日均发电量上限仅为 380 Wh/m²。以此测算,1 公里双车道每日约 3,000 kWh 的理论发电量中,仅维持白昼可见的 LED 车道标线就需吃掉近四分之一的电能,遭遇阴雨或污垢遮挡时更会陷入严重能源赤字。即便完全忽略自耗电并给予超额上网电价补贴,单块地砖每年的发电收益也不足 10 美元,连硬件成本都无法收回,在商业和物理层面上都是不切实际的空想。
## Atmosphere & style
整期视频洋溢着 Dave 标志性的硬核工程师锐气,语速飞快且情绪饱满,充满了对伪科学与众筹狂热的犀利嘲讽。他既对发起者的环保热忱给予部分理解,又因对方具备工程硕士背景却无视电力基础常识而感到由衷的匪夷所思与愤怒。伴随着白板推导、规格书翻查与毫不留情的辛辣吐槽,整场讲解节奏紧凑、快意恩仇,让观众在严密的数据演算中直观感受到工程理性对空头情怀的无情降维打击。
## Bulletin
- [02:48](https://www.youtube.com/watch?v=obS6TUVSZds&t=168s) 众筹超210万美元且获美国政府近85万美元资助的“太阳能公路”(Solar Roadways)项目,缺乏刹车制动、耐磨衰减、强光可视性及真实并网等关键工程实测数据。
- [09:49](https://www.youtube.com/watch?v=obS6TUVSZds&t=589s) 扣除表面开孔、承重厚玻璃透光损失、水平无倾角及电气传输等损耗后,太阳能道路的实际峰值功率仅剩90 W/m²,全天候日均发电量上限仅为380 Wh/m²/day。
- [17:18](https://www.youtube.com/watch?v=obS6TUVSZds&t=1038s) 以1公里双车道公路计算,仅维持最基础的6万颗白昼可视LED标线,每天就需消耗约720 kWh,直接吞掉理想日发电量的近四分之一,阴雨天更将陷入严重能量赤字。
- [26:29](https://www.youtube.com/watch?v=obS6TUVSZds&t=1589s) 即便按0.24美元/kWh的高额上网电价且完全忽略自身能耗测算,单块地砖每年的最高电费收益也不足10美元,远无法覆盖硬件BOM及维护成本,商业模型在经济上彻底不可行。
## Key takeaways
- [00:00](https://www.youtube.com/watch?v=obS6TUVSZds&t=0s) “太阳能公路”项目凭借融雪、动态LED车道等环保宣传在Indiegogo筹资超210万美元,但构想完全脱离现实工程可行性。
- [02:48](https://www.youtube.com/watch?v=obS6TUVSZds&t=168s) 项目方虽拥有电气工程硕士背景并获政府资助,却用不足1吨的轻型拖拉机展示承重,缺乏真正的动态荷载与路面磨损数据。
- [05:58](https://www.youtube.com/watch?v=obS6TUVSZds&t=358s) 太阳能公路面临物理负载、发电效率、LED日光可视性、恶劣环境下精密器件可靠性以及天文数字成本这五大核心硬伤。
- [09:49](https://www.youtube.com/watch?v=obS6TUVSZds&t=589s) 路面地砖因螺栓孔与LED开孔导致有效光伏面积损失20%,峰值功率从理想的185 W/m²骤降至150 W/m²。
- [12:00](https://www.youtube.com/watch?v=obS6TUVSZds&t=720s) 在叠加厚玻璃透光折减(10%)、水平0°无倾角铺设(20%)及逆变器线缆损耗(10%)后,实际峰值输出仅剩90 W/m²。
- [14:18](https://www.youtube.com/watch?v=obS6TUVSZds&t=858s) 结合全天日照积分与全年季节云层折减(系数0.6),道路系统在最理想条件下的日均发电量上限仅为380 Wh/m²/day。
- [17:18](https://www.youtube.com/watch?v=obS6TUVSZds&t=1038s) 1公里双车道(8,000 m²)全天理论发电量约为3,000 kWh,但该数值是在无阴影、无轮胎油污的最乐观前提下得出的。
- [20:12](https://www.youtube.com/watch?v=obS6TUVSZds&t=1212s) 受汽车驾驶员超浅平视视角影响,LED相对光强发生严重衰减,必须以极高功率驱动才能在白天勉强可见。
- [21:25](https://www.youtube.com/watch?v=obS6TUVSZds&t=1285s) 按照昼夜平均单颗0.5 W计算,1公里路段所需的60,000颗LED标线每天将恒定吞噬720 kWh电能。
- [22:06](https://www.youtube.com/watch?v=obS6TUVSZds&t=1326s) LED标线需24小时恒定点亮,阴雨天或路面脏污导致发电锐减时,路面自身电能将严重入不敷出,电加热融雪更是无稽之谈。
- [23:20](https://www.youtube.com/watch?v=obS6TUVSZds&t=1400s) 电网遵循即发即用原则,项目方所宣称的“白天把电存入虚拟电网、夜间取回点亮标线”违背了基础电力系统常识。
- [26:29](https://www.youtube.com/watch?v=obS6TUVSZds&t=1589s) 即便在完全不计LED自耗电且补贴电价高达0.24美元/kWh的极端假设下,每平方米路面每年的发电收益仅约33美元。
- [28:10](https://www.youtube.com/watch?v=obS6TUVSZds&t=1690s) 单块地砖每年的电费收益不足10美元,整个生命周期回报难以收回微型逆变器、钢化玻璃及PCB等硬件制造成本。
- [30:45](https://www.youtube.com/watch?v=obS6TUVSZds&t=1845s) 项目方指望仅靠随地砖并联的微型逆变器解决复杂的大规模电网并网与输电挑战,纯属缺乏可行方案的工程幻想。
## Detailed walkthrough
### [00:00](https://www.youtube.com/watch?v=obS6TUVSZds&t=0s) 轰动众筹的太阳能公路与初见之下的“完美愿景”
Dave 开门见山地指出,近期收到了极多关于 Indiegogo 上爆火的“太阳能公路”(Solar Roadways)众筹项目的询问。在视频录制时,该众筹仅剩不到 48 小时,但已经筹集了超过 210 万美元,远超其原本就显得荒唐的 100 万美元目标。发起者描绘了一个极其宏大的梦想——用太阳能路面板铺满全美国的每一条道路。初看起来,这个设想极具诱惑力:现代路面终日曝晒在阳光下,吸收了无数热量却毫无作为,夏天赤脚踩上去甚至会烫伤双脚;与此同时,现有的柏油路面破损不堪、急需维护修缮。项目方宣称,与其花费巨额资金用沥青修补道路,不如直接换成太阳能电池板,甚至还抛出了一整套环保主张乃至军事层面的宏伟构想。
项目方列举的功能几乎让这些面板显得无所不能:它们能够自行加热融化冰雪以消除冬季隐患;内置的 LED 能够显示车道线并在行进中动态重构道路标线。Dave 坦言,这套说辞极具感染力,精准戳中了大众的环保情怀,这也是其能够狂揽 200 多万美元的核心原因。作为一名众所周知的环保主义者和可再生能源(尤其是太阳能)的坚定支持者,Dave 最初听闻时也抱着开放态度。然而,仅仅经过一分钟的审慎批判性思考,他就意识到这完全经不起推敲:该方案不仅面临无数根本性的实际工程障碍,成本更是无底洞,整件事情散发出一股浓烈的不靠谱气息。
> “There's too many There's got to be too many practical issues, let alone cost issues, involved in this thing.” —— Dave Jones
### [02:48](https://www.youtube.com/watch?v=obS6TUVSZds&t=168s) 资深工程背景下的基本盲区与缺失的实测数据
太阳能公路项目的发起人拥有电气工程硕士学位,甚至曾担任过公司的研发(R&D)主管,按常理应具备评估项目可行性的专业技术能力。然而,该团队研发多年并斩获了美国政府近 85 万美元的资助,却仿佛从未思考过最底层的基本规律。尽管 Dave 对他们制造出的实体原型机在物理外观和工程制造上予以肯定,感叹其做工精细,但除了这些抓人眼球的外壳,整个项目在关键数据上几乎是一片空白。
项目方大肆宣称这是一项“已经得到验证的成熟技术”(proven technology),声称只要拿到众筹资金就能聘请工程师迅速投产。但实际上,至关重要的现实测试数据全部付之阙如。在路面承载方面,他们唯一的演示只是将一辆拖拉机开到玻璃路面上。Dave 直言,夹层钢化玻璃能够承重普通物体早就是烂大街的技术,但这根本不能证明道路可行性。现场根本没有车辆制动滑移测试视频,没有抗磨损寿命测试,没有实际太阳能输出数据,白天环境下的 LED 实际可视效果更是从未展示过。面对质疑,项目方轻描淡写地表示“原型机只是概念,未来量产换更高效的 LED 就行”,这种避重就轻的表态对于具有电气工程硕士背景的人来说极其不负责任,完全无视了由此引发的严峻热设计与散热噩梦。
```mermaid
flowchart TD
accTitle: 太阳能公路技术宣称与工程现实缺失对比
accDescr: 对比 Solar Roadways 宣传的完美功能与实际项目中缺失的核心现实测试数据
subgraph Claims ["项目方宣称 (Claims)"]
C1["完全成熟的技术<br/>(Proven Technology)"]
C2["融雪防结冰 / 动态LED车道"]
C3["拖拉机压顶展示承重可靠"]
end
subgraph Reality ["缺失的关键工程验证 (Missing Real Data)"]
R1["真实车辆刹车制动测试"]
R2["路面玻璃耐磨度与光捕获衰减"]
R3["强日光下LED可视性与严苛热设计"]
R4["真实并网净输出功率数据"]
end
Claims -.->|"缺乏实质数据支撑"| Reality
```
- 项目方早在大约 5 年前便获得了美国政府约 850,000 美元的研发资助资金。
- 视频中用来炫耀承重能力的是一辆 John Deere 3038E 拖拉机,Dave 强调其净重甚至不足 1,000 公斤(1 吨),比绝大多数普通家用轿车还要轻。
> “Unfortunately, that's where it stops. There doesn't seem to be any other real-world data on anything they claim.” —— Dave Jones
### [05:58](https://www.youtube.com/watch?v=obS6TUVSZds&t=358s) 太阳能公路的五大核心硬伤与“深陷兔穴”的幻象
为了系统拆解太阳能公路的破绽,Dave 梳理了该项目面临的五大核心致命伤。第一是路面物理负载与安全性,缺乏汽车刹车距离测试与表面磨损数据;第二是太阳能输出效率,缺乏严谨的实际发电与并网数据支撑;第三是日光下的 LED 可视性,微弱的侧向视角光线根本无法满足驾驶员看清标线的需求,而加大亮度又会带来恐怖的功耗、光污染与寿命缩短问题;第四是在道路这种极度恶劣的环境下,由玻璃、复杂电路、微型逆变器、庞大线缆网络及无线 Mesh 自组网构成的整套系统的极低可靠性;第五则是天文数字般的制造成本与几乎为负的投资回报率(ROI)。
在归结项目性质时,Dave 澄清这并非传统意义上的蓄意诈骗(Scam)。项目团队对可再生能源抱有极大的热情,并发自内心地相信这个概念能够成真。然而,工程学不会因热情而改变客观法则。当面对极其复杂的物理极限时,仅凭信仰是无法让方案落地的;仅仅几分钟的专业技术推演便能证明它在现实中是彻底的荒谬之作。Dave 评价道,发起人并非骗子,而是“陷入兔穴太深”、以至于“只见树木不见森林”的偏执妄想者(delusional)。最后,Dave 推荐了科普博主 Thunderf00t 针对该项目制作的系列拆解视频,并明确本期视频接下来将聚焦于核心计算——太阳能面板的实际能量产出真相。
- **问题一(物理特性)**:缺乏动态荷载、路面磨耗以及车辆制动距离的实证。
- **问题二(发电性能)**:缺乏真实的系统发电效率与多余电能并网数据。
- **问题三(显示性能)**:平视浅角度下的日光 LED 可见度不足、光污染严重且耗电惊人。
- **问题四(系统可靠性)**:恶劣户外重载环境对精密元器件、微逆变器及无线网络节点的长期侵蚀。
- **问题五(经济可行性)**:硬件制造与维护成本极高,投资回报周期毫无现实可行性。
> “At the end of the day, believing in something is not enough to make it work.” —— Dave Jones
### [09:49](https://www.youtube.com/watch?v=obS6TUVSZds&t=589s) 理想太阳能电池板在现实损耗下的实际发电量
Dave 提出了一个核心问题:在计入所有现实损耗之后,这种太阳能道路究竟能否产生足够的剩余电量?为了验证其可行性,Dave 直接参考了 Solar Roadways 官网推荐的当时最先进的 SunPower E18 230W 太阳能电池板。由于该面板尺寸略大于 1 平方米,折算后在标准测试条件(STC,即垂直照射、1000 W/m² 光照且带日光追踪的最佳理论值)下,其实际峰值输出为 185 W/m²。但这只是最理想的理论天花板,在实际道路基础设施中,系统损耗极其巨大。
首先,太阳能道路地砖不可能实现 100% 的光伏面积覆盖。为了把地砖固定在混凝土基础上,必须预留螺栓孔,还要为 LED 挖出开孔,再加上面板的边缘效应等结构需求,Dave 保守估计光伏覆盖面积会直接损失 20%,导致输出功率从 185 W/m² 下降到 150 W/m²。但这仅仅是个开始,后续还有一连串无法避免的系统级损耗:
```mermaid
flowchart LR
accTitle: 太阳能道路面板峰值功率损耗推导
accDescr: 展示从标准测试条件下的面板峰值功率到计入物理开孔、微逆变器与线缆、玻璃厚度及平铺角度损耗后的最终功率折减过程。
A["标准峰值输出<br>185 W/m²"] -->|"表面有效面积损失 -20%<br>(螺栓孔、LED槽等)"| B["有效面积功率<br>150 W/m²"]
B -->|"微逆变器与线缆损耗 -10%<br>厚玻璃透光损失 -10%<br>0°平铺无倾角损失 -20%"| C["综合系统折减 -40%"]
C --> D["最终实际峰值功率<br>90 W/m²"]
```
Dave 针对这 150 W/m² 进一步扣除了 40% 的叠加损耗:
- **微逆变器与长距离线缆损耗(10%)**:多块地砖共用微逆变器(如 4 块一组),电网并入混凝土线缆槽内的 110V 交流母线。长距离输电需要消耗大量昂贵的铜线,若为控制成本,铜线电阻损耗与微逆变器自身约 5% 的损耗加在一起,10% 是非常合理的估计。
- **保护性厚玻璃透光损失(10%)**:道路面板上方覆盖了厚达 12 至 15 毫米的承重玻璃。即便不考虑表面泥土、污垢、划痕,采用完美的理想玻璃,至少也会产生 10% 的透光损失。
- **水平平铺的角度损失(20%)**:普通家用屋顶光伏通常会保持约 20° 的最佳倾角以对准太阳,而道路只能以 0° 完全水平铺设在地面上,无法垂直朝向太阳,更无法进行动态追踪。
这三项损耗累计达到 40%,使得原本的 150 W/m² 直接缩水为仅剩 90 W/m² 的峰值功率。
---
### [14:18](https://www.youtube.com/watch?v=obS6TUVSZds&t=858s) 日均日照积分与全年季节折减计算
拥有 90 W/m² 的峰值数据后,必须计算出一天内实际能发多少电。太阳不可能 24 小时满功率照射,全天的发电量取决于钟形曲线下的积分面积。Dave 调取了自己在悉尼安装的 3 kW 家用太阳能系统的实测数据(选取了接近夏季、光照充足的 11 月典型理想日数据)。无论具体使用什么面板,日照曲线的几何形状是共通的。通过将峰值转换为每日每平方米瓦时数(Wh/m²/day),Dave 采用了一个最佳情况下的转换乘数 7,得出单日发电量为 630 Wh/m²/day。
然而,这依然不是最终数字,因为一年四季的气候是波动的。阴天、多云天气以及冬季光照时长的缩短都会拉低全年平均值。参考悉尼一整年的实测天气数据(该气候环境与美国的加州相当,极具代表性),Dave 引入了一个 0.6 的全年季节与云层平均折减系数($630 \times 0.6$)。最终得出的道路系统全天候平均日发电量上限仅为 380 Wh/m²/day。正如 Dave 所强调的:“That is the absolute best possible, I think, you can expect from these solar freaking roadway tiles and system.” 这已经是在完全没有汽车遮挡、没有树荫、路面毫无尘土轮胎印的最乐观前提下得到的最高数值。
- **标准电池板峰值**:185 W/m²
- **表面结构扣减后**:150 W/m²(扣除 20% 开孔与边距面积)
- **电气、玻璃与角度损耗**:扣除 40%,降至 90 W/m² 峰值
- **单日最佳日照积分**:$90 \times 7 = 630\text{ Wh/m²/day}$
- **全年气候与季节折减**:$630 \times 0.6 = 380\text{ Wh/m²/day}$(绝对理论上限)
---
### [17:18](https://www.youtube.com/watch?v=obS6TUVSZds&t=1038s) 1公里双车道道路发电量与LED标线耗电量对冲
有了 380 Wh/m²/day 这个基准数据,Dave 开始计算一条典型标准道路的实际能量收支。以一条长 1 公里、宽 8 米的典型双车道公路为例,其道路总表面积为 8,000 平方米:
$$\text{单日总发电量} = 380\text{ Wh/m²/day} \times 8,000\text{ m}^2 = 3,040,000\text{ Wh} \approx 3,000\text{ kWh/day}$$
接下来是核心争议点:Solar Roadways 计划用路面嵌入的彩色 LED 来替代传统刷漆的车道标线,这些 LED 自身会消耗多少电量?
Dave 详细拆解了标线需求:一条双车道公路必须包含两条外侧边线以及中间的一条车道分界线。为了保证安全标示效果,通常采用双黄虚线或双白线等设计,因此总共相当于 3 组双列标线,即 6 条 LED 纵向灯带。从驾驶员坐在车内的低视角来看,标线必须具备一定的宽度和密度才能形成清晰连贯的视觉线条,同时还要冗余备份以防个别灯珠损坏失效。因此,Dave 假设每条标线由双排并列的 LED 组成,纵向间距为 10 厘米(即每米分布 10 颗 LED)。
```mermaid
flowchart TD
accTitle: 1公里双车道路面发电与LED基础耗电对比
accDescr: 显示道路全天理论总发电量与60000颗车道LED标线在假定0.5瓦功率下的能量消耗规模。
subgraph Generation ["发电端(1公里 x 8米双车道)"]
Area["总表面积:8,000 m²"]
UnitGen["单元日均发电:380 Wh/m²"]
TotalGen["单日总发电量:约 3,000 kWh"]
Area --> TotalGen
UnitGen --> TotalGen
end
subgraph Consumption ["LED 标线能耗端(6条灯带)"]
Spacing["间距:10 cm 间距(10,000 颗/条/km)"]
Count["点亮 LED 总数:60,000 颗"]
Power["单颗白昼可视功率:至少 0.5 W"]
Spacing --> Count
Power --> LEDPower["LED瞬时功率:30 kW"]
end
```
在这套布局下:
- 6 条灯带意味着每公里公路包含 $6 \times 10,000 = 60,000$ 颗处于常亮状态的 LED。
- 白天要顶着强烈日光让司机看清发光标线,LED 必须具备极高的亮度。普通高亮 LED 的发光视角通常为 120°,而汽车司机的视线与路面夹角极其平缓狭窄(远超出最佳法向视角),光线衰减极其严重。
- 因此,单颗 LED 的驱动功率至少需要 0.5 瓦甚至更高。
单是 6 万颗 0.5 瓦的 LED 处于工作状态,整条道路就需要至少 30 kW 的连续功率支持,这还不算夜间或雨雪天气加热等其他巨大负载。Dave 即将用具体芯片手册数据揭露 LED 能耗是如何直接“吞噬”掉路面产生的可怜电量。
### [20:12](https://www.youtube.com/watch?v=obS6TUVSZds&t=1212s) LED视角损耗与道路标线功耗计算
Dave 调出了 Philips Lumileds Rebel LED 的数据手册进行深入分析。以黄色(Amber)LED 为例,该器件视角很广,但从角度位移曲线可以看出,当观察角度大于 100°(即从正上方偏转很浅的角度)时,相对发光强度会急剧下降。当司机坐在车内透过车窗望向路面时,视线与路面 LED 的夹角非常小,这与正对 LED 交通信号灯或 LED 标牌完全不同。在如此平缓的低观察角下,LED 的相对光强从正上方的 1.0 峰值直接暴跌了一个数量级,几乎衰减至不可见的程度,Dave 愤怒地指出:“It almost disappears into nothing. It's ridiculous. It's unworkable.”
```mermaid
flowchart TD
accTitle: LED视角光强与功耗关系
accDescr: 展示从不同角度观察LED时的光强损失以及全路段的LED能耗估算过程
subgraph AngleLoss["视角衰减"]
A["正对LED视线 (90°垂直)"] -->|"光强峰值 1.0"| B["理论最佳亮度"]
C["车内极浅视角 (>100°偏角)"] -->|"光强暴跌一个数量级"| D["几乎不可见"]
end
subgraph PowerMath["1公里路面标线能耗"]
E["琥珀色LED: 350mA / 1W<br/>白色LED: 700mA / 2W"] --> F["昼夜平均功耗: 约0.5W/颗"]
F --> G["标线合计: 60,000颗 LED"]
G --> H["连续功率: 30 kW"]
H --> I["每日能耗: 720 kWh"]
end
```
接下来 Dave 仔细剖析了功耗问题。数据手册显示,琥珀色 LED 在 350 mA 驱动电流下达到 1.0 的相对光通量,单颗功耗即达 1 W;而同系列的白色 Luxeon Rebel LED 驱动电流更是高达 700 mA,单颗额定功耗达到 2 W。即便考虑到白天全亮、夜间调暗的昼夜周期,取平均每颗 0.5 W 这一极其宽容的折中值,1 公里道路的基本车道标线所需的 60,000 颗 LED 就会产生 30 kW 的连续功耗。如果 24 小时不间断运行,每天仅维持最基础的标线就必须吞掉 720 kWh 的电能。
- 琥珀色 Philips Lumileds Rebel LED 达到额定亮度需要 350 mA(约 1 W)。
- 类似规格的白色 Luxeon Rebel LED 额定驱动电流为 700 mA(约 2 W)。
- 假设昼夜调光平均单颗功耗为 0.5 W,60,000 颗 LED 标线总功率为 30 kW。
- 1 公里道路每天基础标线用电量:$30\text{ kW} \times 24\text{ h} = 720\text{ kWh}$。
- 该估算尚未包含其他安全警示标识、路面动态箭头或额外指示灯的能耗。
### [22:06](https://www.youtube.com/watch?v=obS6TUVSZds&t=1326s) 阴天赤字与“电网储存”神话的破灭
在最理想的发电状况下,1 公里双向道路每天能产生大约 3,000 kWh 电能,这意味着仅仅维持基本的路面指示标线,就要耗尽理想总发电量的近四分之一(24% 至 25%)。更要命的是,路面划线是安全基础设施,无论天气如何都必须 24 小时保持点亮,功耗是恒定不变的。遇到持续阴雨天,路面光伏发电量大幅缩水,加上路面日常泥沙、油污的遮蔽(发电量随随便便就会跌掉一半甚至四分之三),道路产生的电能将远远无法覆盖 LED 的消耗,陷入严重的能源赤字。更不用说项目方还声称要加入电加热功能来融雪化冰,在每天每平方米仅产生 380 Wh 电能的前提下,这种构想简直是天方夜谭。
```mermaid
flowchart LR
accTitle: 理想发电与实际功耗矛盾
accDescr: 对比1公里道路的理论发电量与恶劣天气下的能耗赤字
subgraph Generation["发电端 (1公里/天)"]
GEN_IDEAL["理想日发电: 3,000 kWh"]
GEN_BAD["阴天/污垢遮挡: 降至 750~1500 kWh 以下"]
end
subgraph Consumption["消耗端 (1公里/天)"]
CON_LED["基础LED标线: 720 kWh (恒定)"]
CON_HEAT["融雪加热系统: 巨额能耗"]
end
GEN_IDEAL -->|"吞掉约 25%"| CON_LED
GEN_BAD -.->|"入不敷出 陷入能源赤字"| CON_LED
```
针对项目方宣称“白天发电输入虚拟电网,夜间再从电网取回给 LED 供电”的说法,Dave 感到极其荒谬。Dave 痛批项目创始人明明拥有电气工程硕士学位,却在传播违反常识的伪科学:“This guy has a master's degree in electrical engineering. This is basic stuff. The grid doesn't store energy like that. It's use it or lose it pretty much.”电网并不是个能随意存取的巨型蓄电池,必须维持即时的供需平衡;在偏远荒凉、没有居民负荷的长途公路上铺设这套系统,输电损耗极其巨大,基础设施投资完全是浪费。
- 理想状态下,仅基础 LED 标线就吃掉总发电量的 24% 到 25%。
- 泥垢、磨损与阴雨天气会轻易让发电量跌落 50% 到 75% 甚至一个数量级。
- 严酷天气下,地砖自身发出的电完全无法自给 LED 标线,遑论融雪电热丝。
- 电网遵循即发即用(use it or lose it)原则,所谓的“虚拟电网蓄电”完全违背电力系统基本原理。
### [25:00](https://www.youtube.com/watch?v=obS6TUVSZds&t=1500s) 常规光伏与地砖方案的效率鸿沟
常规光伏产业在最优条件下生存已属不易:专业光伏电站为了实现经济可行性,必须将面板倾斜对准最佳采光角、避开一切阴影遮挡、采用极薄且透光率极高的超白钢化玻璃,并尽可能靠近负荷端或配置完备的高压升压基础设施。即便是这样精打细算、充分优化的系统,其制造成本与全生命周期投资回报率(ROI)也只是勉强达到商业合理的及格线。
而“太阳能路面”(Solar Roadways)却将光伏组件放置在最恶劣的环境中:水平平铺丧失入射角优势、表面覆盖厚重且光学损耗极大的防滑粗糙玻璃、车轮反复碾压附着油污杂物、电网接入系统薄弱。更为荒唐的是,它还要在自身发电效率低下的同时,背负 24 小时不间断的能耗负载。Dave 毫不客气地怒斥这种设计是完全脱离现实的纯理论垃圾。
| 对比维度 | 传统优化光伏电站 / 屋顶光伏 | 太阳能路面 (Solar Roadways) |
|:--- |:--- |:--- |
| **安装角度** | 针对当地纬度最佳倾角,追踪最大光照 | 绝对平铺(0° 仰角),冬季和斜射光损失巨大 |
| **透光封装** | 超薄、高透光率的专用光伏玻璃 | 极厚、透光差且带粗糙防滑纹理的重型玻璃 |
| **运行环境** | 架空通风、定期清洗、无重载碾压 | 承受汽车重压、积聚油污泥垢、频繁阴影遮挡 |
| **电网配套** | 临近负载中心或高规格升压变电站 | 偏远公路、输电线长、电网接入困难且损耗大 |
| **净能耗** | 无自持性连续大负载 | LED 与控制电路 24 小时持续耗电 |
### [26:29](https://www.youtube.com/watch?v=obS6TUVSZds&t=1589s) 经济回报率计算与商业死局
Dave 接着戳破了项目方“依靠外送多余电力获得收益来回收成本”的谎言。他做了一次极其慷慨的极简测算:即便完全忽略 LED 和电路的所有能耗,将所有发出的电都视为多余并送入电网。基于此前计算的理想日发电量 380 $\text{Wh/m}^2$,结合美国约每度电 12 美分的零售电价,Dave 甚至翻倍采用慷慨的 24 美分/kWh 作为上网电价补贴(feed-in tariff)基准。
在这一极端优厚的假设下,每平方米路面每天仅能创造约 9 美分的电费收入:$0.38\text{ kWh} \times \$0.24/\text{kWh} \approx \$0.091$。乘以一年 365 天,每平方米地砖每年的最高理论收益仅为 33 美元。如果按 1 平方米大约拼接 4 块六边形地砖换算,单块地砖每年的电费收益还不到 10 美元。
```mermaid
flowchart LR
accTitle: 太阳能路砖全生命周期经济模型
accDescr: 计算单块光伏地砖每年的微薄收入与其高昂硬件成本之间的巨大鸿沟
A["每日产电: 0.38 kWh/m²"] --> B["上网电价: $0.24 / kWh"]
B --> C["单日收益: ~$0.09 / m²"]
C --> D["单年收益: ~$33 / m²"]
D --> E["单块地砖收益 (4块/m²): <$10 / 年"]
E --> F["5年总收益: <$50<br/>10年总收益: ~$100"]
G["硬件制造成本<br/>(微型逆变器/钢化玻璃/PCB/LED)"] -->|"远高于"| F
```
即使按照极其乐观的 5 年或 10 年寿命计算,单块地砖在其整个生命周期内的发电总收益也仅仅在 50 到 100 美元之间。而地砖本身的 BOM 成本(包括微型逆变器、重型透光玻璃、PCB、控制器及发光元器件等)和铺设施工成本便远超此数,更不用提 LED 的光衰以及其他电子元器件仅数万小时的平均故障间隔时间(MTBF)。Dave 斩钉截铁地总结道:“You'd be losing money on this thing. And like even under ideal conditions, you're probably losing money on the whole deal. The whole concept is entirely pointless.”
- 假设采用极高的上网电价补贴:0.24 美元/kWh。
- 每平方米每天理论发电收入:$0.38\text{ kWh} \times \$0.24 \approx \$0.09$。
- 每平方米每年理论最高收益:$\$0.09 \times 365 = \$32.85$(约 33 美元)。
- 单块地砖(每平方米约 4 块)每年收益不到 10 美元。
- 即使地砖能够维持 5 到 10 年寿命,生命周期总回报也只有 50 至 100 美元,连内置微型逆变器的成本都难以收回。
### [30:45](https://www.youtube.com/watch?v=obS6TUVSZds&t=1845s) 电网现实与微型逆变器的工程幻想
Dave 严厉驳斥了将太阳能道路直接并入国家电网的盲目乐观假设。实际的发电量绝不可能达到理想预期,现实中的产出很可能会被腰斩甚至更低,这种设想在工程上根本行不通。他极其讽刺地指出,公共电网有极其严格的物理与技术约束,绝非什么随意接纳电力的童话仙境:“The grid isn't some magical utopia land in Willy Wonka's chocolate factory. It just doesn't work like this.” 他强调,向电网反向输送电能涉及极其复杂的实际工程考量。这个荒谬的 Solar Roadways 方案,不仅逃不开目前整个太阳能产业在家庭及基础设施分布式并网时普遍面临的效率瓶颈与技术难题,反而在道路这种极其恶劣的场景下将其无限放大。
更令人难以置信的是项目方对于工程复杂度的轻率态度。发起者似乎天真地认为,只需要在每几块铺路面板下随手塞进几个微型逆变器(micro-inverters),就能万事大吉、轻松搞定。Dave 怒斥这种把整个核心电网基础设施当成琐碎“事后补充”的狂妄思路简直荒唐透顶。整套物理基础设施如何铺设、如何长期维护、如何处理海量微型逆变器的损耗与并网稳定性,他们根本拿不出任何可行的方案:“They've got no solution for this. None. Zip. Nada.”
- **电网接入现实**:将光伏电力安全、高效地反向馈入现有电网需要克服诸多物理与工程限制,现实输出效率通常远低于理论峰值的一半甚至更低。
- **微型逆变器幻想**:项目方声称仅靠为每两块面板安装微型逆变器即可解决并网问题,完全无视了庞大道路网络对电力传输基础设施带来的严苛工程挑战。
- **缺乏技术支撑**:针对基础设施如何实际落地并长期稳定运行,该项目完全没有任何切实的工程解决方案。
## Notable quotes
> [05:58](https://www.youtube.com/watch?v=obS6TUVSZds&t=358s) At the end of the day, believing in something is not enough to make it work. — Dave Jones
> [30:45](https://www.youtube.com/watch?v=obS6TUVSZds&t=1845s) The grid isn't some magical utopia land in Willy Wonka's chocolate factory. It just doesn't work like this. — Dave Jones
## Mentioned
Solar Roadways, Dave Jones, EEVblog, Indiegogo, SunPower E18, John Deere 3038E, Philips Lumileds Luxeon Rebel, Thunderf00t
## Video description
Dave debunks the Solar Roadways project that generated over $2.1M on Indiegogo, as well as almost another million dollars in US government funding.
PART 2 HERE: https://www.youtube.com/watch?v=HOZBrHqTJk4
In this video Dave does the solar generation calculations to see if this system is viable from an energy generation viewpoint, and also how much power the LED's might typically consume.
What are the losses in a typical practical system like this?
Are Solar Freakin Roadways feasible?, or just pie-in-the-sky rubbish?
This debunking covers only a couple of the likely dozens of major technical issues with this concept.
The main take-away form this video is that these solar roadways panels will never EVER be economically viable, and the solar payback is simply comical. EVen if they can meet ann the ridiculously high demands on a physical roadway.
Also, no amount of research will EVER make this a viable idea. You can't just take existing solar technology (which is borderline viable at best of times) and put it in the most hostile physical environment possible, least efficient environment possible, and most costly environment possible and expect it to be viable. It won't be viable, ever.
Datasheets & Links:
http://www.solarroadways.com
Sunpower E18 Solar Panels: http://hvce.com/admin/content/uploads/Sunpower230.pdf
Dave's solar system data:
http://pvoutput.org/intraday.jsp?id=22501&sid=20402&dt=20131104
John Deere 3038E tractor: http://www.tractordata.com/farm-tractors/005/9/1/5912-john-deere-3038e-dimensions.html
Philips Luxeon Rebel LED: http://www.philipslumileds.com/uploads/265/DS68-pdf
http://www.philipslumileds.com/uploads/17/DS61-pdf
Thunderf00t's videos:
https://www.youtube.com/watch?v=H901KdXgHs4
https://www.youtube.com/watch?v=K3ftXinT4jI
https://www.youtube.com/watch?v=ocV-RnVQdcs
https://www.youtube.com/watch?v=KI8c2f8r0UU
Forum: http://www.eevblog.com/forum/blog/eevblog-632-solar-roadways-are-bullshit!/
EEVblog Main Web Site:
http://www.eevblog.com
EEVblog Amazon Store:
http://astore.amazon.com/eevblogstore-20
Donations:
http://www.eevblog.com/donations/
Projects:
http://www.eevblog.com/projects/
Electronics Info Wiki:
http://www.eevblog.com/wiki/
[Source](https://www.youtube.com/watch?v=obS6TUVSZds)
Source quotes
[5:58] Dave Jones: At the end of the day, believing in something is not enough to make it work.
[30:45] Dave Jones: The grid isn't some magical utopia land in Willy Wonka's chocolate factory. It just doesn't work like this.
Original transcript
[0:00] Hi. Now, I've had a lot of requests to
[0:02] do this video. What is my opinion on
[0:05] this Solar Roadways project that's on
[0:07] Indiegogo at the moment? As I record
[0:10] this, it's got uh just under 48 hours
[0:12] left, and they've raised 2.1 million
[0:16] dollars, uh well over their 1 million
[0:18] dollar target, which was ridiculous to
[0:20] begin with, but anyway, 2.1 million
[0:22] dollars to
[0:24] develop these solar roadways,
[0:27] solar-powered roadways. They've got this
[0:29] grandiose dream of paving every road in
[0:33] the US with solar panels. Now, on first
[0:36] glance, these solar roadways sound
[0:38] pretty compelling. After all, we've got
[0:40] all these roadways out there, and
[0:43] collecting all of this solar energy, and
[0:45] just well, heating up, doing nothing,
[0:46] just burning your feet in the middle of
[0:48] summer if you walk across it, right? And
[0:50] the roadways are crumbling. Hey, why
[0:52] not, instead of replacing them with
[0:54] bitumen or whatever, why not replace
[0:56] them with solar panels? That's one of
[0:57] their big claims here is that well,
[0:59] they're crumbling anyway, we need to fix
[1:01] them. Instead of spending the dollars,
[1:04] solar panels is the way to go. You
[1:06] beauty. And well, it's all fantastic,
[1:09] and they've got a whole bunch of
[1:10] environmental claims as well for this
[1:12] thing. Uh in fact, they've got some
[1:14] ridiculous military claims as well. It's
[1:16] almost like these solar roadways can do
[1:19] anything. They can heat up and melt snow
[1:22] and ice, so we get rid of that problem.
[1:24] They've got uh LED lane markers that
[1:26] light up, so you can reconfigure them
[1:28] dynamically on the fly, and they've got
[1:30] this whole list. Go to the website. It's
[1:33] It's almost comical um in that aspect,
[1:36] but hey,
[1:37] let's on the surface, right? This sounds
[1:39] pretty good, and this is why they've
[1:40] raised 2 million dollars. A lot of It's
[1:42] pulling the environmental eco strings.
[1:45] It's pulling all sorts of strings in
[1:47] people, this thing, and they've managed
[1:48] to raise this amount of money. And hey,
[1:51] well, I'm actually, you know,
[1:54] all for this on,
[1:56] you know, on the surface, Because, hey,
[1:58] everyone knows, it's well known that I'm
[2:01] a big environmentalist and a huge
[2:03] supporter of renewable energy, in
[2:05] particular solar power. So, hey, you
[2:08] know,
[2:09] I'm all for almost any virtually any
[2:12] solar-powered project. So, on the you
[2:14] know,
[2:15] thought about this for a minute and went
[2:17] okay, but then
[2:19] after like 1 minute of critical
[2:22] thinking, I thought, "Hang on.
[2:24] No, this just doesn't sound right.
[2:27] There's too many There's got to be too
[2:29] many practical issues, let alone cost
[2:32] issues, involved in this thing." And it
[2:34] only took a few minutes for me to start
[2:35] to think,
[2:37] "Hmm, this smells like some quality
[2:40] gold-plated [ __ ] here."
[2:45] Yeah, [ __ ]
[2:48] Now, this is done by a guy that has a
[2:50] master's degree in electrical
[2:52] engineering and has actually worked as a
[2:54] head of R&D in a company or two back in
[2:57] the day. So, you know, he
[2:59] should have the technical skills to be
[3:01] able to evaluate this and see if it's
[3:04] feasible. But, they've already spent
[3:06] many, many years on this. And
[3:09] well, I don't know how they've gotten
[3:10] this far, including government grants.
[3:13] The some of the prototypes they've
[3:16] produced are very, very impressive. They
[3:18] look technically impressive. I think
[3:20] they've done a really good job of
[3:22] developing prototypes here, but they
[3:24] just I don't think they've thought about
[3:27] the basics or they've just plain ignored
[3:30] them and they've gone off willy-nilly
[3:32] designing some fancy electronic LED, you
[3:34] know, a networking solution cuz these
[3:36] things are networked, too. Oh, yes, they
[3:38] are. And
[3:40] designing all that without thinking
[3:42] about just the fundamental idea of will
[3:44] this
[3:45] actually work or not?
[3:48] Now, one of the major concerns about
[3:49] this project is that they've been doing
[3:51] it for quite some time. Almost 5 years
[3:54] ago they got an $850,000 grant from the
[3:56] government to produce what is uh some
[3:59] very impressive uh physical prototypes.
[4:02] I mean, they're fantastic. My hat's off
[4:04] to them. It does look really good. Some
[4:05] It looks like some decent engineering
[4:07] has at least gone into the uh you know,
[4:09] the manufacture of uh these things.
[4:12] Unfortunately, that's where it stops.
[4:14] There doesn't seem to be any other
[4:15] real-world data on anything they claim.
[4:17] Lots of stuff. In fact, they claim it's
[4:19] uh a proven technology. It's proven. Oh,
[4:23] it's like beyond a shadow of doubt. All
[4:24] we got to do is get the money and go
[4:26] into production. Hire engineers and uh
[4:28] we'll tweak a few things. Go straight
[4:30] into production. And well, no. Come on.
[4:34] Where is the uh you know, the tests of
[4:36] like cars being able to stop on this
[4:38] surface and everything like that? I
[4:40] mean, as far as the physical side of
[4:41] things go, the best thing they've come
[4:43] up with is this tractor here. And well,
[4:46] you know, it looks quite impressive.
[4:48] Okay, it can hold a tractor, but hey,
[4:50] whoop-de-do. I mean, you know, glass uh
[4:53] laminated glass that can hold
[4:55] uh people and objects and all sorts of
[4:57] stuff is is common as mud. Not a big
[5:00] deal. But where are the videos that they
[5:02] show them, you know, cars actually
[5:04] stopping on this surface? How Where are
[5:07] the wear videos? Things like that.
[5:08] Nothing. They claim that this is all
[5:10] proven and they've tested it, but where
[5:12] is the data? Where is the evidence? Let
[5:14] alone the solar output uh data, which
[5:17] I'll go into some calculations in a
[5:19] minute on. Uh the LEDs, they have not
[5:21] shown LEDs working during the daytime at
[5:25] all. Probably cuz it doesn't work. You
[5:27] know, they just make the simple
[5:29] throwaway comment that oh yeah, that was
[5:31] just the prototype. And the real one,
[5:33] we'll just throw in some higher
[5:34] efficiency LEDs. When they know very
[5:36] well, anyone with a master's degree in
[5:38] electrical engineering should know very
[5:40] well, it's a lot more complicated than
[5:41] that. Just the thermal issues alone are
[5:44] going to be a nightmare. So, no. Come
[5:47] on. So, after almost 5 years and 850,000
[5:51] or more dollars they've spent on this
[5:52] thing, well, where's the data to show
[5:55] for it? That's why it smells [ __ ]
[5:58] straight away. But, there are basically
[6:00] uh five major issues I have with this
[6:03] thing and I'll only be able to cover one
[6:05] or two in this video. First problem is
[6:07] they haven't proven that glass actually
[6:10] works as a load surface. They've done
[6:11] some very simple static test like this
[6:14] stupid tractor which weighs under a ton,
[6:16] by the way. It looks impressive, but
[6:18] it's not as a John Deere 3038. It weighs
[6:20] less than 1,000 kilos. Geez, my car
[6:23] weighs more than that. Anyway, they
[6:24] haven't shown stopping on these things.
[6:26] They haven't proven that. They haven't
[6:28] proven wear and tear on the glass. They
[6:29] whole I have to do a whole separate
[6:31] video on just that sort of stuff alone.
[6:34] So, that's you know, that's issue number
[6:36] one.
[6:37] Issue number two, which I'll cover in
[6:39] this video because well, that's what I
[6:41] want to touch on first is the power
[6:43] output from this thing. Where is the
[6:44] real data? Where is the real evidence
[6:46] showing that these things can actually
[6:48] produce you know, a usable excess power
[6:51] and export that to the grid. They just
[6:53] use throwaway comments like they just oh
[6:54] yeah, we'll put some micro inverters on
[6:56] it.
[6:57] Nah, come on. There's no Where's the
[6:59] real data? Third issue is the LEDs.
[7:02] They're just not going to be visible in
[7:04] daylight. They're going to require such
[7:06] ridiculous power and they've
[7:08] they've put comments up on their
[7:10] webpage, you know, answering this sort
[7:12] of criticism and their best
[7:15] retort is that oh no, there's LED signs
[7:18] and LED traffic lights out there. Well,
[7:19] yeah, they're designed to be viewed
[7:21] straight on and when you're talking
[7:22] about the shallow angles for cars, all
[7:24] the lights are wasted and the light
[7:25] pollution, not to mention that just the
[7:28] lifetime of the LEDs and all sorts of
[7:30] thing. Nah, that's a whole 'nother
[7:32] video. The fourth major issue is going
[7:34] to be the reliability of such complex
[7:37] electronics in what is a quite a harsh
[7:40] environment. Not only the uh panels
[7:42] themselves, but the electronics, the
[7:44] LEDs, the micro inverters, the cabling,
[7:47] all sorts of stuff, the wireless
[7:48] reliability. They want to wirelessly
[7:50] network these things in some gigantic
[7:53] mesh network, presumably there's no
[7:54] details on them. All sorts of stuff, and
[7:57] well, it's just a whole can of worms
[7:59] right there. On the scale they're
[8:01] talking about, it's just uh the problems
[8:03] are ridiculous.
[8:06] And the fifth major issue is the price.
[8:08] And I've got some data on this, and I'll
[8:10] go into that in a separate video as
[8:12] well, cuz that's quite important. The
[8:13] return on investment, is it worthwhile
[8:16] after getting rid of all the other
[8:18] issues, sorting those out, even if they
[8:20] were viable, the return on investment
[8:23] Come on.
[8:25] Such complex electronics and glass going
[8:27] into this thing. Haven't got a hope in
[8:29] hell, but hopefully I have some real
[8:30] numbers in a follow-up video.
[8:32] So, at the end of the day, is this a
[8:34] scam? Well, no, clearly not. But it's
[8:37] clear that they passionately believe in
[8:40] this concept and believe it's going to
[8:42] work. And well, yeah, okay, there's no
[8:45] problem with that. It's when they're so
[8:46] passionate about renewable energy, it
[8:48] really shows. It's fantastic, but at the
[8:51] end of the day, believing in something
[8:53] is not enough to make it work.
[8:55] Especially something as incredibly
[8:57] complex and technical like this
[8:59] and when you put in just a few moments
[9:02] uh thought, technical thought into it,
[9:04] you realize it's just really
[9:06] impractical. And just it's just total
[9:09] [ __ ] But unfortunately for them,
[9:11] they're so far into it and so far down
[9:14] the rabbit hole, they just can't see the
[9:16] forest for the trees.
[9:18] Yeah, they're not scammers, they're just
[9:20] uh
[9:20] delusional. And yes, there's been quite
[9:23] a bit of debunking of this project going
[9:25] on already. Uh Thunderf00t, a fellow
[9:27] video blogger, has done some excellent
[9:29] videos already, a whole series of them.
[9:31] So, I'll link those in down below, and
[9:32] he uh does some various tests on uh LEDs
[9:35] and uh surface uh hardness and
[9:37] scratching of the glass, and uh all
[9:38] sorts of stuff like that as well as some
[9:40] uh great calculations as well. So, check
[9:42] them out. But anyway, on with the show.
[9:44] This video is going to be long enough
[9:46] and I'll cover solar output. And well,
[9:49] does it produce enough excess energy
[9:52] practically with all the losses to make
[9:53] it worthwhile? Let's find out.
[9:56] All right, because this is a solar
[9:58] freaking roadway, let's start with how
[10:01] much power it can realistically generate
[10:04] taking into account typical system
[10:06] losses in an infrastructure arrangement
[10:08] like this that they propose. So, let's
[10:11] take the solar panel which uh they
[10:13] recommend on their website as being like
[10:15] the world's best, the ideal uh solar
[10:17] panel at the moment, latest technology,
[10:19] the SunPower E18. Uh I've taken the 230
[10:22] W model. Now, that's not exactly 1 m².
[10:25] So, I've corrected for that and we get
[10:27] 185 W per m².
[10:30] area peak and I'll be dealing with per
[10:32] square meter in all of my calculations
[10:34] from here on in. So, that is a peak
[10:36] value. Take a look at the data sheet and
[10:38] you'll see that in the uh top right-hand
[10:41] corner there is the uh power output
[10:43] versus typical uh solar insolation
[10:46] levels. Now, this one uh that maximum
[10:49] data sheet value take is a STC or
[10:52] standard testing condition of 1,000 W
[10:54] per m². And that's basically the
[10:57] theoretical maximum you can expect on
[10:59] the surface of typically on the surface
[11:01] of the earth uh for a perpendicular uh
[11:04] arrange the solar panel perpendicular to
[11:07] the sun and tracking it. So, we're
[11:09] taking the absolute best case here.
[11:12] Okay? Realistically, it's going to be
[11:14] lower than this based on your uh
[11:15] geographical location and uh all sort
[11:18] time of year and all sorts of other
[11:20] stuff. Now, let's take into account the
[11:22] losses here because we this solar tile
[11:25] can't uh you have 100% coverage for the
[11:28] solar cell. So, we have to include a
[11:29] loss. I'm going to include what I think
[11:32] is a fairly realistic figure of 20% loss
[11:34] in surface area due to the bolt holes
[11:37] where they have to bolt the thing down
[11:39] to the concrete plus the lead cut outs
[11:42] and edge effects and all sorts of stuff.
[11:44] You can't have it 100% covered. That's
[11:46] not realistic. So, I think that's a you
[11:49] know, 20% loss in that. That's a
[11:50] realistic figure. It might be a little
[11:52] bit less depending on how they find
[11:54] engineer the final product. But, that's
[11:57] not all. Okay, so we've lowered that 185
[12:00] down to 150 watts per square meter now.
[12:03] Now, I've got some extra losses. What
[12:05] are they? I'm glad you asked. Now, we're
[12:07] going to have to include a 10% loss on
[12:10] this figure for the microinverter plus
[12:12] the cabling etc. Because the
[12:14] microinverters
[12:16] when you join them all together and they
[12:18] might have say in this arrangement they
[12:19] might have four tiles per microinverter
[12:22] or something like that. But, when you
[12:23] run those microinverters onto a
[12:27] 110 or 240 volt bus US it's going to be
[12:31] 110 volt bus in their concrete cable
[12:34] pits join them all together. Imagine a
[12:36] road that doesn't even have typical
[12:39] power pole access and things like that.
[12:41] Well, jeez, I don't know. Your losses
[12:44] are going to be quite large in your
[12:45] copper and copper's very expensive. So,
[12:47] it's always going to be a trade-off
[12:49] between losses in your copper versus
[12:51] cost. So, you're going to want to
[12:52] minimize that and sort of balance that
[12:54] out wherever possible. And a typical
[12:56] microinverter is around about 5% plus
[12:59] cable losses. think I'm being you know,
[13:01] pretty realistic with a 10% figure
[13:03] there.
[13:04] Now, of course, we've got the glass. I
[13:06] don't know how thick it is, but it looks
[13:07] to be about 12 to 15 mm at least on top
[13:11] of these
[13:12] solar panels. So, that is pretty thick
[13:14] glass. Now, we're not going to talk low
[13:16] iron glass or anything like that. We're
[13:18] going to talk perfect glass. No dirt, no
[13:20] grime on it, no nothing. You're probably
[13:23] going to get at least a 10% loss there
[13:25] in that glass. Once again, think I'm
[13:28] being pretty generous. Um, and then
[13:30] we've got a major loss, the loss due to
[13:32] the flat angle of the solar panel. It's
[13:36] flat on the road. You have to assume
[13:37] that the road is flat, and of course it
[13:39] is not uh perpendicular to sun, uh and
[13:42] it's not tracking either. Your typical
[13:44] solar panels on your house roof, uh for
[13:46] example, they might be tilted, angled up
[13:48] maybe 20° to give you a bit more optimum
[13:51] uh level there. Now, a typical figure uh
[13:54] for a flat solar panel is around about a
[13:57] 20% uh at that 0° angle there. So, we'll
[14:00] include that. So, we add all these up,
[14:02] we've got 40%
[14:04] worth of losses right off the bat of our
[14:07] already lost figure due to the surface
[14:09] area. So, 40% of uh loss on 150 W per
[14:13] square meter is 90 W per square meter,
[14:16] and that's a peak number.
[14:18] Now, we have to take into account the
[14:20] fact that the sun doesn't always shine,
[14:22] does it? So, I've drawn a graph of a
[14:24] typical uh solar power ideal uh solar
[14:28] system output over the course of 24
[14:30] hours. Of course, you know, it might
[14:31] come up at 7:00 a.m. and then it peaks
[14:33] around, you know, midday or something
[14:35] like that or early afternoon, and then
[14:36] tapers off. Now, based on my own 3 kW
[14:39] solar system uh installation, I've got
[14:42] some real data on something like that
[14:43] for an ideal uh day. I taken it in
[14:46] November, which is uh almost uh
[14:48] summertime here in Sydney, and I'll link
[14:50] these things in down below where you can
[14:51] get the real numbers, but it doesn't
[14:53] matter what my solar system is or what
[14:56] panels it uses, the output uh shape is
[15:00] all we care about, and that's going to
[15:01] be the same because we're basically
[15:02] getting the area under the curve, and
[15:04] then translating a peak value, in this
[15:07] case, a peak value into a uh
[15:10] watt hours per square meter figure over
[15:12] an entire day. And I calculated a
[15:15] best-case multiplier of times seven to
[15:18] convert that 90 W per square meter peak
[15:21] figure into, in this case, 630 watt
[15:24] hours per square meter per day. And
[15:27] that's not very impressive, but it gets
[15:29] worse.
[15:30] Oh, and by the way, the solar
[15:32] insulation, because these things are
[15:33] flat and not perpendicular tracking, as
[15:36] I said, the that dotted green line there
[15:38] is the ideal solar insulation hitting
[15:41] the Earth's surface, but because these
[15:43] are flat and not tracking, therefore the
[15:46] curve is it's going to be actually a bit
[15:48] worse a fair bit worse than what I've
[15:51] realistically shown here, but anyway, it
[15:53] gets worse because we have to derate the
[15:55] output again by another factor over the
[15:58] course of a year to take into account
[16:00] all of the seasons. And based on my own
[16:03] data, which is going to be very typical
[16:05] for a solar system, so these are real
[16:07] figures. This isn't pie in the sky
[16:08] stuff. Okay, these are real measured
[16:10] figures. I've worked out over the last
[16:13] year, taking into account typical cloud
[16:15] coverage here in Sydney and everything
[16:17] else. So, these are realistic figures.
[16:19] You might expect
[16:20] a similar state might be California, for
[16:22] example. So,
[16:23] we a 0.6 multiplier to take into fact
[16:27] count to average it out over the entire
[16:29] year. So, that's 630 * 0.6, we get a
[16:32] final theoretical maximum, I've
[16:36] underlined it, maximum figure of 380
[16:39] watt hours per square meter a day. That
[16:42] is the absolute best possible, I think,
[16:45] you can expect from these
[16:49] solar freaking roadway tiles and system.
[16:52] It's not going to get any better than
[16:54] that. These are real-world figures using
[16:56] real-world losses. So, this is great.
[16:58] We've now got a realistic real-world
[17:00] figure of 380 watt hours per square
[17:03] meter a day. Now, we can go on and use
[17:05] this
[17:06] benchmark figure to calculate a typical
[17:09] output for an entire road, and then
[17:11] subtracting the losses due to the LEDs
[17:14] and other stuff that we're going to have
[17:15] in there. Let's go. So, we've got that
[17:18] magic realistic ballpark number now for
[17:20] the power generated. Well, how much
[17:22] power is generated for a 1 km stretch of
[17:26] typical road and how much power is used
[17:28] by the LEDs they propose to use for the
[17:31] lane markings? Well, I'm glad you asked
[17:33] that, too. There's our figure, 380 Wh
[17:36] per square meter a day, absolute
[17:38] maximum. Remember that. That's sort of
[17:40] the best case you can expect, not taking
[17:42] into account dirty, grimy roads and cars
[17:45] driving on it and shading and shade
[17:47] trees and all sorts of other stuff,
[17:48] okay? That's a maximum for a 1 km
[17:52] dual lane road. A typical dual lane road
[17:55] is around about 8 m across. Let's take
[17:58] that figure, okay? And we're going to
[18:00] have to have at least three lines on it.
[18:02] You need your outer marker line and you
[18:03] need your center marker line. Let's
[18:05] assume it's a double, you know, a double
[18:07] strip center marker line. And if you
[18:11] zoom in to the LEDs here, then I've uh
[18:15] shown that each strip, I reckon, should
[18:17] be around should be at least four LEDs
[18:20] like that spaced probably 10 cm apart
[18:24] like that. Why do you need two side by
[18:27] side? Well, you need to create a
[18:28] thickish kind of line which we're used
[18:31] to and we have now and the angle when
[18:33] you look down at the shallow angle from
[18:35] the car as well. You need to get a nice
[18:37] solid line on the thing. So, I think you
[18:39] need at least two LEDs wide and you
[18:41] cater for any failures and things like
[18:43] that as well. So, two LEDs wide by 10 cm
[18:46] cm apart, I think that's realistic. It's
[18:49] similar, I think, to what they
[18:50] physically have on their panels at the
[18:52] moment. Might even be a bit larger
[18:54] spacing than that. Not entirely sure. We
[18:56] don't have absolute data on that, but
[18:58] it's a good figure. First of all, we'll
[19:00] take a look at how much power is
[19:01] actually generated. This is this blue
[19:03] one down here. It's a really easy. It's
[19:05] that 380 Wh per square meter figure
[19:07] times 8,000 square meters total area for
[19:10] a 1 km length by 8-m wide road, and
[19:14] that's 3,000 kWh for generated in 1 day.
[19:19] Now, how much power do the LEDs use?
[19:22] Well, let's take a look. We can
[19:23] calculate that. Okay? If we've got six
[19:26] strips of LEDs, two, two, and two, then
[19:29] we're going to have if they're 10 cm
[19:31] apart, we're going to have 10,000 LEDs
[19:33] per strip. Okay? So, we've got a total
[19:35] of 60,000 LEDs per kilometer that are
[19:38] turned on. And assuming that each LED is
[19:42] going to take about half a watt, that's
[19:44] a typical figure you're going to want to
[19:46] need. Remember, this needs to be
[19:47] daylight, and that's not taking into
[19:49] account the view angle of the LED. A
[19:51] typical one might be a 120° view angle,
[19:55] and the car viewing it is going to be a
[19:58] shallower angle than that 120. So,
[20:02] it's pretty awful. You're going to need
[20:03] at least half a watt, even more per LED
[20:06] to get these things bright during the
[20:08] day. Now, let's take a look at
[20:10] LED that you'd use in this sort of
[20:12] application, a Philips Lumileds Rebel
[20:15] LED. We've got an amber one here, but
[20:16] very similar, very wide view angle on
[20:20] this thing. And you'll notice that the
[20:21] curve
[20:23] the angular displacement in degrees,
[20:25] you'll notice how that greater than
[20:27] 100°, i.e., in either direction, those
[20:30] very shallow angles which you'll be
[20:31] viewing it at when you're in a car
[20:33] looking out from your window like this,
[20:36] the the relative intensity from a peak
[20:39] of one right above if you're staring
[20:41] directly down into the LED or directly
[20:43] into it like you do on the LED signages
[20:46] and
[20:47] LED traffic lights and things like that,
[20:48] pretty close to it, that's one. Well,
[20:51] look, it drops down, you lose like an
[20:53] order of magnitude right at those
[20:55] shallow angles. It almost disappears
[20:57] into nothing. It's ridiculous. It's
[21:00] unworkable.
[21:01] Now, if we take a look at the power
[21:02] consumption of this thing, you'll notice
[21:04] that 1.0 on the Y axis here, the
[21:07] relative luminous flux. That's the data
[21:09] sheet figure is at 350 milliamps. So,
[21:12] that's 1 W right there to get its rated
[21:15] brightness output. And this is for the
[21:17] amber LED. Now, the similar series white
[21:20] Luxeon Rebel 1 is double that, 700
[21:24] milliamps. So, 2 W to get its rated
[21:27] luminous output. So, really, you know,
[21:29] when you combine a like a day-night
[21:31] cycle, you dim them at night, then you
[21:33] know, 0.5 W average is probably not a
[21:36] bad figure. Right, half a watt * 60,000,
[21:38] that's 30 kW consumed per kilometer for
[21:43] the LEDs for a typical line marking.
[21:45] That doesn't include other safety signs
[21:47] I want to put in and other, you know,
[21:49] stuff like that, like markers and all
[21:51] sorts of other things, just your basic
[21:53] line markings that we're used to. And
[21:55] now we can take that figure, 30 kW * 24
[21:59] hours, bingo, 720 kW hours per day.
[22:02] That's how much energy we're using just
[22:04] for basic LED line marking. We're
[22:06] generating 3,000 kW hours a day, ideal.
[22:11] So, at around about 24, like a quarter,
[22:14] 25%
[22:16] of your ideal maximum power generated
[22:19] from a kilometer of road is used for
[22:22] your LED line marking. It's ridiculous.
[22:26] And this is best case. Remember, the
[22:29] line markers do not change. They have to
[22:32] be on 24 hours a day. So, that power is
[22:36] consumed continuously regardless of how
[22:38] much power you generate. If it's a
[22:39] completely cloudy day, you're screwed.
[22:42] You're going to be using more energy
[22:44] than in the LEDs than what you're
[22:46] actually generating. And as I said,
[22:47] dirt, grime, everything else on the
[22:51] solar panels could easily take this
[22:53] figure up here and drop it by a half
[22:55] without even sweating it. It could drop
[22:58] by 3/4 or even more, maybe even order of
[23:02] magnitude and under horrible conditions.
[23:05] So, it's almost a complete showstopper
[23:07] right here just in the LED power
[23:10] consumed assuming that they you can even
[23:13] see the LEDs. We need to talk about
[23:14] that. But like on a on a bad this is
[23:17] best case scenario. On a bad day, you're
[23:19] going to be consuming more power than
[23:22] you generate. It's ridiculous. That's
[23:24] just for the LEDs. Let alone the
[23:26] ridiculous utterly ridiculous scenario
[23:30] of that they propose of heating these
[23:32] tiles so that it melts snow. You've got
[23:35] to be kidding me. I mean, we've only got
[23:37] we're only generating 380 watt hours a
[23:39] day. I to heat these things is just
[23:42] ridiculous. It's almost a showstopper
[23:44] right with the LEDs. You're going to
[23:46] need at least an order of magnitude more
[23:50] power generated, but we're not. We're
[23:52] not close to that. On a bad day, it
[23:55] could be, you know, half or worse than
[23:57] what you're consuming. It's just
[24:01] It's not going to work. It's ridiculous.
[24:04] But it gets even worse than this. What
[24:06] happens on a good day when we're
[24:07] actually generating more power than what
[24:10] we're consuming with the LEDs and
[24:11] everything else. What happens to that
[24:12] excess power? Well, of course, it goes
[24:14] back to the grid. But they claim that
[24:16] they can then store it in the virtual
[24:18] grid and then pull that energy back out
[24:21] at night to drive the LEDs and all the
[24:23] other stuff as if it's some sort of
[24:25] magical storage medium the grid. It's
[24:28] not. This is solar power 101.
[24:31] Oh. This guy has a master's degree in
[24:34] electrical engineering. This is basic
[24:36] stuff. The grid doesn't store energy
[24:39] like that. It's use it or lose it pretty
[24:41] much. And if you're got a long stretch
[24:43] of road in the middle of nowhere with no
[24:45] houses going by, it's just pointless
[24:47] having this infrastructure in place cuz
[24:49] you're going to have too many losses
[24:51] from your system then going back to the
[24:53] main grid. It's
[24:55] It's a complete non-starter. It's just
[24:57] not going to work. It's pointless. Now,
[25:00] the solar power industry already has
[25:02] enough issue with well-designed solar
[25:05] systems, i.e. ones that angle the panels
[25:08] correctly or more optimally
[25:10] to get the maximum efficiency out of
[25:12] them, ones that deliberately aren't in
[25:14] the shade, ones that use very efficient
[25:17] glass and thin glass on the front to
[25:20] maximize the efficiency, and they're
[25:23] designed to be near the load source as
[25:25] well, i.e. on top of your house or
[25:27] something like that. Or they put the
[25:28] solar farms in place that it
[25:30] deliberately have very, you know,
[25:33] well-engineered power infrastructure
[25:35] systems to ensure the maximum
[25:37] efficiency. And even then, in these
[25:39] well-designed systems, they, you know,
[25:42] the calculation on the return in
[25:44] investment on the true cost of the
[25:46] energy to, you know, manufacture the
[25:48] panels and everything else, that's a,
[25:50] you know, it's already a tough enough
[25:52] case. It's pretty good, okay, but it's
[25:54] it's not, you know, a standout
[25:57] solution by any means. And now, solar
[25:59] freaking roadways want to come along and
[26:02] completely turn that over on its ass and
[26:06] use it in probably the most inefficient
[26:08] way possible through its really thick,
[26:10] lossy glass with all sorts of crap on
[26:12] it, flat, all sorts of things with
[26:15] limited power infrastructure and all
[26:17] that sort of stuff. And while they're
[26:19] consuming power 24 hours a day
[26:22] regardless of whether or not they even
[26:24] generate them. It's
[26:25] It's just theoretical
[26:28] [ __ ]
[26:29] Now, one of their major claims is that,
[26:32] well, these things generate excess
[26:34] energy. And yeah, they probably will
[26:36] under decent conditions, and that will
[26:38] generate revenue and it'll pay for
[26:40] themselves. Well, let's do some
[26:42] calculations on that. We can I this will
[26:45] be fairly simplistic, but it'll give us
[26:47] a good ballpark measurement. You can go
[26:48] deeper into the life cycle analysis and
[26:50] all sorts of stuff, which we won't worry
[26:52] about. Now, I'm going to be incredibly
[26:55] generous yet again and I'm going to
[26:57] assume that the LEDs take no power at
[27:00] all. So, we're just looking at this
[27:02] figure up here that we've got 380 watt
[27:04] hours per square meter a day. Remember
[27:06] that's a pretty much an ideal practical
[27:09] maximum for, you know, a good location.
[27:12] So, let's have a look at the figures,
[27:14] shall we? Um now, the electricity in the
[27:17] US is about 12 cents per kilowatt hour
[27:19] or something like that. Uh the feed-in
[27:21] tariff, I believe, in the US is around
[27:24] about 24 cents per kilowatt hour. That's
[27:26] may or may not always be there. That's
[27:28] at the whim of the government and all
[27:29] sorts of things, but let's take 24 cents
[27:32] per kilowatt hour, okay, for
[27:35] energy you feed back into the grid.
[27:37] Excess energy, remember, LEDs. So, all
[27:39] of this goes back in. Right, that's 24
[27:42] cents per kilowatt hour. We're not even
[27:45] generating a kilowatt hour per square
[27:47] meter a day, okay? So, we have to
[27:50] multiply that by 0.38. We get around
[27:52] about 9 cents per square meter per day.
[27:56] That is the best case revenue you can
[27:58] expect from these
[28:01] solar freaking roadway tiles. So,
[28:03] 9 cents per tile 365 days in a year $33
[28:09] per square meter per year. That's all
[28:12] you get. That's ideal best case assuming
[28:15] no losses and not the northern regions
[28:17] and the solar insulation and the whole
[28:19] uh the dirt and grime and other factors.
[28:21] It's
[28:22] Right, I'm being incredibly generous.
[28:24] That's like $33 a square meter. And
[28:27] remember, 1 square meter is not just one
[28:29] of these tiles. They'd probably have
[28:31] four of these tiles per square meter.
[28:32] So, you're looking at under $10, well
[28:35] under $10 a year
[28:37] payback for one of these tiles. How much
[28:40] do they cost to manufacture? Just base
[28:42] cost let alone installation cost and
[28:44] everything else. Need to do a whole
[28:45] separate video on all those
[28:47] calculations, but just on this ideal top
[28:50] level, it's just it doesn't work. Now,
[28:53] you might claim that okay, well, you got
[28:55] to take it over the 10 years or
[28:57] something that I I'm not sure of the
[28:58] exact lifetime they claim. I think it
[29:00] might be 10 years per panel or even
[29:02] more. They're shooting for 20 or
[29:03] something ridiculous. Now, a typical LED
[29:06] brightness in luminosity will lose, you
[29:09] know, it will go down like 50 or 60% of
[29:11] its luminosity over 100,000 hours, which
[29:14] is 10 years or something like that. But,
[29:17] the failure rate, the MTBF figure is
[29:20] what you have to take into account, the
[29:21] mean time between failures, not only the
[29:23] LEDs, but the components is much under
[29:26] that. It's in the order of like 10,000
[29:28] order of magnitude less. So, 10,000
[29:30] hours really, you know, that's only a
[29:32] year or two. Realistically, okay, let's
[29:34] be generous again and say you can get
[29:36] five years out of a tile, an average
[29:38] tile, before that fails. Well, what do
[29:41] you get? Less than 10 bucks
[29:43] per tile best case, you're looking at
[29:46] like 50 bucks payback over the life,
[29:49] even if it is you do get 10 years. It's
[29:51] only 100 bucks. That's not even the
[29:53] manufacturing cost of the bloody tile.
[29:56] You can barely buy a bloody
[29:57] microinverter for that. It's
[29:59] No, does not work. So, payback, what do
[30:03] you get? Basically, nothing. You'd be
[30:06] losing money on this thing. And like
[30:09] even under ideal conditions, you're
[30:11] probably losing money on the whole deal.
[30:13] The whole concept is entirely pointless.
[30:16] And they couldn't do basic calculations
[30:18] like this? Yeah, people might argue that
[30:21] oh, I got this wrong or slightly wrong
[30:22] and blah blah blah, but these are
[30:24] ballpark back-of-the-envelope
[30:26] calculations you need to do to see if
[30:29] it's feasible or not. And really, you
[30:31] need to be way up there in your
[30:33] confidence factor and we're not even we
[30:35] got absolutely zero confidence in here.
[30:37] There's no way we can get the this
[30:40] figure up and everything else is just a
[30:42] complete non-starter. This figure down
[30:44] here is
[30:45] just like ideal, pretty much. It's going
[30:48] to be lower than that, half, maybe even
[30:51] more. It's just not
[30:53] going to work.
[30:54] The grid isn't some magical utopia land
[30:57] in Willy Wonka's chocolate factory. It
[30:59] just doesn't work like this. There's so
[31:01] many practical considerations in feeding
[31:04] energy back to the grid. This stupid
[31:06] Solar Roadways thing has exactly the
[31:08] same problem that they solar industry
[31:11] currently has in terms of efficiency
[31:13] supplying back to the grid in terms of
[31:15] your own house and other infrastructure
[31:17] where you put solar systems in place and
[31:20] all that sort of stuff. And they they're
[31:22] proposing, "Oh yeah, we'll just throw in
[31:23] a couple of micro inverters for each,
[31:25] you know, a couple of panels and she'll
[31:27] be right. Bob's your uncle." Well, no.
[31:30] It's not going to work. It's just
[31:32] ridiculous. There's so many practical
[31:34] consequences in this thing of how the
[31:37] whole infrastructure goes into place.
[31:39] You can't just just write it off as some
[31:42] afterthought. It's got They've got no
[31:44] solution for this. None. Zip. Nada.