The History of Europe: Every Year
Cottereau
AI-assisted summary of The History of Europe: Every Year — original source. Check the original for full context.
Source published:
Key ideas
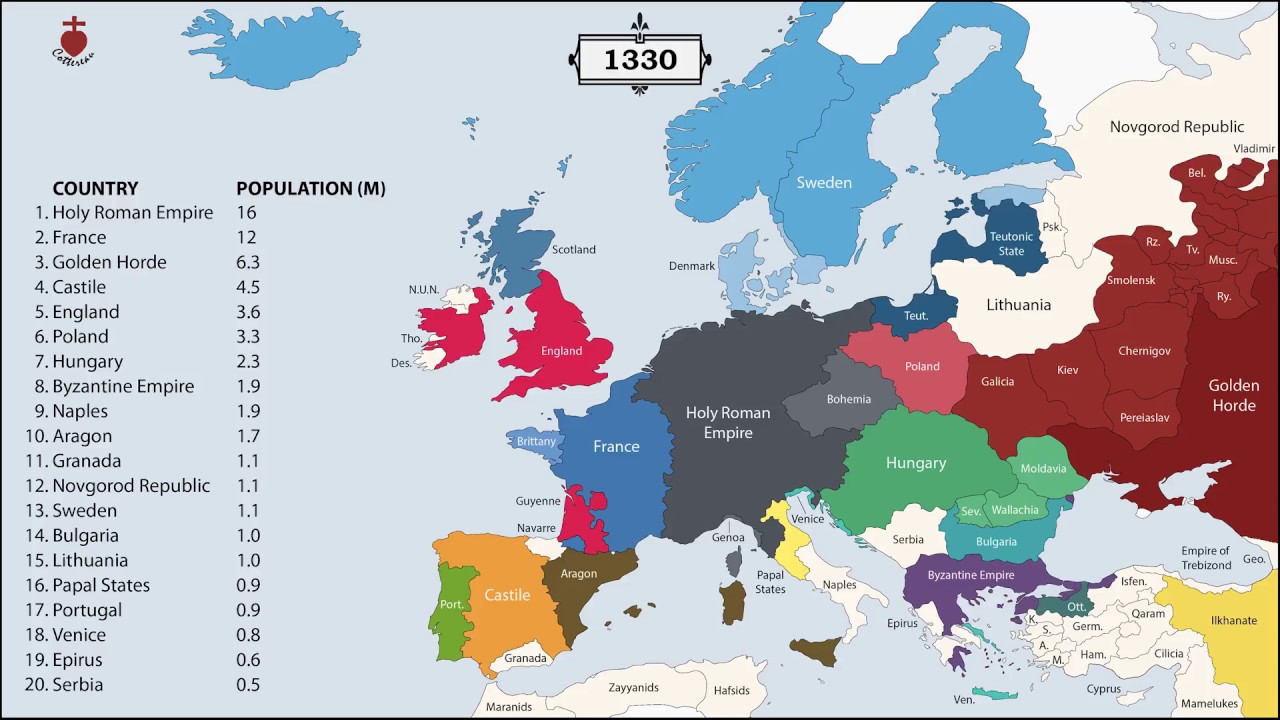
- The video visualizes over 2,400 consecutive years of European borders and national populations on an annual basis from 400 BC to the modern era. (0:00)
- Demographic statistics exclude vassal states and external colonial holdings to measure only domestic populations within sovereign borders. (0:00)
- Population figures are compiled from Angus Maddison's Historical Statistics for the World Economy, McEvedy & Jones's Atlas of World Population History, and Tacitus.nu. (0:00)
- Cartographic border data synthesizes historical mapping work from channels EmperorTigerstar and Ollie Bye. (0:00)
Detailed notes
## Background Published on YouTube by Cottereau on January 1, 2018, "The History of Europe: Every Year" maps the changing borders and population figures of every European nation for each year starting from 400 BC. The project description notes that demographic counts deliberately exclude vassal states and colonial territories, relying on historical datasets from Angus Maddison, Colin McEvedy and Richard Jones, Tacitus.nu, and cartographic research from EmperorTigerstar and Ollie Bye.
## TL;DR The video provides a purely visual, year-by-year cartographic chronicle of Europe's territorial and demographic evolution spanning over 2,400 years. Starting in 400 BC, the animation charts the rise, fragmentation, and consolidation of classical empires, medieval polities, and modern nation-states across the European continent and the Mediterranean basin. As the timeline progresses into the 19th through 21st centuries, it highlights the rapid redrawing of national frontiers alongside dramatic population growth. Without verbal commentary, the presentation synthesizes academic demographic data directly into changing boundary lines and evolving state counts.
## Atmosphere & style Driven entirely by visuals and an orchestral soundtrack featuring the "Gladiator - The Battle Super Theme Song," the presentation carries an epic, sweeping, and intense tone. The steady, relentless progression of annual dates creates a hypnotic rhythm, transforming centuries of war, diplomacy, and societal change into a seamless kinetic flow. Watching the continuous rise and fall of borders against dramatic battle music evokes a macroscopic, almost detached awe at the sheer scale and volatility of European history.
## Bulletin - [00:00](https://www.youtube.com/watch?v=UY9P0QSxlnI&t=0s) The video visualizes over 2,400 consecutive years of European borders and national populations on an annual basis from 400 BC to the modern era. - [00:00](https://www.youtube.com/watch?v=UY9P0QSxlnI&t=0s) Demographic statistics exclude vassal states and external colonial holdings to measure only domestic populations within sovereign borders. - [00:00](https://www.youtube.com/watch?v=UY9P0QSxlnI&t=0s) Population figures are compiled from Angus Maddison's Historical Statistics for the World Economy, McEvedy & Jones's Atlas of World Population History, and Tacitus.nu. - [00:00](https://www.youtube.com/watch?v=UY9P0QSxlnI&t=0s) Cartographic border data synthesizes historical mapping work from channels EmperorTigerstar and Ollie Bye.
## Key takeaways - [00:00](https://www.youtube.com/watch?v=UY9P0QSxlnI&t=0s) The visual timeline establishes an annual territorial and demographic baseline starting in 400 BC. - [00:00](https://www.youtube.com/watch?v=UY9P0QSxlnI&t=0s) Colonies and vassal states are deliberately omitted from country population counts throughout the visualization. - [00:00](https://www.youtube.com/watch?v=UY9P0QSxlnI&t=0s) Historical demographic data relies on academic compilations by Angus Maddison, Colin McEvedy, Richard Jones, and Tacitus.nu. - [00:00](https://www.youtube.com/watch?v=UY9P0QSxlnI&t=0s) Territorial border progressions integrate visual data from EmperorTigerstar and Ollie Bye covering Europe, the Middle East, and Africa. - [05:00](https://www.youtube.com/watch?v=UY9P0QSxlnI&t=300s) The production features no spoken narration, relying entirely on visual data accompanied by orchestral music from Gladiator. - [05:00](https://www.youtube.com/watch?v=UY9P0QSxlnI&t=300s) The animation tracks the expansion, fragmentation, and consolidation of classical, medieval, and early modern European states. - [10:00](https://www.youtube.com/watch?v=UY9P0QSxlnI&t=600s) The sequence illustrates rapid frontier shifts and population growth during the 19th, 20th, and 21st centuries. - [10:00](https://www.youtube.com/watch?v=UY9P0QSxlnI&t=600s) The project concludes by completing more than 2,400 years of continuous annual European geopolitical history.
## Detailed walkthrough ### [00:00](https://www.youtube.com/watch?v=UY9P0QSxlnI&t=0s) Opening Overview and Early Timeline
The opening segment establishes the visual cartographic timeline depicting the yearly evolution of European borders and population figures starting from 400 BC. As a purely visual presentation set to background music without spoken dialogue, the auto-generated transcript registers stray transcription tokens and courtesy tags, including repeated phrases of "Thank you," repeated markers of "The End," and the line “I'm going to go.”
According to the production notes, the visual mapping tracks sovereign territorial frontiers while explicitly excluding vassal states and external colonial possessions from each nation's recorded population metrics. The demographic data utilized for the timeline synthesizes statistical work from Angus Maddison’s *Historical Statistics for the World Economy* (2003), Colin McEvedy and Richard Jones’s *Atlas of World Population History* (1978), and historical population tables from Tacitus.nu, displayed alongside territorial boundaries compiled by historical cartography channels EmperorTigerstar and Ollie Bye.
- Territorial baseline begins in 400 BC, mapping annual changes across the European continent and adjacent Mediterranean regions. - Population numbers exclude dependencies, protectorates, and colonies to measure only domestic populations. - Border shifts reflect data synthesized from EmperorTigerstar’s *The History of Europe: Every Year* and *The History of the Middle East: Every Year*, along with Ollie Bye’s *The History of Africa: Every Year*.
[05:00:00](https://www.youtube.com/watch?v=UY9P0QSxlnI&t=18000s) Intermediate Era and Dramatic Theme
Passing the five-minute mark, the animation progresses through European historical transformations accompanied by orchestral instrumentation credited as the "Gladiator - The Battle Super Theme Song." Because the audio contains no verbal narration, the automatic caption system captures the audio texture as "*Dramatic Music*", intermixed with repeated algorithmic tags reading "Thank you" and "The End."
The visual display advances year by year through centuries of geopolitical change, recording the expansion, fragmentation, and consolidation of classical, medieval, and early modern states across Europe. The graphical layout continues pairing dynamic map transformations with shifting population numbers across major European polities.
- Soundtrack features the dramatic battle arrangement from the *Gladiator* score. - Cartographic coverage continues tracking regional border shifts across Western, Central, and Eastern Europe. - The transcript records soundtrack activity through ambient tags and repeated automated artifacts.
[10:00:00](https://www.youtube.com/watch?v=UY9P0QSxlnI&t=36000s) Modern Period and Closing Sequence
The final portion of the timeline carries the visual progression into modern history, tracking the rapid territorial shifts and population explosions of the 19th, 20th, and 21st centuries. The auto-generated transcript concludes by registering four consecutive iterations of "Thank you."
The closing segment finishes documenting more than two millennia of territorial shifts across the European continent, bringing the comprehensive yearly comparison from 400 BC through contemporary sovereign borders to a close.
- Final sequence completes over 2,400 consecutive years of European demographic and territorial history. - Concludes the visual integration of historical demographic statistics and annual frontier mapping.
## Mentioned Cottereau, Angus Maddison, Historical Statistics for the World Economy, Colin McEvedy, Richard Jones, Atlas of World Population History, Tacitus.nu, EmperorTigerstar, The History of Europe: Every Year, The History of the Middle East: Every Year, Ollie Bye, The History of Africa: Every Year, mrgice3, Gladiator
## Video description Donate: https://buymeacoffee.com/cottereau
This video shows the borders and populations of each country in Europe, for every year since 400 BC. Vassal states and colonies are not included in the count of a country's population.
Sources :
1. Population : - Angus Maddison (2003), Historical Statistic for the World Economy http://www.ggdc.net/maddison/maddison-project/home.htm
- Colin McEvedy & Richard Jones (1978), Atlas of World Population History https://www.amazon.com/Atlas-World-Population-History-Hist/dp/0140510761
- Tacitus.nu https://www.tacitus.nu/
2. Borders - EmperorTigerstar - The History of Europe: Every Year https://www.youtube.com/watch?v=oWWLECJnylM
- EmperorTigerstar - The History of the Middle East: Every Year https://www.youtube.com/watch?v=5eIADs7Ct-Q
- Ollie Bye - The History of Africa: Every Year https://www.youtube.com/watch?v=NzKejJIwieE
3. Music - mrgice3 - Gladiator - The Battle Super Theme Song https://www.youtube.com/watch?v=x7O5LE9ZM0k
[Source](https://www.youtube.com/watch?v=UY9P0QSxlnI)