Lucid Cuts C++ Rebuild Times With Database-Driven Incremental Linker
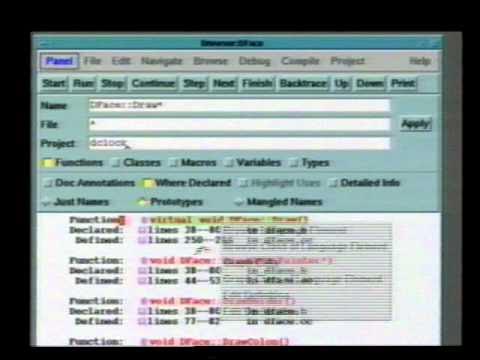
Lucid Energize Demo VHS 1993 — Zach Beane

Zach Beane

By tracking code semantics in an object database, Energize isolates compilation strictly to modified functions and splices changes into existing binaries to eliminate full rebuild cycles.

AI-assisted summary of Lucid Energize Demo VHS 1993 — original source. Check the original for full context.

Source published:

Key ideas

  • Lucid demonstrated the Energize programming environment for C and C++, combining an object-oriented database (OODB) with an editor-centric architecture built around Lucid Emacs. (0:04)
  • The environment introduces fine-grained, language-level incremental compilation, compiling only modified functions (into `.i` slices merged into `.o` files) rather than entire translation units. (21:05)
  • Energize eliminates traditional header recompilation cascades by checking semantic dependency usage rather than coarse file-level inclusion timestamps. (18:19)
  • Incremental linking reuses pre-linked external libraries and unchanged symbols directly from the existing binary, avoiding redundant scans of system libraries and enabling near-instant turnaround. (22:46)

Detailed notes

## Background Published on YouTube by Zach Beane on May 16, 2014, this video presents a 1993 VHS recording demonstrating Lucid's Energize C/C++ programming system. The video description notes that Lucid developer David Williams showcases the environment's capabilities, referencing Richard Gabriel's essay on the project's history.

## TL;DR David Williams introduces Lucid Energize, an editor-centric IDE built on Lucid Emacs and backed by a centralized object-oriented program database. Demonstrating with a sample digital clock application (`dclock`), Williams investigates an input-handling bug, navigates interactive call stack objects, and queries class and call hierarchies via graphical browsers. He then demonstrates the platform's core architectural strength: fine-grained incremental compilation and linking. By isolating modifications down to individual functions—even when editing widely included header files—Energize compiles only changed code slices and splices them into existing binaries, updating debugger state and running executables almost instantaneously.

## Atmosphere & style The presentation carries the measured, earnest tone of a classic early-1990s workstation software demo, grounded by Williams's calm, articulate narration and practical developer mindset. Addressing common developer frustrations like the dread of touching header files or restarting out-of-sync debuggers, Williams delivers each revelation with quiet confidence. Watching the crisp X11 interfaces and interactive Emacs buffers react in real time evokes a striking sense of technical prescience, making the system feel like an advanced, forgotten artifact from the golden age of Unix development environments.

## Bulletin - [00:04](https://www.youtube.com/watch?v=pQQTScuApWk&t=4s) Lucid demonstrated the Energize programming environment for C and C++, combining an object-oriented database (OODB) with an editor-centric architecture built around Lucid Emacs. - [21:05](https://www.youtube.com/watch?v=pQQTScuApWk&t=1265s) The environment introduces fine-grained, language-level incremental compilation, compiling only modified functions (into `.i` slices merged into `.o` files) rather than entire translation units. - [18:19](https://www.youtube.com/watch?v=pQQTScuApWk&t=1099s) Energize eliminates traditional header recompilation cascades by checking semantic dependency usage rather than coarse file-level inclusion timestamps. - [22:46](https://www.youtube.com/watch?v=pQQTScuApWk&t=1366s) Incremental linking reuses pre-linked external libraries and unchanged symbols directly from the existing binary, avoiding redundant scans of system libraries and enabling near-instant turnaround.

## Key takeaways - [00:04](https://www.youtube.com/watch?v=pQQTScuApWk&t=4s) Energize was designed around three foundational pillars: object-oriented programming, integrated development environments, and advanced user interface design. - [01:17](https://www.youtube.com/watch?v=pQQTScuApWk&t=77s) The development environment is editor-centric, using Lucid Emacs with support for vi-mode keybindings as the primary interface. - [01:17](https://www.youtube.com/watch?v=pQQTScuApWk&t=77s) Compiling source files automatically populates an object-oriented database (OODB) with fine-grained semantic symbols and relationships, eliminating the need for manual project file lists. - [03:02](https://www.youtube.com/watch?v=pQQTScuApWk&t=182s) Call stacks, source files, functions, and variables are treated as interactive first-class system objects with context-sensitive action menus. - [04:55](https://www.youtube.com/watch?v=pQQTScuApWk&t=295s) Source buffers integrate semantic annotations, displaying program-counter positions and green icons for syntactic language elements like functions, classes, and macros. - [06:47](https://www.youtube.com/watch?v=pQQTScuApWk&t=407s) The Language Element Browser enables structured queries and pattern matching across classes, member functions, and variable scopes directly within an Emacs buffer. - [09:24](https://www.youtube.com/watch?v=pQQTScuApWk&t=564s) A graphical class grapher provides visual inspection of class inheritance trees, with interactive node expansion and method filtering. - [10:27](https://www.youtube.com/watch?v=pQQTScuApWk&t=627s) The Call Tree Browser maps caller and callee hierarchies for individual member functions, linking graphical nodes directly to source code definitions. - [12:43](https://www.youtube.com/watch?v=pQQTScuApWk&t=763s) The central server tracks editor buffer offsets to resolve modified language elements, broadcasting state changes to shade stale code and notify connected tools. - [18:19](https://www.youtube.com/watch?v=pQQTScuApWk&t=1099s) Modifying widely included header files triggers compilation only for functions that directly reference altered symbols, avoiding the typical makefile-induced cascades. - [21:05](https://www.youtube.com/watch?v=pQQTScuApWk&t=1265s) The Tool Status monitor tracks compiler and linker phases in real time, compiling isolated functions into intermediate `.i` files that splice back into standard `.o` files. - [22:46](https://www.youtube.com/watch?v=pQQTScuApWk&t=1366s) Incremental linking extracts and reuses unchanged static and shared runtime libraries directly from the existing binary instead of re-reading gigabytes of system paths. - [16:16](https://www.youtube.com/watch?v=pQQTScuApWk&t=976s) The integrated debugger automatically synchronizes breakpoints and symbol tables when the target binary is updated, removing the need to restart debugging sessions.

## Detailed walkthrough ### [00:04](https://www.youtube.com/watch?v=pQQTScuApWk&t=4s) Introduction to the Energize Programming System

David Williams, a developer at Lucid, introduces Energize, a programming environment built from the ground up for C and C++ developers. Williams explains that the system is engineered around how programmers naturally work, with the dual objectives of making development substantially faster and significantly easier. The speed advantage stems directly from Energize’s proprietary incremental compilation and relinking architecture, ensuring developers only spend machine cycles processing code that has actively changed. At the same time, the system clarifies navigation by maintaining a comprehensive, synchronized understanding of all software components across an entire project.

Williams outlines the three key pillars powering the platform:

```mermaid flowchart TD accTitle: Core Pillars of Lucid Energize accDescr: Three foundational technologies that enable Lucid Energize's development workflow

subgraph Foundations["Foundational Technologies"] direction LR OOP["Object-Oriented\nProgramming"] IDE["Integrated Development\nEnvironments"] UID["Advanced User\nInterface Design"] end

Foundations --> System["Lucid Energize System"] System --> Fast["Fast: Incremental Compilation & Link"] System --> Easy["Easy: Global Program View & Navigation"] ```

To demonstrate these principles in practice, Williams walks through a live debugging and development scenario using a small C++ application: locating a bug, making the fix, and verifying the modified code in place. As Williams summarizes the engineering philosophy: “It's faster because Energize's incremental compilation technology means that you only recompile and relink the parts of your program that you change.”

[01:17](https://www.youtube.com/watch?v=pQQTScuApWk&t=77s) Editor-Centric Architecture and Object Navigation

Energize is intentionally designed as an editor-centric system because programmers spend the overwhelming majority of their working hours inside text editors. The default integrated editor is Lucid Emacs, equipped with full vi-mode keybindings for developers who prefer modal editing. At the initial view, the editor displays two primary buffers, prominently featuring the Energize top-level buffer that catalogs all active projects in the environment.

Williams examines the `dclock` (digital clock) project, explaining that in Energize's terminology, a project corresponds directly to a software module or library. Rather than relying on manual file lists or external project definitions, the project was created simply by compiling the `dclock` source files. As the compilation occurs, the compiler transmits its fine-grained semantic understanding of the source directly to the background Energize server, which stores every symbol, relation, and structure in an object-oriented database (OODB). Because this database retains deep semantic knowledge, code metadata and structural cross-references remain instantaneously accessible without re-indexing.

Within the project buffer, moving the cursor over any component—such as files, modules, or targets—highlights the item, identifying it as an active Energize system object. Clicking any highlighted object exposes a context-sensitive menu of valid operations tailored to that element's type: - **Source file objects** display operations such as edit, error-checking, and syntax evaluation. - **Project objects** present high-level operations including edit, build, and debug.

Selecting `Debug Target` on the `dclock` project immediately spawns an embedded debugger buffer in the lower pane of the Emacs frame, paired with a persistent graphical control panel along the top edge to provide single-click access to common execution and stepping commands.

[03:02](https://www.youtube.com/watch?v=pQQTScuApWk&t=182s) Running the Digital Clock and Intersecting the Bug

Williams launches the `dclock` test target directly from the debugger control panel. The application appears in an X11 window as a simple digital time display designed to tick continuously until a user presses the `q` key to shut it down.

When Williams sends keyboard inputs to the running clock window, pressing `q` fails to quit the application; instead, the program merely sounds an audible terminal beep and keeps running. With the bug isolated, Williams halts execution using the debugger panel and issues a backtrace command.

```mermaid flowchart LR accTitle: Debugger Inspection Flow accDescr: Flowchart showing the path from application hang to source code inspection

A["Clock Window Running"] -->|"Press 'q' (Beeps, does not quit)"| B["Debugger: Interrupt/Stop"] B --> C["Generate Interactive Backtrace"] C --> D["Click Frame 'DFace::run'"] D -->|"Select 'Show Frame'"| E["Emacs loads dface.cc at call site"] ```

Unlike static, textual call stacks produced by standard command-line debuggers, the Energize backtrace is composed entirely of interactive database-backed objects. Hovering over stack entries highlights variables and execution frames: - Hovering over `argv` (the argument vector passed into `main`) allows the developer to click and invoke `print *`, prompting Energize to look up the underlying data type and format the original program invocation string cleanly in the buffer. - Individual call stack frames are first-class system objects. Williams targets the `DFace::run` frame, representing the primary event loop of the clock's interface class.

Selecting the `Show Frame` action from the frame's object menu sends a direct command to the Emacs buffer to load `dface.cc` and scroll immediately to the exact call site within `DFace::run`. Williams underscores that this is not an ephemeral, read-only display tool: “And this is not just a display-only tool. This is the same editor that we've been using for everything else. So we can go ahead and edit our source directly.”

[04:55](https://www.youtube.com/watch?v=pQQTScuApWk&t=295s) Language Elements and Main Loop Diagnostics

The source buffer visualizes semantic code metadata using in-editor icons positioned in the margin: - A prominent program-counter arrow marks the exact execution point where execution halted—inside `read()`, called from within `DFace::run()`. - Distinct green icons denote what Energize designates as **language elements**. A language element represents any granular, syntactic construct recognized by the compilation database, including functions, class definitions, `#define` preprocessor macros, and variable declarations.

Inspecting the source code for the `DFace::run` event loop reveals its control flow: ```cpp while (!done) { read(event); handle(event); tick(); } ``` Williams notes that `done` functions as a boolean termination flag, while `read()` fetches incoming X11/keyboard inputs. Because hitting keys produces an audible beep, the application is reading input successfully, but `handle()` is evidently mishandling the input event instead of setting `done` to terminate the loop.

To investigate the methods available on the class, Williams clicks the green icon representing the `DFace::run` language element and executes `Browse Class of Language Element`, which immediately launches the Language Element Browser.

[06:47](https://www.youtube.com/watch?v=pQQTScuApWk&t=407s) Browsing and Querying the Semantic Database

The Language Element Browser operates as a structured textual query and inspection tool populated from the Energize OODB. The default view for `DFace` lists its physical source file definition, its inheritance ancestry (identifying `Interactor` as its base class), and a categorized inventory of every data member and member function belonging to the class.

Like the rest of the interface, every symbol rendered within the browser is an interactive object capable of spawning further actions. Because the browser renders directly into a native Emacs buffer, developers retain full text manipulation capabilities—such as copying, saving, and regular editing—while benefiting from a live hyperlinked structure.

```mermaid flowchart TD accTitle: Language Element Browser Query System accDescr: Layout of the query options inside the Language Element Browser control panel

subgraph QueryInput["Top Half: Search Filters"] Pattern["Pattern: 'DFace::draw*'"] Scope["Scope: All files in 'dclock' project"] Kind["Element Kind: Functions only\n(Classes/Macros/Vars/Types disabled)"] end

subgraph OutputControl["Bottom Half: Result Detail"] Detail["Detailed Information: Toggle Off (List view)"] end

QueryInput --> Apply["Action: Apply Query"] OutputControl --> Apply Apply --> Results["Result Buffer: List of matching function objects"] ```

When developers need to look up code elements without an existing on-screen reference to click, the browser provides a dedicated query control panel: - **Name and Wildcard Patterns**: Users can supply wildcards and regular expressions, such as querying for `DFace::draw*`. - **Scope Constraints**: Searches can be scoped globally, constrained to specific project libraries (such as `dclock`), or applied across discrete source files. - **Syntactic Filtering**: Checkboxes selectively isolate language element categories, allowing users to enable `Functions` while disabling `Classes`, `Macros`, `Variables`, or `Types`. - **Detail Toggle**: The bottom pane switches between full member expansions and concise summary listings.

Clicking `Apply` with these settings returns an instant list of all method variants satisfying `DFace::draw*`.

[09:24](https://www.youtube.com/watch?v=pQQTScuApWk&t=564s) Graphical Class Hierarchy Exploration

Beyond textual exploration, Energize provides graphical structural analysis. By clicking a member function object and selecting `Graph Class of Language Element`, Williams launches the graphical class grapher.

The grapher visualizes class structures, displaying an inheritance tree where `DFace` is shown subclassing `Interactor`. A small numerical badge annotated as `[3]` appears attached to the `Interactor` node, indicating that three additional sibling classes branch off the same base class. Clicking the badge opens a context menu; selecting `Show Right Nodes` expands the visual canvas to display all derived child classes simultaneously, allowing developers to interactively expand, prune, or reorganize large object-oriented hierarchies on screen.

[10:27](https://www.youtube.com/watch?v=pQQTScuApWk&t=627s) Inspecting Inherited Methods and Exploring Call Hierarchies

David Williams demonstrates the filtering power of the Class Browser control panel to inspect class internals without wading through visual clutter. Posing a typical developer question—whether the `HorizontalBox` class implements its own `draw` function—he types `draw` into the function search slot, confirms the search filter, and clicks apply. The graph instantly reorganizes to show only the classes that define or implement `draw`. Looking at the resulting graph, Williams observes: “So we can determine very easily and very visually from that that horizontal box doesn't implement its own draw function. It inherits it from the base class box.”

```mermaid flowchart TD accTitle: Call Hierarchy Around Dface::handle accDescr: Visual flowchart showing the caller and callee relationships centered on the Dface::handle member function.

subgraph Callers ["Caller Functions"] Run["Dface::run()"] end

subgraph Target ["Focus Object"] Handle["Dface::handle()"] end

subgraph Callees ["Callee Functions"] C1["Other Member Functions..."] C2["Event Processing Routines..."] end

Run --> Handle Handle --> C1 Handle --> C2 ```

Switching the browser control panel to display all member functions across the visible classes reveals another practical UI accommodation: when classes possess more methods than can fit on the screen, the grapher embeds them into compact, scrollable node lists so they do not consume excessive display space. Seeking to understand program behavior more broadly, Williams turns his attention to the `Dface` class and specifically its `handle` member function. Because `handle` is treated as a first-class semantic object within the environment, clicking it and selecting "graph calls" immediately launches the Call Tree Browser. The resulting call graph isolates the focus node along with its immediate parents and children, confirming that `handle` is called by `run` and showing the downstream routines it invokes.

[12:43](https://www.youtube.com/watch?v=pQQTScuApWk&t=763s) Diagnosing the Quit Bug and Tracking Edit State via the Cadre Server

From the call tree, Williams selects "edit definition" directly on the `handle` object, which immediately loads the corresponding source code into the editor. Reviewing the event loop logic, Williams notes that terminating the application requires the `done` flag to be set to true upon a key event. Inspecting the `switch` statement on the incoming event type, he spots the error in the key-matching condition:

> “So, okay, if it's a key event and the event length is greater than zero, key string is equal to or equivalent to a. Well, there's the problem. I think I think that's going to be a problem because that should be a Q. Looks like some kind of a typo. And then that's going to set done equal to true.”

```mermaid flowchart LR accTitle: Energize Change Notification Architecture accDescr: Message flow between text editor and central server updating out-of-date object states.

subgraph EditEvent ["Editor Action"] Ed["Text Editor"] -->|"edited deface.cc at pos 2000"| Srv["Energize Server / DB"] end

subgraph Broadcast ["Server Resolution & Broadcast"] Srv -->|"resolves to Dface::handle(); marks out of date"| Srv Srv -->|"notify: object out of date"| Tools["Connected Tools / Graphers"] Srv -->|"re-render region with shading"| Ed end ```

To verify the diagnosis before editing, Williams selects "set breakpoint" on the line. The environment updates the source buffer with a stop-sign glyph and simultaneously reflects the breakpoint object in the grapher. Rerunning the program and pressing `A`, execution halts at the breakpoint; stepping forward confirms `done` flips to true, allowing the program to terminate. Williams disables the breakpoint and replaces `'A'` with `'Q'`. Instantly, the background shading of the function in the text buffer changes color. Williams explains the architecture driving this visual cue:

- The editor itself has no deep C++ semantic awareness; it simply notifies the central server that characters at a specific file offset (such as character position 2000 in `deface.cc`) were modified. - The server consults its internal program database, resolves the character span to the `Dface::handle` object, and flags that object as out-of-date and in need of recompilation. - The server broadcasts an update message to all connected tools displaying that object, commanding the editor to apply background shading over the stale function text to alert the developer.

[16:16](https://www.youtube.com/watch?v=pQQTScuApWk&t=976s) Incremental Build, Fast Link, and Seamless Debugger Synchronization

Having corrected the typo, Williams saves the file and triggers a recompile. Because Energize operates at fine-grained object granularity, it executes an incremental compilation that recompiles solely the `handle` member function inside `deface.cc`, followed immediately by an incremental link back into the executable rather than a full, sluggish relink. The debugger target is refreshed and ready in seconds. Running the new build and pressing `Q`, the application exits immediately as expected.

Williams contrasts this seamless turnaround with the manual friction of conventional Unix programming environments:

> “Now, in an old style environment, we'd have to shut down the debugger and restart the debugger because all of its information is out of date. Well, with our system, that's done for us automatically. You know, the server sends out a message to the debugger saying, 'Hey, your target has changed. Reload your symbol table information, reload all your debugger information, you know, reload your break points, and we get a new ready to run debugger session that's automatically done for us.'”

Because the environment manages tool state across the board, developers are relieved from babysitting symbol tables or process lifecycles.

[18:19](https://www.youtube.com/watch?v=pQQTScuApWk&t=1099s) Fine-Grained Header Modifications and Granular Dependency Analysis

Williams shifts focus to how Energize tackles one of the greatest performance bottlenecks in C and C++ software engineering: editing widely included header files. He remarks: “To do that, I'm going to do something which C and C++ programmers really don't like to do. I'm going to edit a header file.” Loading the project buffer, he opens `deface.h` and modifies the enumerator type `mode` by adding an extra field, then saves the file.

In traditional build systems driven by `make`, altering a header forces a full recompilation of every source file containing that `#include`. To illustrate the conventional fallout, Williams clicks on the `deface.h` object in the browser and chooses "where included", which reveals: - `deface.cc` - `dclock.cc`

Under standard toolchains, both translation units would undergo complete recompilation followed by a full relink that pulls in all linked libraries again. In contrast, Energize checks semantic language-level dependencies rather than coarse file-level inclusion timestamps. Querying the language element browser on the modified `mode` enum reveals that it is referenced by: - The `Dface` class definition (which carries no executable code generation impact) - The member function `Dface::set()`

Since `Dface::set()` is the only function that actually consumes the enum, Energize isolates recompilation strictly to that single function, bypassing untouched functions in both `deface.cc` and `dclock.cc`. Before executing this fine-grained compilation and incremental link, Williams prepares to demonstrate the internal mechanics by launching the Tool Status tool.

[21:05](https://www.youtube.com/watch?v=pQQTScuApWk&t=1265s) Tool Status and Incremental Compilation in Action

David Williams turns to the Tool Status tool in the Energize system, which serves as a central monitor tracking the real-time activity and state of every integrated tool across the environment. Initiating a build of the application target triggers an immediate, fine-grained response visible directly in the monitor. Instead of processing entire source trees or even whole source files, the compiler starts up solely to recompile the single modified `set` member function located inside `dface.cc`. Within moments, that function-level compilation finishes, and the compiler automatically invokes the linker.

```mermaid flowchart TD accTitle: Lucid Energize Incremental Compile and Link Flow accDescr: Step-by-step diagram showing function-level compilation into an incremental object file, merging into dface.o, and fast relinking into the dclock target binary.

subgraph CompileStage["Function-Level Compilation"] A["Modified 'set' function<br/>(in dface.cc)"] -->|"Compiler compiles only modified function"| B["Incremental Object File<br/>(dface.i)"] end

subgraph ObjectLinkStage["Object File Splicing"] B -->|"Linker merges function"| C["Object File<br/>(dface.o)"] D["Unchanged functions<br/>(9 out of 10 in dface.o)"] -.->|"Preserved in place"| C end

subgraph ExecutableStage["Target Relinking"] C -->|"Linker updates target"| E["Final Executable<br/>(dclock)"] F["Static & Shared Libraries<br/>(C, C++, X11, Databases)"] -.->|"Reused from existing binary"| E end ```

The linker rapidly incorporates the newly recompiled `set` function back into the existing object file, followed by the main link phase that integrates these isolated modifications into the final `dclock` executable target. The entire cycle finishes almost instantaneously. Williams explains the mechanics underlying this speed: if `dface.cc` contains ten functions and nine of them have no reliance on the modified AM mode, recompiling those untouched functions is wasteful. Energize leaves the valid code intact inside `dface.o`, compiles only the edited `set` function, and outputs a compact incremental object file named `dface.i`. This incremental slice is then linked directly back into `dface.o` to produce an incrementally updated, fully standard-compliant object file at a fraction of the usual compilation cost.

- The Tool Status window provides live visibility into tool invocations, showing the exact phase from compiler startup to final target link. - Compilation is restricted strictly to the modified `set` function rather than reparsing and regenerating code for the entire `dface.cc` translation unit. - The intermediate product is a miniature incremental object file (`dface.i`), which is merged back into the standard object container (`dface.o`). - The resulting `.o` file remains 100% compatible with traditional, standard UNIX developer tools while avoiding full recompilation overhead.

---

[22:46](https://www.youtube.com/watch?v=pQQTScuApWk&t=1366s) Incremental Linking, Library Reuse, and Instant Execution

Williams shifts to the linking phase, characterizing it as where developers achieve an enormous performance advantage over traditional development toolchains. In typical real-world development, roughly ninety percent of an application consists of code the programmer never wrote and rarely modifies—such as standard C runtimes, C++ libraries, X Window System toolkits, and database interfaces. Lucid recognized that searching system paths to re-read and re-parse gigabytes of static libraries on every build is completely unnecessary when that binary data already resides inside the existing program file.

> “So, we thought at Lucid, well, it's kind of silly to go and get them from, you know, all the library directories around the system. You know, you've got them there in the program file.”

Energize achieves its dramatic speed by reading the metadata and existing binary structures already present in the target executable. The linker splices the newly minted incremental object code for `set` directly into the existing executable, reorganizes the symbols, and emits a fresh, fully compliant executable file. Upon completing the link, Energize immediately updates and attaches the debugger without manual intervention. Williams launches the refreshed `dclock` binary on screen, demonstrating that the changes take effect with near-zero latency.

- Up to 90% of an application's footprint consists of unchanging external libraries (C, C++, X11, databases) that traditional linkers waste time reprocessing on every edit. - Energize reuses pre-linked library structures directly from the existing binary image on disk instead of re-resolving external libraries from scratch. - The resulting executable target remains fully compliant with standard execution environments and diagnostic utilities. - The integrated debugger reloads the new binary automatically, letting developers immediately test runtime behavior without manual context-switching.

---

[23:54](https://www.youtube.com/watch?v=pQQTScuApWk&t=1434s) Conclusion: The Core Strengths of the Energize Environment

Wrapping up the presentation, Williams summarizes the foundational principles behind the Energize programming environment. First, user interaction is kept intuitive and seamless: navigation centers on clicking program objects, selecting operations from contextual pull-down menus, and traversing relational links across the codebase. Because the interface wraps tools and workflows familiar to contemporary programmers, adoption requires virtually no retraining.

Second, Energize is a tightly integrated system where the environment manages all inter-tool coordination behind the scenes. Developers no longer need to babysit makefiles, track object dependencies manually, or orchestrate disparate compilers and debuggers. Third, the platform's fine-grained syntactic and semantic understanding of source code completely eliminates the brute-force cycle of full recompilation and relinking for minor modifications.

> “Programming using an incremental compile and link is just plain fast.”

Williams concludes by emphasizing that Energize is designed from the ground up to be easy to learn, straightforward to operate, and an immense time-saver for large-scale C and C++ software engineering projects. He encourages interested viewers to reach out directly to Lucid with any inquiries before signing off.

## Notable quotes > [23:54](https://www.youtube.com/watch?v=pQQTScuApWk&t=1434s) Programming using an incremental compile and link is just plain fast. — David Williams

## Mentioned Lucid, Lucid Energize, David Williams, Lucid Emacs, dclock, X11, UNIX, Zach Beane

## Video description David WIlliams demonstrates Lucid's C/C++ programming system.

See also http://www.dreamsongs.com/Cadillac.html

[Source](https://www.youtube.com/watch?v=pQQTScuApWk)

中文简报

Lucid 凭借数据库驱动增量链接器缩短 C++ 重建时间 通过在对象数据库中跟踪代码语义,Energize 将编译范围严格限制在已修改的函数,并将更改拼接合并到现有二进制文件中,从而消除完整的重新构建周期。 David Williams 介绍了 Lucid Energize,这是一款以编辑器为核心、基于 Lucid Emacs 构建并由集中式面向对象程序数据库提供支持的 IDE。Williams 以一个数字时钟示例应用程序(`dclock`)进行演示,排查了一个输入处理错误,浏览了交互式调用栈对象,并通过图形化浏览器查询了类与调用层次结构。随后,他展示了该平台的核心架构优势:细粒度的增量编译与链接。即使在编辑被广泛包含的头文件时,Energize 也能将修改隔离细化至单个函数,仅编译发生更改的代码切片并将其拼接合并到现有二进制文件中,从而几乎即时更新调试器状态和正在运行的可执行文件。 Lucid 演示了面向 C 和 C++ 的 Energize 编程环境,该环境将面向对象数据库(OODB)与围绕 Lucid Emacs 构建的以编辑器为中心的架构相结合。 (0:04) 该环境引入了语言级别的细粒度增量编译,仅编译修改后的函数(生成合并至 `.o` 文件的 `.i` 切片),而非整个翻译单元。 (21:05) Energize 通过检查语义依赖的使用情况而非粗粒度的文件级包含时间戳,消除了传统的头文件级联重新编译问题。 (18:19) 增量链接直接重用现有二进制文件中预链接的外部库和未更改的符号,避免对系统库进行多余扫描,实现近乎即时的周转。 (22:46)

Reading summary

David Williams presents Lucid Energize, a 1993 C and C++ programming environment designed to accelerate development by coupling an object-oriented code database with fine-grained incremental compilation and linking. The system replaces file-centric build workflows with semantic object tracking, enabling targeted recompilation, fast relinking, and automatic state synchronization across the editor, compiler, and debugger. Object-Centric Architecture and Semantic Database (1:17) Energize centers its development workflow around an integrated text editor—Lucid Emacs with standard vi keybinding support—connected to a background server and an object-oriented database (OODB). When code is compiled, the compiler passes fine-grained semantic structures directly into the database. This converts source files, classes, functions, preprocessor macros, and variables into interactive system objects that remain accessible without manual re-indexing. Within editor buffers and diagnostic views, these language elements are represented by active visual glyphs and contextual menus rather than static text. In the debugger, call stack entries behave as first-class objects: hovering over arguments like argv allows instant type inspection, while selecting a stack frame directly opens the corresponding source file at the exact call site inside the editor. Querying and Visualizing Code Hierarchies (6:47) To navigate complex software architectures without relying on crude text searches, Energize provides structured semantic query and graphing tools. The Language Element Browser enables developers to filter program elements by syntactic category (such as isolating functions while excluding variables and macros), scope, and name wildcards. Because query results render directly within native editor buffers, developers retain standard editing capabilities alongside interactive links. For visual exploration, the environment includes graphical class and call-tree browsers. These tools visualize inheritance hierarchies, display expandable node badges for sibling classes, and permit interactive filtering—such as isolating classes that implement a specific draw method. Call trees isolate focus functions like DFace::handle, displaying immediate callers and callees to trace program execution paths visually. Server-Mediated Coordination and Tool Synchronization (12:43) Energize eliminates manual context switching by routing environment changes through a central Cadre server. When a developer edits code, the text editor does not parse the C++ grammar itself; it simply informs the server of character offset changes. The server maps those edits to the corresponding semantic object in the program database, flags that object as out-of-date, and instructs the editor to render colored background shading over the modified function. This centralized coordination extends across tool boundaries. After an edit is incrementally recompiled, the server automatically instructs the active debugger to refresh its target, reload its symbol table, and retain existing breakpoints. Developers avoid the conventional Unix requirement of terminating, restarting, and reconfiguring the debugger across build cycles. Fine-Grained Compilation and Incremental Linking (18:19) Traditional build tools like make force a full recompilation of all translation units that include a modified header file. Energize replaces file timestamp matching with fine-grained language dependency analysis. When an enumerator inside a shared header file is modified, the system queries the database to identify which specific functions consume the altered type, restricting recompilation strictly to those routines while bypassing untouched functions across the project. The compiler produces an incremental object slice (a .i file), which the linker splices into the existing standard .o container. To accelerate linking further, Energize avoids re-reading static and shared libraries (such as C runtimes, X11, or database toolkits), which Williams notes often make up 90 percent of an application's binary code. Instead, the linker reuses pre-linked library structures directly from the existing target binary on disk, splicing in the updated object code with near-zero latency. Williams argues that fine-grained incremental compilation and linking fundamentally streamline C and C++ development by removing the mechanical overhead of makefiles and full project relinks. While the presentation demonstrates significant turnaround gains on workstation-class applications, it showcases an interactive single-user environment and does not detail how the central database architecture handles distributed team collaboration or version control merges.

精炼阅读摘要

Lucid 开发者 David Williams 在 1993 年的系统演示中阐述了 Energize C/C++ 开发环境的架构设计,主张通过面向对象数据库持久化程序语义,并结合函数级增量编译与链接技术,从根本上降低代码重构开销并提升开发流转效率。 基于对象数据库的语义感知与编辑器集成 (1:17) Energize 采用以编辑器为核心的架构设计,将内置支持 vi 键位的 Lucid Emacs 作为主工作界面。Williams 说明,由于程序员大部分时间处于编辑环境中,该系统通过编译过程直接捕获代码深层结构:当源代码首次编译时,编译器会将精细的语法与语义结构同步传送至后台 Energize 服务端,并持久化于面向对象数据库(OODB)中。这种设计避免了传统开发工具对全工程进行重复且耗时的代码索引重构,使符号信息与代码交叉引用保持实时可检索状态。 在此体系下,工程内的各级组件均被抽象为一等系统对象。无论是工程文件、模块、目标还是具体语法单元,在编辑器内均具备交互感知能力,光标悬停即可高亮,点击则可调出针对该对象类型的操作菜单。编辑器边栏同时渲染程序计数器和绿色语言要素(Language Element)图标,将类定义、预处理宏、变量声明与底层数据库关联,建立起文本流与语义实体间的直接映射。 交互式调试与多维代码图形化探索 (3:02) 在排错工作流中,Energize 将内嵌调试器置于 Emacs 窗格,并搭配图形控制面板提供执行与单步控制。与传统命令行调试器的纯文本输出不同,Energize 的调用栈完全由数据库支持的交互对象构成。以演示中数字时钟(dclock)键盘响应失效的故障为例,开发者可直接在调用栈中点击检查变量 argv 的实际类型与内容,或通过选中 DFace::run 栈帧触发 Show Frame,使编辑器瞬间定位到调用现场,且该缓冲区始终保持原生可编辑状态,而非只读视图。 为辅助开发者理解程序调用拓扑与继承关系,系统提供了文本化的语言要素浏览器与图形化分析工具。开发者不仅能借助通配符(如 DFace::draw*)按作用域和语法类型定向筛选方法,还能调阅类继承图谱,通过节点上的数量徽章交互式展开衍生子类。此外,调用树工具能够以 DFace::handle 等核心方法为焦点,自动孤立展示其上下游调用链,使开发者能够在无需逐文件查阅的情况下理清复杂的事件分发流程。 编辑状态实时广播与头文件依赖隔离 (12:43) 在代码修改的感知机制上,Energize 实现了文本编辑器与核心服务器的松耦合协同。文本编辑器自身并不承担深层次的 C++ 语义分析,仅向服务器发送物理修改事件(如特定文件偏移量处的字符变更)。中央服务端依据数据库将该字符区间映射至对应的语法对象(如 DFace::handle),将其标记为过期,并向所有关联工具广播状态,命令编辑器在过期代码区域渲染背景阴影,以向开发者直观预警。 针对传统 C/C++ 项目中修改头文件引发的大规模重编译瓶颈,Energize 放弃了基于文件时间戳的粗粒度推导,改用语义依赖追踪。Williams 在演示中修改了 deface.h 内的枚举类型;虽然传统 make 工具会强制重新编译所有包含该头文件的翻译单元(如 deface.cc 与 dclock.cc),但 Energize 的语言要素查询证实该枚举实质上仅被成员函数 DFace::set() 单独引用。因此,系统自动将后续重新编译的范围精确收敛至该单一函数,彻底旁路了无依赖关联的外部源码。 函数级增量编译与可执行文件直接链接 (21:05) 在实际构建阶段,工具状态监视器展示了微观级的代码生成流程。当触发构建时,编译器仅对受影响的单个成员函数进行编译,输出紧凑的增量目标切片(如 dface.i),随后链接器将该切片原位合并至现有的目标文件(dface.o),未改动的其余函数保持不变。最终生成的 .o 文件与标准 UNIX 工具链完全兼容,同时大幅节约了解析整份源代码与生成机器码的计算资源。 增量链接技术进一步消除了重复解析外部依赖的性能消耗。Williams 指出,现代应用中高达 90% 的二进制体积由长期不变的标准库、GUI 框架和数据库接口构成;Energize 不再反复检索系统路径来读取静态库,而是直接复用已有可执行二进制文件中现存的库结构,仅将重新编译的函数增量剪裁拼接进目标程序中。链接完成后,系统自动向运行中的调试器推送目标变更通知并重载符号与断点,实现了修改后近乎即时的测试验证闭环。 David Williams 认为,Energize 借助对象数据库、细粒度语义追踪与增量构建机制,实质性解决了大规模 C/C++ 工程中编译链接迟滞和工具链碎片化的难题。但需要指出的是,该演示主要基于小型示例应用进行功能验证,系统在超大型企业级代码库、高频模板实例化以及分布式团队协作环境下的数据库扩展性与资源开销,在资料中尚未得到详细评估。

Source quotes

[23:54] David Williams: Programming using an incremental compile and link is just plain fast.

Original transcript

[0:04] Hello, my name is David Williams. I'm [0:06] one of the developers here at Lucid and [0:08] I'd like to show you our new Energize [0:10] programming system. We've built Energize [0:13] for programmers. It's designed to work [0:15] the way that programmers work and [0:17] designed to make programming in C and [0:19] C++ faster and easier. It's faster [0:23] because Energizer's incremental [0:26] compilation technology means that you [0:28] only recompile and relink the parts of [0:30] your program that you change. And that's [0:32] going to save you a lot of time. It's [0:35] easier because Energize gives you a [0:37] complete view of your program and allows [0:40] you an easy way to navigate around all [0:42] of its [0:43] components. All of this is made possible [0:45] by three technologies where Energize is [0:48] at the forefront. object-oriented [0:50] programming, integrated development [0:52] environments, and advanced user [0:54] interface design. We're going to see [0:56] more of those as we move through a [0:59] demonstration. So, let's get started. [1:02] For the purposes of demonstration, we're [1:04] going to take a look at a simple C++ [1:07] program. We're going to find a problem, [1:09] fix it, and test out our changes. So, [1:12] let's go ahead and find out just how [1:14] easy to use Energize is. Okay, the first [1:17] thing to note is that Energize is a very [1:20] editor focused system because most of [1:22] the work we do as programmers is inside [1:25] an editor. The editor that we use in [1:28] Energize is the very popular Emacs [1:30] editor and to that we've also added a VI [1:33] mode. Showing in the editor at the [1:36] moment is two buffers. The Energize top [1:39] level buffer which lists all of the [1:41] projects in the system. And in fact, one [1:43] of those projects is here, the D clock [1:46] project. A project in Energize is is a [1:49] module or a library. You can see that [1:51] the project buffer lists all of the [1:53] components of the project. The project [1:55] was created by simply compiling Dlock [1:58] source files. The compiler transmits its [2:01] fine grain understanding of your code to [2:03] the Energized server where it's stored [2:05] in an object-oriented database. This [2:08] means your program information is always [2:10] going to be instantaneously available. [2:13] You'll notice that as I move around the [2:15] project buffer over the different items [2:17] in it that each of these items gets [2:19] highlighted. That's because they're [2:21] energized system objects and I can click [2:23] on them and it'll give me a list of [2:25] operations that I can perform. And this [2:27] is the basis of the way we move around [2:29] inside of the system. So for example, a [2:31] file here can be edited, check for [2:33] errors, etc. A project has a different [2:37] set of operations. Edit, build, debug. [2:40] Why don't we go ahead load up the [2:42] debugger by saying debug target to have [2:45] a look at our test program. So we start [2:47] up the [2:48] debugger and it's brought up in another [2:51] editor buffer down the bottom here. [2:53] Notice also that we've added this little [2:55] control panel up the top here for the [2:57] debugger which gives us quick access to [3:00] the most common debugger features. So [3:02] why don't we go ahead and run the test [3:05] program. So here's our little test [3:08] program here. As you can see, it's a [3:10] very simple digital clock. It tells the [3:12] time, and when we press Q, the program [3:15] terminates. When we press Q, the program [3:19] terminates. Okay, we seem to have a [3:21] problem. So, that's what we're going to [3:23] work on. We're going to find out why Q [3:25] doesn't work. So, let's start off by [3:28] stopping the [3:29] program. And we'll get a back [3:32] trace. And here's our back trace. Now, [3:35] at first glance, the back trace that you [3:37] get in the debugger is like you would [3:38] get out of any other old debugger, but [3:41] it's different. You see, as I move [3:43] around, you'll see that there's again a [3:45] number of objects in the system which [3:47] get highlighted as I move the cursor [3:49] over them. For example, arg here, which [3:52] is the arguments to the program itself, [3:54] is listed here by this variable. So, I [3:57] can click on it. It's an object. So, I [3:59] get a list of operations that I can [4:01] perform on it. say print star. Energize [4:04] knows what the object is and so prints [4:06] out the invocation string to the program [4:09] in a sensible fashion. The frames [4:11] themselves are objects. Let's go ahead [4:14] and look at run because that's sort of [4:16] like the top loop of the deface class [4:19] and we're going to focus on that for a [4:21] little while. So let's go ahead and we [4:24] get a list of things that we can perform [4:26] on it and one of those is show frame. [4:28] Show frame is going to take me to the [4:30] source. So let's do [4:32] that. And the editor gets sent a message [4:34] to load up the deface.cc file with the [4:38] cursor positioned over the deface run [4:41] function. So this is the way source [4:43] looks inside of the energize system. And [4:46] this is not just a displayon tool. This [4:49] is the same editor that we've been using [4:51] for everything else. So we can go ahead [4:53] and edit our source [4:55] directly. Okay. Couple of points to note [4:58] about the source. First of all, there's [5:00] all these little um icons in the system [5:03] indicating more information. This one [5:05] here, as you might have guessed, is a [5:07] pointer indicating where the program [5:09] counter is. So, we're stopped inside of [5:12] the read function inside of the run [5:14] function. And if we check against the [5:16] back trace, yeah, that's correct. Run is [5:18] calling read. Great. Second thing here [5:21] is these little green icons. Now, what [5:24] do they indicate? Well, what they mean [5:26] is that all of this function is what we [5:28] call a language element as is the [5:30] function above. Well, a language element [5:33] in the energized system is any part of [5:36] your program function, a class, [5:39] hashdeed, you know, a variable, all of [5:42] the elements of the language, hence the [5:44] term language element. Let's have a look [5:46] at what's actually going on inside of [5:48] this function. This is the main loop of [5:50] the digital clock. So, it's an important [5:52] place to start. while not done, read an [5:56] event, handle the event, and then tick [5:58] over some counter. Okay, it looks like [6:00] done is some kind of flag indicating [6:02] when to terminate. So, we're reading the [6:04] event. Okay, when we hit the keyboard, [6:05] it beeps. So, we we must be reading, all [6:08] right, but we're not handling it [6:10] correctly. Instead of exiting when I [6:12] press Q, the program, you know, just [6:14] beeps. So, we're going to focus on [6:16] handle in a moment. But as it's a member [6:18] function of Dface, let's try and find [6:20] out a little bit more because it's an [6:23] object-orientated world. Let's find out [6:25] a little bit more about the Dface class. [6:27] And we can do that very simply. You've [6:29] already seen how we can click on this [6:31] language element and it gives us a list [6:33] of operations that we can perform. One [6:35] of those is browse class of language [6:38] element. And if we browse the class of [6:40] this language element, that's going to [6:42] bring up information about the deface [6:44] class. So let's go ahead and do that. [6:47] And this brings up what we call the [6:49] language element [6:50] browser. And the language element [6:52] browser is a textual tool that displays [6:55] information about language elements. So [6:58] here we have information about the class [7:00] deface. We see that it's where it's [7:02] defined, the base class that it's [7:04] derived from, all of the data members [7:06] and function members defined for this [7:08] class. And of course, each one of the [7:10] items displayed here in the language [7:12] element browser is an object itself. So [7:14] we can click on it and again it gives us [7:17] a list of operations that we can [7:19] perform. Okay, we came into the language [7:22] element browser by clicking on an object [7:25] and saying bring up all the information [7:27] about that object and displaying it in [7:29] the language element browser. Sometimes [7:31] we don't have an object in front of us. [7:34] So to help out that situation, the [7:36] language element browser has a control [7:38] panel. So let's have a look at what that [7:41] does. The control panel is used to name [7:43] an object. So we can, you know, specify [7:45] a name or a pattern to bring up [7:48] information about objects in the [7:49] database. It's it's like a query tool. [7:52] So let's change what we're searching [7:53] for. We'll look for deface colon [7:57] draw star. And so anything that has the [8:01] name deface col star. We'll continue to [8:04] search in all of the files. And let's [8:07] just restrict searching to the dlock [8:09] project. [8:11] we'll just look for functions. We won't [8:13] look for classes, macros, variables, or [8:15] types. So, at the moment, we're looking [8:17] for functions that match that name. [8:20] That's what this the top half of the [8:22] control panel uh controls. The bottom [8:25] half is what we're going to get. At the [8:27] moment, we're getting very detailed [8:29] information. So, let's turn that off. [8:32] And we're all set to go. Let's push [8:34] apply. And you'll see now that we get [8:37] all of the functions that match this [8:39] regular expression up here. So you'll [8:41] see there deface draw colon or deface [8:44] draw and a number of other permutations [8:47] of the draw star [8:49] pattern. Okay, as you can see all of [8:52] these are objects. So again we can click [8:54] on them. Okay, and we can use that to [8:57] traverse around the system. It's the [8:59] basis of how we get around. The language [9:01] element browser is very useful for [9:03] getting textual information. And the [9:06] really great thing is that like most of [9:07] the other components in the system, the [9:10] information is displayed inside of an [9:12] editor buffer. So we can edit it, save [9:14] it to a file, do all the things that we [9:16] do with normal text. We get a nice user [9:19] interface, plus the flexibility of [9:21] ordinary text. Well, that's the textual [9:24] view. Sometimes it's good to get a [9:27] graphical view of what's going on in the [9:29] system. And we can do that quite simply [9:32] by again clicking on an object and [9:35] looking at the operations we can [9:36] perform. One of the things we can do to [9:38] a member function is graph class of [9:41] language element. So let's do that. And [9:44] that's going to bring up the grapher [9:45] tool displaying a class hierarchy for [9:48] the deface class. And you can see that [9:51] deface inherits from the base class [9:53] interactor. It's a very simple class [9:55] hierarchy. [9:58] You'll see that this little three [10:00] suggests that there may be more [10:01] information in the graph. In fact, what [10:04] it's saying is that there are three [10:05] other classes derived from the base [10:08] class interactor. If we want to have a [10:10] look at those, we click on the three. We [10:13] get a menu saying show right nodes. We [10:16] get a new graph and you know showing all [10:19] of the classes derived from the base [10:21] class interactor. And in fact, we can go [10:24] ahead and adjust our graph, hiding and [10:27] showing [10:28] nodes to get more or less information. [10:31] Like the language element browser, the [10:34] class browser has a control panel and we [10:37] can click on that and adjust the [10:38] information that is displayed in the [10:40] class tree. Let's say, for example, that [10:43] we wanted to find out if the horizontal [10:45] box class implemented its own draw [10:49] function. That's very simple to do. We [10:52] just type in draw in the function search [10:55] slot. Say yes, I want to look for [10:57] functions and push apply. And we get a [11:00] new class graph showing all of the draw [11:03] functions in the classes that implement [11:05] it. So we can determine very easily and [11:08] very visually from that that horizontal [11:10] box doesn't implement its own draw [11:12] function. It inherits it from the base [11:14] class [11:15] box. Okay, it's a really simple and [11:18] powerful tool. [11:21] Let's just change it so that we're [11:22] showing all of the member functions for [11:24] each of these classes. So, we make that [11:27] adjustment. Push apply. We'll just hide [11:29] the panel back down to give us more [11:31] room. So, you can see now all of the [11:34] member functions defined for each of the [11:36] classes that we're currently showing. [11:38] You'll see that a number of these [11:39] classes have so many functions that they [11:42] wouldn't fit very well on the screen. So [11:44] the grapher in fact puts them in a [11:46] little scrolling area which we can move [11:48] up and down without taking up too much [11:51] of the [11:52] screen. Okay, we came into the grapher [11:55] to find out a little bit more about the [11:57] deface class because we wanted a sort of [12:00] broader view of what's going on inside [12:02] our program. Now let's return to handle [12:05] and focus in on, you know, how handle [12:07] could be affecting our program. And we [12:10] can do that simply because handle here [12:11] in the deface definition is an object. [12:14] We can click on it and we can say for [12:16] example graph calls and this is going to [12:19] bring up the call tree browser showing [12:21] us that handle is called by the run [12:24] function as we would remember from the [12:26] run definition and in fact calls these [12:28] other functions. Okay, so this is the [12:30] call tree browser and again we only show [12:32] the parents and children of the focus of [12:35] the graph. Again, we have a control [12:37] panel and we can make adjustments to the [12:40] graph. Okay, let's return to the source [12:43] of handle and see if we can find out [12:45] what might be causing the problem. That [12:47] that again is easy to do. We click on [12:49] the object. We get a list of operations [12:51] that we can perform. One of those is [12:54] edit definition, which is going to load [12:56] up the editor with the handle source. So [12:59] now we're back in the editor and we can [13:02] see here here's the definition of the [13:05] handle member function or the source of [13:07] the member function. So let's have a [13:09] look at what's happening. Okay, now [13:11] remember from run that we've already [13:13] read the event and we need to handle it. [13:15] And to terminate the program, we need to [13:17] set the done flag to true. So let's see [13:20] what's going on. So we say okay, switch [13:23] on the event type and it's a key event [13:25] because I'm pressing Q to terminate the [13:28] program. And remember, we need to set [13:29] done equal to true to end the program. [13:31] So, okay, if it's a key event and the [13:34] event length is greater than zero, key [13:36] string is equal to or equivalent to a. [13:39] Well, there's the problem. I think I [13:41] think that's going to be a problem [13:42] because that should be a Q. Looks like [13:43] some kind of a typo. And then that's [13:45] going to set done equal to true. Yeah, [13:47] that makes sense. Well, let's go ahead [13:49] and confirm that. We'll put a break [13:51] point there, which is very easy to do. [13:53] We just say set breakpoint and the [13:56] system automatically updates the source [13:58] to indicate the breakpoint with this [14:00] little stop sign. Also note that the [14:02] grapher was updated again showing the [14:05] stop sign [14:08] object. Okay, let's go ahead run our [14:11] program again and this time yes we want [14:13] to restart the program and this time [14:15] we'll press A and see if that is in fact [14:18] the terminating key at the moment. Okay, [14:21] A. and we come in here. We hit our break [14:25] point. Let's just step through there. [14:27] And in fact, yes, we're going to set [14:29] done equal to true. Okay, let's continue [14:32] that on and let the program [14:34] terminate. Okay, here's the change we [14:37] where we have to make it. Let's disable [14:39] that break point and go ahead and make [14:43] our [14:46] change. Okay, we made our change. Now, [14:48] what's happened here? The background [14:50] highlighting has changed. Okay, what [14:52] that means is that, you know, we've [14:54] edited that function, so it's now out of [14:56] date. It needs recompilation. Well, how [14:59] did that work? Well, it's really pretty [15:01] simple. The editor really only knows [15:04] about text and character positions. So, [15:07] it sends a message off to the server [15:09] saying, "Hey, server, I I just edited [15:11] deface.cc file at character position [15:14] 2000, say." Well, the server knows a [15:17] little bit more information about our [15:19] program. it looks up in its database and [15:21] it says, "Well, deface.cc line 2000." [15:24] Well, actually, what you've done is [15:26] you've edit the definition of the deface [15:28] handle object. So, that object is now [15:31] out of date. It needs to be recompiled [15:34] for the system to be up to date. So, the [15:37] server then sends out a message to all [15:39] the tools that are currently looking at [15:41] that particular object saying, "Hey, you [15:43] know, you're working with this object [15:44] and it's just changed. It's out of date. [15:47] So redisplay that object in such a way [15:49] that the programmer will know that um [15:52] that it's changed and needs [15:54] recompilation. One of those messages [15:56] comes back to the editor and the editor [15:59] is told to redis that region of text so [16:02] that the program programmer can see that [16:04] this function is out of date and needs [16:06] recompilation. And that's why we get [16:08] this background shading effect which as [16:11] you can see is a really good visual clue [16:13] of the effect of our change. [16:16] Okay, we've gone around, we've used the [16:18] browsers to focus in and find the [16:20] problem and we've used the debugger to, [16:23] you know, make sure of that. We've made [16:25] our change. So now we're ready to build [16:28] a new version of the program and test it [16:30] out. So let's go ahead save our change [16:34] and recompile. And of course using [16:38] Energize, we're going to do an [16:40] incremental compilation. And all we're [16:41] going to do is recompile the handle [16:43] function in the deface.cc CC file and [16:46] then as soon as the compilation of [16:48] handle is completed which it seems to [16:50] have done we're going to take our [16:53] changes and link them back into the main [16:56] program and the link is very fast [16:58] because like compilation we do an [17:00] incremental link and then it will [17:02] automatically tell the debugger to [17:04] restart and it looks yes it's already [17:06] done that it restarts the debugger with [17:08] a new executable image all set to go. So [17:11] let's test out our change. We run the [17:16] program and now when I press [17:20] Q, the program stops. Great. Our change [17:24] works. So, couple of things to note [17:27] there. Notice that when you know the [17:30] compile was really fast, you know, we [17:32] did an incremental compilation, [17:33] incremental link. That's great. We're [17:34] going to talk a lot more about [17:36] incremental compilation in a moment. [17:38] Then we had a new executable. Now, in an [17:41] old style environment, we'd have to shut [17:43] down the debugger and restart the [17:45] debugger because all of its information [17:47] is out of date. Well, with our system, [17:50] that's done for us automatically. You [17:52] know, the server sends out a message to [17:54] the debugger saying, "Hey, your target [17:55] has changed. Reload your symbol table [17:57] information, reload all your debugger [17:59] information, you know, reload your break [18:01] points, and we get a new ready to run [18:04] debugger session that's automatically [18:06] done for us. We as programmers don't [18:08] need to worry about managing our tools. [18:10] The system does it for us and we get a [18:14] new program ready to run very [18:17] quickly. Okay, that's all I wanted to [18:19] show you in the first part. You know, [18:21] basically the way we move around the [18:22] system, how easy it is to use the [18:24] energized system, how easy it is to find [18:26] out all the information we need to know [18:28] about our program. Now, we'd like to [18:32] focus a little bit more on the [18:33] incremental compilation technology and [18:36] see how much that is going to benefit [18:37] you in your very large programs. To do [18:40] that, I'm going to do something which C [18:42] and C++ programmers really don't like to [18:45] do. I'm going to edit a header file. So, [18:48] let's load up the project buffer and [18:52] load up a header [18:57] file. and we'll go down to enumerator [19:00] type in here and do is make a change to [19:03] this enumerator type mode. Add an extra [19:06] field there and we'll just save that [19:09] back. Okay, so we've updated the [19:13] deface.h header file. Now in an old [19:16] styling environment that would mean that [19:17] we'd have to go and recompile all of the [19:20] files that include deface.h. So let's [19:22] see who in fact does that. That's quite [19:24] easy to do. We can just click on the [19:27] object up here, the deface.h object, say [19:29] we're [19:31] included, and that's going to show us [19:34] that dface.h is included by deface.cc [19:38] and d [19:39] clock.cc, two C++ files. So again, in an [19:43] old style environment, because of the [19:45] change we've made, we're going to [19:46] recompile dface.cc, recompiled dc [19:50] clock.cc, and then do a full link, [19:52] dragging in all the libraries again. [19:55] Okay, let's have a look what um Energize [19:59] is going to do. Now, first of [20:02] all, AM mode is used by, you know, just [20:05] a couple of functions or, you know, [20:07] three or four, who knows? It's not going [20:08] to be used by every single function in [20:10] those two C++ files. So, let's find out [20:13] in fact who's using it because in terms [20:15] of the language, that's the only thing [20:17] that needs to be recompiled. So let's [20:19] click on that and we can use the [20:21] language element browser to tell us [20:23] who's using AMM mode. And there we go. [20:27] We see enumerator type AM mode is used [20:29] by the class deface. Well, that doesn't [20:32] have any uh code associated with it. And [20:34] it's also used by the deface set [20:36] function. So there's in fact only one [20:39] function that is using mode. So really [20:42] in a perfect world that's the only file [20:45] the only function that we would need to [20:47] recompile and that's in fact that's [20:50] exactly what energize is going to do [20:52] just compile that one set function and [20:54] incrementally compile and incrementally [20:56] link. So let's go ahead and do that. But [20:59] before we do I'm going to bring up um [21:01] the tool status tool. And the tool [21:03] status tool is the third of the tools [21:05] that use in the energized system. And it [21:07] basically tells us what's going on in [21:09] the system. It tells us the status of [21:11] all of the tools. So as we do the [21:14] compilation, we can see the progress in [21:16] the tool stat tool. So let me go ahead [21:19] and build our [21:23] target. So we go down to the tool stat [21:26] tool and we see first of all the [21:27] compiler is starting and just to compile [21:31] the set function in the [21:34] deface.cc file and looks like it's just [21:36] about done doing that. Now the compiler [21:38] will call the linker. There it goes. And [21:41] this will link the set new set function [21:43] back into the object file. And then [21:46] finally our main link linking our [21:49] changes back into the DC clock [21:51] target. And it's all done. Okay, it's [21:54] really fast as you can see. Let's talk a [21:57] little bit about what happened there. [21:59] First thing is deface.cc. We recompiled [22:02] deface.cc to recompile that one function [22:06] set. Let's say there was 10 functions in [22:08] deface.cc. Nine of them they don't need [22:10] to be changed because they don't use AM [22:13] mode and it's the only object in the [22:15] system that has changed. So let's leave [22:17] them alone. We'll leave them there in [22:18] the deface. Oo file. We recompile the [22:21] set function and produce a very small [22:23] object file called an object incremental [22:26] file. [22:27] Defacei. We take that object incremental [22:30] file and then link that back into the [22:33] deface. Oo object file. and we end up [22:36] with a new deface.0 which is [22:38] incrementally manufactured. You know, [22:40] it's completely compatible with standard [22:41] tools, but it was made really fast. [22:44] That's the incremental compilation part. [22:46] The next part is when we link and here [22:48] we get a really, really big win. You [22:50] know, just think about sort of programs [22:53] that you usually work on. You know, you [22:54] drag in the C libraries and the C++ [22:57] libraries and the X libraries, the [22:58] database libraries and all of that other [23:01] stuff. You know, 90% of your program is [23:03] code that you never wrote. and code that [23:05] doesn't change whilst you're developing [23:07] it, you know. So, we thought at Luca, [23:09] well, it's kind of silly to go and get [23:11] them from, you know, all the library [23:13] directories around the system. You know, [23:14] you've got them there in the program [23:16] file. So, that's in fact that's what we [23:19] use. We reuse the information in the [23:21] program file and we take our new object [23:24] incremental our incrementally updated [23:27] set function and we link that back into [23:29] the main program. You know re reorganize [23:32] things produce a new executable program [23:35] which again is completely compatible [23:37] with standard tools but was [23:39] incrementally manufactured. And as you [23:41] can see it's really [23:43] fast. And of course it automatically [23:45] loads up the debugger. So, we can go [23:48] ahead run our new [23:50] program [23:52] and there it [23:54] is. Well, that's all we have time for [23:57] now. We've seen how easy Energize is to [24:00] use. Just click on an object, pull down [24:02] a menu, and follow the link. Energize is [24:05] based around tools that you're probably [24:06] using now, so you'll be up and running [24:08] in no time. Second, we've seen that [24:11] Energize is a truly tightly integrated [24:13] system. All the tools are kept up to [24:16] date automatically by the system, so you [24:18] can focus on your program instead of [24:20] wasting time managing the [24:22] tools. Finally, we've seen that [24:24] Energizer's fine grain understanding of [24:27] your program means that a small change [24:29] that you make doesn't mean you have to [24:31] recompile and relink everything. [24:33] Programming using an incremental compile [24:35] and link is just plain [24:38] fast. Energize is easy to learn, easy to [24:41] use, and it saves a lot of time. [24:44] If you got any questions then please [24:46] give us a call. Thanks for watching.