Adam Khoo称对冲基金抛盘筑底 标普500盈利支撑牛市延续
浑水摸鱼清源
近期AI概念股暴跌属于资金流向传统板块的良性轮动,随着对冲基金去杠杆见底叠加中期选举历史规律,大盘盈利扩张将支撑美股继续走强。
AI-assisted summary of 【Adam Khoo】AI股暴跌30%是崩盘信号?别慌,大盘没你想的那么糟! — original source. Check the original for full context.
Source published:
Key ideas
- 近期热门 AI 与半导体概念股出现 20% 至 50% 的剧烈回调,但标普 500 指数仅微跌约 3%,资金正有序轮动至金融、医疗保健和消费防御等传统板块,大盘整体上升通道依然完好。 (0:00)
- 标普 500 指数当前预期市盈率为 18.7 倍,低于 5 年及 10 年平均水平,且三季度成分股整体盈利增长 30.2%,其中非七巨头公司贡献了 32% 的增长,显示盈利驱动正全面扩散。 (11:45)
- 对冲基金上周出现近 10 年来最快速度的去杠杆清仓(跌幅达 -7.8%),历史上削减超过 5% 的情形均对应大盘重要底部,随后 1 至 6 个月内美股上涨胜率达 100%。 (17:25)
- 对比持续 5.3 年且累涨 1000% 的互联网泡沫,当前 AI 周期仅持续 3.9 年且累涨 137%;英伟达预期市盈率仅约 17 倍,远低于当年思科见顶时的 131 倍,AI 叙事远未见顶。 (25:00)
Detailed notes
## Background 该视频由UP主“浑水摸鱼清源”于2026年11月2日发布在哔哩哔哩平台,内容为知名投资人 Adam Khoo 的市场分析。视频简介指出,近期英伟达、AMD、英特尔等AI概念股大幅下挫引发散户恐慌,但标普500指数整体回调有限,资金实为向传统板块健康轮动;结合合理的估值、超预期的企业盈利、对冲基金的大规模去杠杆以及中期选举后的历史规律,当前回调更接近底部而非崩盘,AI浪潮依然具备广阔潜力。
## TL;DR Adam Khoo 分析指出,尽管部分高热度 AI 股自高点回撤 30% 至 50%,但标普500指数仅小幅回踩约 3%,本质上是大机构获利了结并将流动性向医疗、金融等被低估的“枯燥”板块进行健康再平衡。从基本面看,标普500预期市盈率降至18.7倍且三季度盈利增长超预期,盈利动能正向广泛的传统行业扩散;同时,对冲基金上周出现十年来最剧烈的去杠杆抛售(-7.8%),在历史上高度对应指数阶段性见底。结合美国中期选举后极具确定性的牛市季节性规律,以及 AI 周期在历时与估值上远未达到2000年互联网泡沫疯狂水平的客观事实(英伟达预期市盈率仅约17倍),此次调整是长线分批吸纳优质资产的窗口期。
## Atmosphere & style 整期内容充满激情、自信且极具煽动性与专业说服力。Adam Khoo 带着其标志性的激昂语调和实战家视角,以犀利甚至略带戏谑的口吻直接击碎散户面对暴跌时的盲目恐慌,用一手真实持仓与扎实图表将“股灾叙事”彻底还原为“良性轮动”。叙事节奏张弛有度,既有对不设止损、盲目买入看涨期权的严厉警告,又有对比思科泡沫、展望后市反弹时的昂扬底气,为深陷焦虑的投资者营造了一种拨云见日般的定力与振奋感。
## Bulletin - [00:00](https://www.bilibili.com/video/BV1gD4F6WEwP?t=0s) 近期热门 AI 与半导体概念股出现 20% 至 50% 的剧烈回调,但标普 500 指数仅微跌约 3%,资金正有序轮动至金融、医疗保健和消费防御等传统板块,大盘整体上升通道依然完好。 - [11:45](https://www.bilibili.com/video/BV1gD4F6WEwP?t=705s) 标普 500 指数当前预期市盈率为 18.7 倍,低于 5 年及 10 年平均水平,且三季度成分股整体盈利增长 30.2%,其中非七巨头公司贡献了 32% 的增长,显示盈利驱动正全面扩散。 - [17:25](https://www.bilibili.com/video/BV1gD4F6WEwP?t=1045s) 对冲基金上周出现近 10 年来最快速度的去杠杆清仓(跌幅达 -7.8%),历史上削减超过 5% 的情形均对应大盘重要底部,随后 1 至 6 个月内美股上涨胜率达 100%。 - [25:00](https://www.bilibili.com/video/BV1gD4F6WEwP?t=1500s) 对比持续 5.3 年且累涨 1000% 的互联网泡沫,当前 AI 周期仅持续 3.9 年且累涨 137%;英伟达预期市盈率仅约 17 倍,远低于当年思科见顶时的 131 倍,AI 叙事远未见顶。
## Key takeaways - [00:00](https://www.bilibili.com/video/BV1gD4F6WEwP?t=0s) 散户感知的股灾实为市场内部由 AI 高贝塔股票向低估值传统板块(金融、医疗、工业等)的健康再平衡,牛市基础因此拓宽。 - [05:00](https://www.bilibili.com/video/BV1gD4F6WEwP?t=300s) 标普 500 ETF(SPY)回调幅度不足 4%,主要均线呈完整多头排列,下方核心强支撑位于 716 点附近,最大回调空间预计在 8% 以内。 - [07:19](https://www.bilibili.com/video/BV1gD4F6WEwP?t=439s) 支持中长期看多的五大基石包括:底层盈利强劲、估值重回便宜区间、对冲基金砸盘动能衰竭、AI 革命处在早期以及中期选举后的历史大涨规律。 - [10:00](https://www.bilibili.com/video/BV1gD4F6WEwP?t=600s) 科技巨头资本支出(CapEx)激增引发的情绪恐慌属于过度反应,这类扩张性支出将转化为未来的营收与护城河。 - [11:45](https://www.bilibili.com/video/BV1gD4F6WEwP?t=705s) 从内在价值分布来看,标普 500 中约 27% 估值合理、超 31% 处于低估或严重低估状态,市场整体并未出现全面泡沫。 - [15:35](https://www.bilibili.com/video/BV1gD4F6WEwP?t=935s) 标普 500 净利润率上升至 17%,印证 AI 正在为美国企业带来切实的降本增效,长期来看股价终将追随持续抬升的每股预期收益。 - [17:25](https://www.bilibili.com/video/BV1gD4F6WEwP?t=1045s) 对冲基金去杠杆幅度达到 -7.8%,机构抛压极度出清意味着做空动能衰竭,技术面逼近阶段性胜率极高的反弹底部。 - [20:00](https://www.bilibili.com/video/BV1gD4F6WEwP?t=1200s) 交易纪律上严禁单边买入看涨期权(Call)或 LEAPS 以规避时间价值与隐波暴跌,专业交易者应借助正 Theta 或限制风险的期权价差策略,并严格设置止损。 - [22:25](https://www.bilibili.com/video/BV1gD4F6WEwP?t=1345s) 历史数据显示美国中期选举后美股上涨确定性极强:选后 3 个月平均上涨 8.1%(胜率 95%),6 个月与 12 个月上涨胜率均达 100%。 - [25:00](https://www.bilibili.com/video/BV1gD4F6WEwP?t=1500s) 本轮 AI 浪潮纳斯达克涨幅仅为 2000 年互联网泡沫的约 13%,且核心龙头拥有真实的现金流与高利润支撑,不能简单套用崩盘论。 - [27:35](https://www.bilibili.com/video/BV1gD4F6WEwP?t=1655s) 英伟达在涨幅周期上虽类似当年的思科,但其当前仅 17 倍的预期市盈率与思科泡沫破裂前的 131 倍存在本质差异,估值仍处于合理区间。
## Detailed walkthrough ### [00:00](https://www.bilibili.com/video/BV1gD4F6WEwP?t=0s) AI板块剧烈回调与资金向传统板块的良性轮动
在经历连续几天的急跌、尤其是上周尾盘的下挫之后,许多散户投资者陷入了恐慌,感觉股市仿佛正在遭遇大崩盘。引发这种绝望情绪的核心原因,在于散户高度扎堆的热门AI概念股与超大规模云服务商(hyperscalers)出现了断崖式下跌。在亚马逊(Amazon)与谷歌母公司 Alphabet 公布财报后的单日交易中,美光科技(Micron)单日下挫 5.3%,AMD 下跌 10.8%,英特尔(Intel)因财报爆雷单日暴跌 28%,闪迪(SanDisk)大跌 13.47%,谷歌(Alphabet)下跌 1.4%,Meta 也录得 1.53% 的跌幅。
```mermaid flowchart TD accTitle: Capital Rotation Architecture accDescr: Capital flows out of AI and hyperscaler stocks into non-AI defensive sectors within the S&P 500.
subgraph Outflow["资金流出板块(大幅回撤)"] AI["AI 概念股与超大云服务商<br/>- AMD、Intel、Micron、SanDisk<br/>- Alphabet、Meta"] end
subgraph Inflow["资金流入板块(逆势收绿)"] Boring["传统及防守型板块<br/>- 金融 (Financials)<br/>- 医疗保健 (Healthcare)<br/>- 工业 (Industrials)<br/>- 必需消费品 (Consumer Defensives)"] end
AI -->|"大机构获利了结并再平衡"| Boring Boring -.->|"下一阶段轮动预期"| AI ```
如果从历史高点拉回来看,跌幅更为触目惊心:闪迪、英特尔自高点腰斩 50%,美光科技自高点回撤 30%,Meta 与 Alphabet 也自高点跌去 30%。对于全仓压注在这些高贝塔赛道的散户而言,这种体感完全是一场彻头彻尾的熊市或股灾。然而,标普500指数整体却仅仅回撤了 3% 左右。资金并没有凭空蒸发,而是正在从 AI 赛道有序轮动到被冷落已久的“枯燥”板块——金融、医疗保健、工业以及非必需/必需消费品。周五盘面上,传统板块全线飘绿,上周的整体趋势也同样清晰地印证了这种结构性迁移。
这种板块腾挪正是牛市健康演进的表现,绝非市场流动性枯竭的大崩盘。Adam Khoo 指出,这印证了他在八月份提出的“反泡沫狂热(anti-bubble mania)”假说:市场不会一直由单一板块推着单边狂奔,资金会分阶段在 AI 与非 AI 之间来回拉扯。这并不意味着 AI 叙事走向终结,AI 革命仍然处在早期阶段;但大机构必须在高位锁定部分利润,将获利资金重新部署到底部趴着的传统板块中,促使落后资产补涨。
- 标普500指数年初至今仍保持 10% 至 11% 左右的稳健涨幅。 - 过去三年市场收益极度集中在半导体与大型科技巨头,传统行业被严重边缘化。 - 市场演化逻辑:“AI 股上涨带动大盘 -> 机构获利了结压制 AI 估值 -> 传统股承接流动性补涨 -> AI 经过估值消化再次启动”,呈现反复交替的台阶式上升。 - Adam Khoo 总结道:“So overall, the market is broadening and it's a good sign. It's a very healthy bull market. Just rotation within the bull market that seems like a bear market if you're purely invested in the AI part of it.”
---
[05:00](https://www.bilibili.com/video/BV1gD4F6WEwP?t=300s) 标普500指数技术支撑位与潜在底部结构
从标普500指数 ETF(SPY)的技术走势图切入观察,相较于个股的“血流成河”,大盘的回调幅度不足 4%,实际上只是一次微不足道的技术性回踩(teeny weeny pullback),连 10% 幅度的常规调整(correction)都算不上。从移动平均线的经典多头排列来看,整个上升通道依然极为完整:红色的 20 EMA 维持在 40 EMA 之上,短线多头结构并未被破坏;蓝色的 50 日均线运行在绿色的 150 日均线之上且斜率持续向上,底部的 200 日简单移动均线同样稳步抬升。虽然近期的价格行为显得极为震荡粘滞,但宏观的上升趋势依然坚挺。
在短线底部的推演上,没人能百分之百精准摸到底部价格,交易者只能依靠历史成交密集区所构成的支撑位做出高胜率的推断:
| 支撑位节点 | 对应点位 / 幅度 | 技术面特征与市场逻辑 | |:--- |:--- |:--- | | **第一支撑位** | 749 点附近(近期摆动低点) | 当前已发生轻微跌破。若能在此形成双底,可能构成典型的空头陷阱(bear trap),随后迅速止跌反弹。 | | **第二核心支撑位** | 716 点(显著波段低点) | 历史需求明显压过供应的强支撑平台。若大盘持续下探至此,从高点累计跌幅约为 8%,仍处于常规波动范围之内。 |
Adam Khoo 明确给出了自己的基准预期:“Now, my guess is that again, I can't tell you when it's going to break the support, but if it does, I don't think we're going lower than 716. Which means I think at the very most we see an 8% correction and we're gonna bottom somewhere here and then hallelujah all the way to the end and to the next year.”
---
[07:19](https://www.bilibili.com/video/BV1gD4F6WEwP?t=439s) 看好中长期市场的五大基石与行业涨跌分化
尽管短期市场充斥着噪音,Adam Khoo 罗列了支撑他对未来数月乃至未来一年维持强烈乐观态度的五大核心理由:
1. **基本面依然过硬**:标普500成分股的底层财务数据与盈利能力极其强劲。 2. **估值重回吸引力区间**:当前大盘的估值水平不仅没有出现全面泡沫化,实际上比今年年初还要更加便宜。 3. **杠杆抛压基本出清**:大量对冲基金在上周大幅砍仓去杠杆,极端的头寸清理意味着做空或砸盘的主力动能已被充分释放。 4. **AI 工业革命处于早期**:当前的人工智能浪潮远未达到类似 2000 年互联网泡沫的失控疯狂,增长跑道依然辽阔。 5. **中期选举的历史牛市规律**:美国中期选举定于 11 月 3 日举行,在统计学上,大选后的 3 个月、6 个月和 12 个月往往是美股周期中最具确定性、表现最强势的上涨窗口。
回顾刚刚过去的 10 月份行业板块表现,更能看清市场内部的再平衡本质:遭遇恐慌抛售的板块仅局限于前期涨幅过大的科技板块(Technology,全月大跌 8.56%)和包含 Alphabet 与 Meta 的通信服务板块(Communication Services,全月重挫 12.25%)。
与此形成鲜明对比的是,防御与传统顺周期板块迎来了澎湃的活水: - 必需/非必需消费防御(Consumer Defensives):逆势大涨 11% - 能源板块(Energy):上涨 10% - 医疗保健(Healthcare):上涨 9% - 公用事业(Utilities):上涨 8% - 房地产(Real Estate):上涨 4% - 周期性板块(Cyclicals):上涨 3.88%
板块表现的两极分化证明了多元化资产配置的重要性。单一押注高位成长股在风向转变时会遭受严重的情绪打击,但对于合理分散投资的投资组合而言,大盘的广度拓展反而是长期稳健盈利的有力保障。
[10:00](https://www.bilibili.com/video/BV1gD4F6WEwP?t=600s) Portfolio Diversification, Sector Rotation, and the CapEx Panic
Adam Khoo examines how proper portfolio allocation shields investors during sudden market drawdowns. While many retail traders experienced steep losses during the October pullback, Khoo notes that his own portfolio remained resilient. Prior to October, his portfolio was up roughly 25% year-to-date; despite pulling back to an 18.7% gain, it continues to outperform the S&P 500's benchmark return of 10% to 11%. He highlights that the broader market is not collapsing, but rather experiencing healthy sector rotation. Investors have been taking profits off the table in high-flying technology names—which remain up 19% year-to-date—and rotating that capital into lagging sectors to broaden market breadth.
Among the sectors absorbing this rotated capital, Healthcare is up 15% (a sector in which Khoo holds a heavy allocation), Consumer Defensives is up 14%, and Materials is up 6%. In contrast, Communication Services has lagged, dragged down by drops in mega-cap holdings like Meta and Alphabet. Khoo emphasizes that he owns both names and is entirely unbothered by their recent price declines. He attributes the sell-off to short-term market panic regarding elevated capital expenditures (CapEx), arguing that this spending is an essential competitive advantage. As Adam Khoo puts it: “The only reason it's gone down is short-term sentiment panic over higher capital expenditures, which to me, it's a good thing because it is growth capex that will lead to even higher revenue and profits in the long run, and lead to the companies becoming even more dominant, and their moats even stronger.”
- **Year-to-Date Sector Returns:** Technology up 19%, Healthcare up 15%, Consumer Defensives up 14%, Materials up 6%. - **Portfolio Comparison:** Khoo's portfolio moderated from +25% YTD to +18.7% YTD, remaining comfortably ahead of the S&P 500 (+10% to 11%). - **CapEx Rationale:** Big tech infrastructure spending is productive "growth CapEx" that widens competitive moats rather than wasteful spending.
---
[11:45](https://www.bilibili.com/video/BV1gD4F6WEwP?t=705s) S&P 500 Valuation and Stock Oracle Intrinsic Value Breakdown
Khoo presents the underlying fundamental data to let investors judge whether the market is truly overvalued or nearing a bubble. Looking at the forward price-to-earnings (P/E) ratio, the S&P 500 currently trades at 18.7 times forward earnings. This multiple sits below its 5-year average of 19.8 times and its 10-year average of 19.1 times. Moreover, it is significantly cheaper than at the beginning of the year, when the index commanded a forward P/E of 22 times.
```mermaid flowchart TD accTitle: S&P 500 Valuation Distribution accDescr: Breakdown of S&P 500 companies based on intrinsic value calculation from Stock Oracle. subgraph MarketBreakdown["S&P 500 Intrinsic Value Profile"] A["Fairly Valued<br>(Within ±10% Intrinsic Value): 27%"] B["Undervalued / Highly Undervalued<br>(Discount to Value): ~31-32%"] C["Overvalued / Highly Overvalued<br>(Premium to Value): ~40%"] end subgraph InvestorStrategy["Actionable Focus"] D["Hunt High-Quality Companies with Wide Economic Moats at Fair or Discounted Prices"] end B --> D A --> D ```
To complement the aggregate forward multiple, Khoo breaks down individual stock valuations across the index using intrinsic value calculations from Stock Oracle. Rather than showing a speculative mania, the distribution demonstrates a balanced market: - **27% of components** are fairly priced, trading within ±10% of their intrinsic value. - **Approximately 31% to 32% of components** are classified as undervalued or deeply undervalued. - **Roughly 40% of components** trade at overvalued or extended levels.
Khoo stresses that smart investors do not flee the entire market because of an overvalued cohort; instead, they selectively hunt for top-tier companies with wide economic moats that are priced at or below their intrinsic value.
---
[13:30](https://www.bilibili.com/video/BV1gD4F6WEwP?t=810s) Fundamental Strength: Q3 Earnings and the Principle That "Price Follows Earnings"
Addressing corporate quarterly earnings, Khoo highlights that reported financial performance has been robust across the board. Even companies enduring sharp pullbacks remain fundamentally solid. He points to Fortinet, a cybersecurity holding in his own portfolio that suffered an abrupt 25% single-day drop; despite the sharp decline, Fortinet remains up roughly 70% year-to-date. When companies like Fortinet, Meta, or Alphabet drop 20% to 30% solely due to narrative swings rather than deteriorating business models, Khoo views it as a prime accumulation opportunity.
Khoo captures his investment philosophy regarding price volatility versus corporate fundamentals: “When the stock price drops because the fundamentals suck, then I get worried, oh shit, right? But if the stock price drops when the fundamentals are very good, I go, who the hell cares? In fact, I take advantage, I add more shares if I don't have a big enough position.”
Turning to aggregate S&P 500 Q3 earnings reports, aggregate earnings growth is clocking in at 30.2%, easily beating the 29% consensus expectation set at the end of September. Looking at the projected 12-month forward earnings per share (EPS), the trend line is climbing steadily upward while index prices have temporarily consolidated sideways. Khoo reiterates the foundational tenet of equity investing: “So remember that in the long run, price follows earnings. It's as simple as that—price follows earnings, right?” Because corporate earnings projections continue to climb while share prices have paused, Khoo argues there is substantial upside room for market prices to catch up.
---
[15:35](https://www.bilibili.com/video/BV1gD4F6WEwP?t=935s) Broadening Market Breadth and Tangible AI Productivity Gains
A common criticism earlier in the year was that market gains were dangerously concentrated in the "Magnificent Seven" mega-cap tech giants. Earlier in the cycle, the Magnificent Seven generated 33% earnings growth compared to 27% for the remaining 493 companies in the S&P 500. However, Khoo shows that the current earnings season demonstrates a healthy broadening of earnings momentum across the rest of the market: - **Magnificent Seven Earnings Growth:** 22% (still solid, though moderated). - **Remaining S&P Companies:** 32% earnings growth, powered by industrials, financials, and cyclical sectors.
Khoo addresses the skepticism surrounding whether artificial intelligence is genuinely delivering operational improvements or remaining mere marketing hype. He points directly to the corporate net profit margin trajectory of the S&P 500, which has expanded to 17%—a notable rise from 2024 levels. This margin expansion serves as empirical proof that AI integration and automation are delivering genuine cost efficiencies and operational productivity across corporate America, establishing durable fundamental support for ongoing profit growth.
---
[17:25](https://www.bilibili.com/video/BV1gD4F6WEwP?t=1045s) Massive Hedge Fund De-Grossing Signals a Typical Market Bottom
Beyond valuation and earnings, Khoo turns to market positioning and technical mechanics, explaining why he refuses to take a bearish stance. He points out that 2024 has been one of the worst-performing years for institutional hedge funds. Many fund managers crowded aggressively into speculative, overvalued AI-adjacent stocks (such as SanDisk and Micron). When those momentum names collapsed by as much as 50% from their peaks, institutional funds faced severe drawdowns and were forced into emergency loss-cutting.
This forced liquidation mechanism—known on Wall Street as "de-grossing"—saw hedge funds slash both long and short exposure simultaneously at the fastest rate in a decade. While the broader S&P 500 only fell around 3% during the move, hedge fund positions suffered a massive de-grossing of -7.8%.
| Historical De-Grossing Event | Magnitude of Position Cut | S&P 500 Market Behavior | |:--- |:--- |:--- | | Historical Instance 1 | -5.9% | Coincided with S&P 500 market bottom | | Historical Instance 2 | -7.1% | Coincided with S&P 500 market bottom | | Historical Instance 3 | -6.1% | Marked a major intermediate market low | | Historical Instance 4 | -5.8% | Coincided with market low / dip | | Historical Instance 5 | -5.9% | Coincided with a distinct technical low | | Historical Instance 6 | -6.6% | Marked the bottom of the sell-off | | **Current Event** | **-7.8%** | **Fastest liquidation rate in 10 years; near-bottom indicator** |
Khoo observes that every historical episode where hedge fund de-grossing exceeded 5% coincided almost precisely with major swing lows or cycle bottoms on the S&P 500. When institutional funds panic-sell at scale to cover margin calls and preserve capital, forced selling becomes exhausted. With institutional desks running out of shares to dump, selling pressure abruptly dries up, leaving the broader index primed for a rapid rebound.
[20:00](https://www.bilibili.com/video/BV1gD4F6WEwP?t=1200s) Hedge Fund Degrossing as a Bottom Signal and Option Trading Discipline
When hedge funds aggressively dump equities, selling reaches an exhaustive extreme where sellers simply run out of shares to liquidate. Once that capitulation happens and selling dries up, the market becomes unlikely to push substantially lower, and even modest incremental buying can trigger a sharp move higher. However, Adam Khoo cautions traders against reckless complacency: “Because one thing I learned about being in the markets for close to 30 years is that anything can happen.” Traders must never interpret a probable bottom as a license to go “all-in” or buy straight directional call options. Prudent trading demands waiting for price action to produce a confirming candlestick pattern, executing strictly with a stop-loss, and risking only a small percentage of total account capital. Entering without a stop-loss or going all-in risks account wipeout on an unexpected breakdown, whereas disciplined stops ensure you merely walk away with a minor scratch.
Khoo strongly warns retail investors against purchasing straight call options or Long-term Equity Anticipation Securities (LEAPS) when taking a bullish posture. Even if an investor correctly forecasts market direction, theta decay (time decay) and implied volatility crush often erode the option's value to zero. He highlights a recent interview with industry veteran Tom Sosnoff to reinforce this foundational trading philosophy: “Thomas Sosnoff, who is the legendary creator of thinkorswim and tastytrade, he just did an interview, he said, 'I have not bought a call option in 25 years.'” Backing up this mindset shared by his colleague Bang and himself, Khoo explains that professional options traders leverage structures with positive or neutral theta and defined risk, such as bullish synthetic spread strategies, selling cash-secured puts, or selling credit spreads.
Looking at historical data, instances where hedge fund degrossing exceeded 5% consistently coincided with weekly S&P 500 lows. In every recorded case from the historical dataset, the market rebounded strongly: - **1 Month Later:** S&P 500 delivered positive gains across all recorded events (+8%, +6%, +7%, +3%). - **3 Months & 6 Months Later:** 100% of occurrences showed positive market returns (a 6-out-of-6 track record in the historical sample).
---
[22:25](https://www.bilibili.com/video/BV1gD4F6WEwP?t=1345s) Historical Post-Midterm Election Rallies and Seasonality
Examining the quadrennial US midterm election cycle reveals an exceptionally reliable seasonal pattern favoring bulls. Ahead of election day on November 3, equity markets typically experience a pronounced pre-election correction through October and early November. Once political uncertainty resolves, markets historically launch into a sustained relief rally regardless of which political party triumphs. While betting markets place the probability of Democrats sweeping both the House of Representatives and the Senate at approximately 72%, market history indicates that post-midterm rallies occur irrespective of the specific political configuration in Washington.
Reviewing historical midterm election cycles from November onward highlights remarkable upside consistency: - **3-Month Performance (November to January):** 95% win rate, generating an average market return of +8.1% (with 2018 being the sole negative outlier). - **6-Month Performance:** 100% win rate across the sample, delivering an average gain of +16.4%. - **12-Month Performance:** 100% win rate, achieving an average gain of +22.0%.
Addressing the lingering fear of another 2018-style breakdown, Khoo emphasizes that while markets offer no guarantees, historical probabilities heavily favor investors: “Again, no guarantees is going to happen this time. It could be another 2018. Let's hope not. But again, the odds are in our favor regardless of who wins the elections.” Typical seasonality patterns show equities bottoming around late October to early November, rallying strongly into year-end, absorbing a minor pullback in December, and ultimately finishing substantially higher than pre-election levels.
---
[25:00](https://www.bilibili.com/video/BV1gD4F6WEwP?t=1500s) AI Boom vs. Dot-Com Boom: Duration and Valuation Realities
With prominent AI-related leaders pulling back anywhere from 20% to 50%, mainstream skeptics have begun proclaiming the demise of the artificial intelligence trade. Adam Khoo firmly rejects this narrative based on two core metrics: structural duration and underlying equity valuation. Drawing on his firsthand experience investing through the late 1990s tech run-up in his early twenties, Khoo contrasts the current AI cycle against the dot-com bubble.
| Metric | Dot-Com Bubble (1994–2000) | Current AI Boom (2022–Present) | Remaining Room / Contrast | |:--- |:--- |:--- |:--- | | **Duration** | 5.3 years | 3.9 years | At least 1.4 years of upside duration remaining | | **Nasdaq 100 Total Return** | +1,000% cumulative gain | +137% cumulative gain | AI run is only ~13% of the dot-com rally magnitude | | **Index Multiples** | Speculative mania, extreme multiples | Moderate valuations; robust earnings backing | S&P 500 and Nasdaq constituents remain reasonable or cheap |
The current AI cycle effectively began with the public emergence of ChatGPT in late 2022, placing the expansion at approximately 3.9 years. If the AI trend matches the 5.3-year lifespan of the dot-com era, the secular bull cycle has at least 1.4 years left to unfold. In terms of price velocity, the Nasdaq gained a staggering 1,000% during the dot-com boom, whereas it has gained only 137% in the present AI cycle—representing roughly 13% of the dot-com bubble's overall magnitude. Furthermore, unlike the profitless dot-com companies trading at astronomical valuations before the bubble burst, contemporary S&P 500 and Nasdaq technology leaders generate massive free cash flow and trade at reasonable valuations. Khoo summarizes this disparity: “So we are nowhere near where the dot-com boom went, right? And the dot-com boom at the time before it burst here, the markets were trading at crazy multiples. It was extremely overvalued. But if you look at the companies that make up the S&P or even the NASDAQ today, they are not expensive.”
---
[27:35](https://www.bilibili.com/video/BV1gD4F6WEwP?t=1655s) Nvidia vs. Cisco: Valuation Multiples and Upside Room
Critics frequently draw a direct parallel between Nvidia and Cisco Systems, noting that Cisco served as the quintessential hardware infrastructure poster child of the internet boom before its stock collapsed by roughly 90%. Khoo dismantles this analogy by contrasting the historical timeline, cumulative price expansion, and fundamental price-to-earnings ratios of both companies.
```mermaid flowchart TD accTitle: Cisco Dot-Com Bubble vs Nvidia AI Boom accDescr: Diagram contrasting Cisco peak gain and valuation with Nvidia current gain and forward valuation. subgraph Cisco["Cisco Systems (1990s Peak)"] C1["3.9-Year Mark: Up +700%"] --> C2["Cycle Peak: Up +4,200%"] C2 --> C3["Peak Forward P/E: 131x"] end subgraph Nvidia["Nvidia (Current AI Cycle)"] N1["3.9-Year Mark: Up +1,000%"] --> N2["Potential Upside Room: Substantial"] N2 --> N3["Current Forward P/E: 17x"] end ```
At the 3.9-year mark of their respective runs, Cisco was up roughly 700%, while Nvidia has climbed approximately 1,000%. However, Cisco went on to peak at a monumental 4,200% total advance from its cycle base. If Nvidia were to match a comparable trajectory, the stock would possess room for another 4x advance.
The most dramatic contrast lies in fundamental valuation. At its speculative apex before crashing, Cisco traded at an eye-watering forward price-to-earnings ratio of 131x. By contrast, Nvidia's forward P/E ratio sits at roughly 17x. Underscoring the extreme divergence in real business earnings, Khoo notes: “The forward PE ratio of Cisco was 131 times PE. It was freaking insane. 131 times more PE. Okay, Nvidia's forward PE today is only 17 times! So, Nvidia is actually bloody cheap, if you compare it to Cisco.” Because Nvidia is supported by real cash earnings rather than speculative vaporware, current market pricing remains far removed from bubble territory.
---
[29:55](https://www.bilibili.com/video/BV1gD4F6WEwP?t=1795s) Black Market X 10th Anniversary and Final Resources
Khoo wraps up the presentation by inviting viewers to join Piranha Profits for the upcoming **Black Market X** live event scheduled for November. Marking the firm's 10th anniversary (with the Roman numeral "X" signifying ten years), the free webinar series will focus on actionable options strategies, portfolio protection techniques, and systemic trading methods used to outperform the broader market over the past decade.
He urges viewers to subscribe to the channel, click the notification bell to stay updated as event details are finalized, and explore structured educational offerings through official platforms: - **Piranha Profits (`piranhaprofits.com`):** Comprehensive online training curriculums covering global investing, options income generation, and technical market trading. - **Wealth Academy Global (`wealthacademyglobal.com`):** Flagship live interactive mentoring programs for serious traders and long-term equity investors.
He closes his analysis with his signature parting blessing to his audience: “This is Adam Khoo and may the markets be with you.”
## Notable quotes > [13:30](https://www.bilibili.com/video/BV1gD4F6WEwP?t=810s) So remember that in the long run, price follows earnings. It's as simple as that—price follows earnings, right? — Adam Khoo
> [27:35](https://www.bilibili.com/video/BV1gD4F6WEwP?t=1655s) The forward PE ratio of Cisco was 131 times PE. It was freaking insane. 131 times more PE. Okay, Nvidia's forward PE today is only 17 times! So, Nvidia is actually bloody cheap, if you compare it to Cisco. — Adam Khoo
## Mentioned Adam Khoo, Tom Sosnoff, Bang, 标普500指数, SPY, 纳斯达克指数, QQQ, 英伟达, AMD, 英特尔, 美光科技, 闪迪, 亚马逊, Alphabet, Meta, Fortinet, 思科, ChatGPT, Stock Oracle, thinkorswim, tastytrade, Piranha Profits, Wealth Academy Global, Black Market X
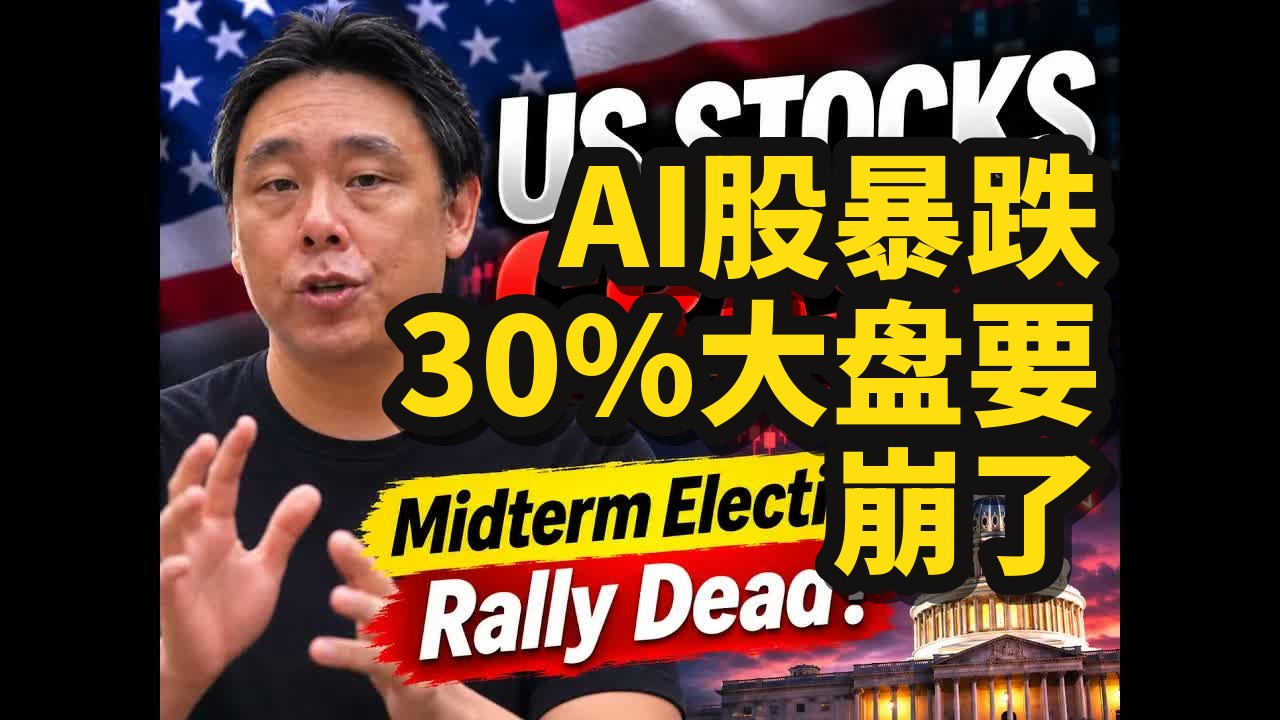
## Video description 【Adam Khoo】 AI股暴跌30%是崩盘信号?别慌,大盘没你想的那么糟! US Stocks Crash? Midterm Election Rally Dead?
|AI股大跌,但大盘稳健 最近很多散户觉得市场要崩盘了,因为英伟达、AMD、英特尔等AI相关股票跌幅很大,比如英特尔一天跌了28%,Sandisk从高点跌了50%,美光跌了30%。但如果看标普500指数,它只跌了3%左右。这是因为资金从AI股流出,转入了金融、医疗、工业和非必需消费品等“无聊”板块,这些板块反而上涨了。这其实是市场内部的健康轮动,不是整体崩盘。
|市场估值合理,盈利强劲 标普500指数目前的预期市盈率是18.7倍,低于过去5年19.8倍和10年19.1倍的平均水平,甚至比今年年初的22倍还要便宜。这说明市场整体并不贵,甚至可以说被低估了。从公司盈利来看,第三季度财报季,标普500公司整体盈利增长了30.2%,超出预期的29%。而且,盈利增长的覆盖面正在扩大,不再只集中在“七巨头”,有32%的盈利增长来自工业、金融等非“七巨头”公司,这表明牛市基础更扎实。
|对冲基金抛售,市场接近底部 上周对冲基金出现了近10年来最大规模的抛售,跌幅达到7.8%。历史上,当对冲基金大幅减仓(跌幅超过5%)时,往往预示着市场接近底部。因为他们已经卖无可卖,市场下跌动能减弱。虽然不能保证现在就是最低点,但大概率离底部不远了。过去这些情况发生后,市场在一个月内平均上涨8%,三个月和六个月后也都是正收益。
|中期选举后,市场大概率上涨 美国中期选举将在11月3日举行。历史数据显示,中期选举后的3个月、6个月和12个月,市场表现都非常强劲。过去95%的案例中,3个月平均回报率为8.1%;6个月和12个月更是100%上涨,平均回报率分别达到16.4%和22%。虽然历史不代表未来,但这种规律性给了我们看好市场的理由。
|AI热潮远未结束 很多人担心AI热潮是不是要结束了,但对比2000年的互联网泡沫,现在的AI热潮才刚刚开始。互联网泡沫持续了5.3年,纳斯达克指数累计上涨了1000%。而AI热潮目前才持续了3.9年,纳斯达克指数上涨了137%。如果AI热潮能持续和互联网泡沫一样长,甚至更久,那还有至少1.4年的上涨空间。而且,现在AI公司的估值远低于当年互联网泡沫时期的疯狂水平。比如英伟达目前的预期市盈率是17倍,而当年思科在泡沫破裂前高达131倍。这说明AI板块还有很大的增长潜力。
接下来建议的操作指引: 1. 关注标普500指数(SPY)在716点附近的支撑位,如果跌到这里,可能是短期底部,可考虑分批建仓。 2. 鉴于对冲基金大幅减仓,市场短期内可能反弹,可关注非AI板块(如金融、医疗、工业)的轮动机会。 3. 中期选举后市场上涨概率高,可关注大盘ETF(如SPY、QQQ)在11月3日之后的表现。
[0:13] AI股大跌,但大盘未崩 [1:14] 资金轮动,市场健康发展 [3:15] 市场整体上涨,AI与非AI轮动 [4:15] 标普500指数技术面仍处上升趋势 [6:18] 市场支撑位与潜在底部预测 [7:19] 看好市场的五大理由 [9:20] 科技股回调,其他板块补涨 [11:22] 市场估值合理,盈利超预期 [13:24] 公司基本面强劲,股价下跌是买入机会 [15:25] 盈利增长覆盖面扩大,牛市基础扎实 [17:38] 对冲基金大幅减仓,市场接近底部 [20:40] 交易策略建议:控制风险,不买看涨期权 [22:42] 中期选举后市场上涨的历史规律 [24:43] AI热潮与互联网泡沫对比,AI仍有巨大潜力 [27:49] 英伟达与思科对比,估值仍低,增长空间大
[Source](https://www.bilibili.com/video/BV1gD4F6WEwP)