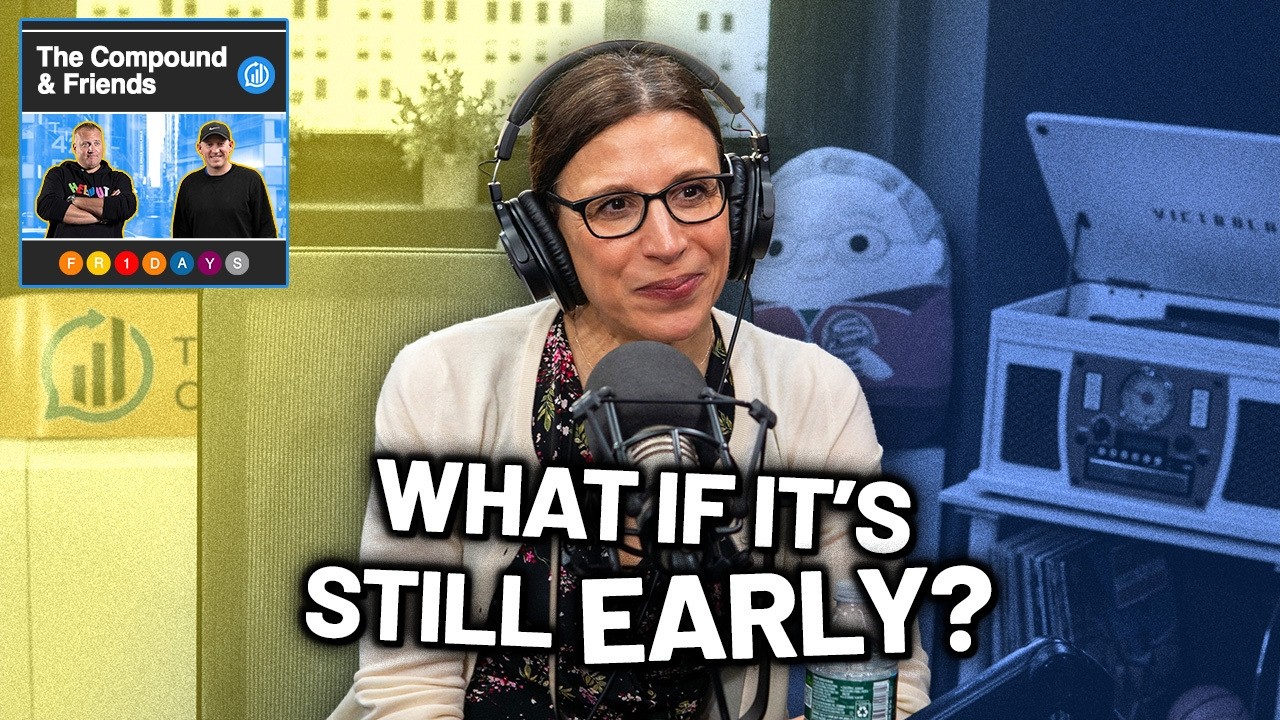
Fidelity's Chisholm Says Corporate Earnings Expansion Broadens Beyond Big Tech
The Compound
Accelerating profit growth in the S&P 493 and low unit labor costs signal the current stock market rally remains in its early stages rather than a dot-com bubble.
## Background
This episode was published on YouTube by The Compound on May 29, 2026. Hosted by Michael Batnick and Downtown Josh Brown, episode 244 of The Compound and Friends features guest Denise Chisholm, Director of Quantitative Market Strategy at Fidelity Investments, to discuss whether AI capital expenditure is in a bubble, why stocks continue to rise despite market skepticism, and how earnings growth is expanding beyond the Magnificent 7.
## TL;DR
Fidelity's Denise Chisholm presents a quantitative case that the stock market remains fundamentally sound and far from a speculative bubble, noting that aggregate corporate CapEx remains below 1x free cash flow compared to 3.5x–4x during the 2000 dot-com peak. The group examines the parabolic rise in semiconductor stocks, explaining how extreme gains in names like Micron are backed by historic earnings growth rather than purely mindless speculation. Additionally, the discussion highlights the cyclical recovery taking shape in the "S&P 493," demonstrating how profit margins, small-cap earnings, and manufacturing indicators are inflecting higher while inflation concerns and Fed rate expectations remain manageable.
## Atmosphere & style
The episode blends high-energy financial debate with casual, quick-witted banter, moving smoothly from playful rants about restaurant checkout tech to deep quantitative market research. The dynamic between Michael, Josh, and Denise feels like an engaging, sharp conversation between industry veterans who balance skepticism with rigorous data analysis. The tone is pragmatic, grounded, and optimistic, demystifying market fears and macro headlines through historical context and cool-headed quantitative perspective.
## Key takeaways
- [03:34](https://www.youtube.com/watch?v=LgmzAXMBbu4&t=214s) Anthropic raised a Series H funding round of $65 billion at a $965 billion post-money valuation, backed by a massive coalition of top-tier institutional investors.
- [07:39](https://www.youtube.com/watch?v=LgmzAXMBbu4&t=459s) Goldman Sachs raised its S&P 500 year-end price target to 8,000 based on strong AI-driven earnings growth, projecting 24% growth in the current year.
- [07:39](https://www.youtube.com/watch?v=LgmzAXMBbu4&t=459s) Unlike the dot-com bubble peak when corporate CapEx reached 3.5x to 4x free cash flow, current corporate CapEx remains comfortably under 1x free cash flow.
- [15:09](https://www.youtube.com/watch?v=LgmzAXMBbu4&t=909s) Quantitative historical research shows that periods of higher economic and political uncertainty actually correlate with higher odds of stock market advances.
- [18:05](https://www.youtube.com/watch?v=LgmzAXMBbu4&t=1085s) Market valuation alone has no meaningful quartile difference in predicting future 12-month stock market advances or declines.
- [22:25](https://www.youtube.com/watch?v=LgmzAXMBbu4&t=1345s) Major tech companies are transforming into heavy infrastructure builders akin to modern industrials, yet they continue to maintain historically high profit margins.
- [22:25](https://www.youtube.com/watch?v=LgmzAXMBbu4&t=1345s) Meta's massive investment in AI recommendation engines boosted Instagram Reels to $50 billion in annualized revenue, exceeding Netflix's total top line.
- [26:25](https://www.youtube.com/watch?v=LgmzAXMBbu4&t=1585s) The PHLX Semiconductor Index reached 69% above its 200-day moving average, a extreme dynamic driven by fundamentals rather than pure speculative bubble dynamics.
- [26:25](https://www.youtube.com/watch?v=LgmzAXMBbu4&t=1585s) Historically, when an industry group surges 70% to 100% in a single year, it goes on to outperform the broader market the following year 65% of the time.
- [33:06](https://www.youtube.com/watch?v=LgmzAXMBbu4&t=1986s) Unlike the 1990s tech bubble where median tech stock earnings peaked four years before the crash, today's tech sector displays robust earnings and expanding margins.
- [37:45](https://www.youtube.com/watch?v=LgmzAXMBbu4&t=2265s) Unit labor costs adjusted for productivity sit in the bottom quartile of historical data, serving as the primary driver behind record corporate profit margins.
- [41:48](https://www.youtube.com/watch?v=LgmzAXMBbu4&t=2508s) The market rally is broadening: the S&P 500 excluding the Magnificent 7 is up 10.25% YTD, outperforming the Mag 7's 6.6% return.
- [44:03](https://www.youtube.com/watch?v=LgmzAXMBbu4&t=2643s) An inflection in the ISM New Orders index signals the early stages of a manufacturing recovery that favors small-cap earnings acceleration.
- [45:52](https://www.youtube.com/watch?v=LgmzAXMBbu4&t=2752s) Stock market performance peaks when inflation sits in the 3% to 4% range, where equities act as an effective inflation hedge driven by underlying earnings growth.
- [48:38](https://www.youtube.com/watch?v=LgmzAXMBbu4&t=2918s) Oil price spikes historically act as a consumer tax rather than core inflation, making the Federal Reserve less likely to hike rates following an oil shock.
- [55:33](https://www.youtube.com/watch?v=LgmzAXMBbu4&t=3333s) Upcoming mega-IPOs from SpaceX, OpenAI, and Anthropic could collectively absorb ~$170 billion in capital, potentially creating short-term liquidity friction.
- [58:12](https://www.youtube.com/watch?v=LgmzAXMBbu4&t=3492s) High-beta speculative tech has lagged broader technology on a relative basis by ~75% since the late 1990s, indicating high quality is driving the current bull market.
## Detailed walkthrough
### [00:00](https://www.youtube.com/watch?v=LgmzAXMBbu4&t=0s) Octopus Intelligence and Restaurant Pet Peeves
The episode kicks off with casual banter as Downtown Josh Brown and Michael Batnick chat about a Neil deGrasse Tyson clip regarding octopuses. Josh notes how alien-like octopuses are—possessing nine hearts, multiple brains, regenerative limbs, and tentacles that can taste and smell. Michael admits that while he eats calamari and squid, he avoids eating octopus after watching a documentary on their intelligence. Josh laments that at Mediterranean restaurants like Kyma, everyone orders grilled octopus, leaving him conflicted.
Josh then pivots to a personal pet peeve: his complete lack of patience with the traditional check-settling process at restaurants. He describes the agonizingly slow "routine" of flagging down a server, waiting for the bill, waiting for them to pick up the credit card, watching them disappear to a terminal near the kitchen, and finally returning to sign the tip. Josh praises Toast point-of-sale systems for letting him pay immediately at the table and leave on his own terms. Michael jokingly diagnoses him with "Early Onset Grumpiness" (EOG), referencing a Classic *Saturday Night Live* sketch, while guest Denise Chisholm and the crew playfully suggest he just stay home or order Uber Eats.
* Octopuses feature nine hearts and decentralized brains, with tentacles capable of sensory perception.
* Josh Brown owns shares of Toast stock and advocates for instant pay-at-the-table technology.
[03:34](https://www.youtube.com/watch?v=LgmzAXMBbu4&t=214s) Anthropic’s Massive Funding Round and Mega-IPOs
The hosts transition to breaking financial news: Anthropic's Series H funding round. Josh reads through the staggering numbers and the laundry list of institutional backers leading and participating in the deal. The sheer scale of capital being raised signals a massive wave of private AI market activity that could spill into the public domain.
Josh compares the massive list of mega-investors to "the last Avengers" assembling, noting that an incredible amount of capital is required to support the massive private valuations and upcoming public offerings. The consensus is that Wall Street needs every major institutional player to step up as multi-trillion-dollar IPO windows begin to take shape.
* **Anthropic Series H Details:** Raising **$65 billion** at a **$965 billion** post-money valuation.
* **Lead Investors:** Altimeter Capital, Dragoneer, Greenoaks, and Sequoia.
* **Key Institutional Participants:** Capital Group, Coatue, D1 Capital Partners, GIC, Iconiq, Accel, Baillie Gifford, Blackstone, Brookfield, D.E. Shaw, DST Global, Fidelity Management & Research, General Catalyst, Insight Partners, Jane Street, and Lightspeed.
[05:07](https://www.youtube.com/watch?v=LgmzAXMBbu4&t=307s) Show Intro and Guest Welcome
Following a sponsor message from Franklin Templeton highlighting municipal bonds, Josh formally opens the show and introduces the guest, Denise Chisholm, Director of Quantitative Market Strategy within the Quantitative Research and Investments division at Fidelity Investments. Denise joined Fidelity in 1999, and her quantitative research informs approximately 150 portfolio managers overseeing more than 450 mutual funds and ETFs.
[07:39](https://www.youtube.com/watch?v=LgmzAXMBbu4&t=459s) S&P 8000? AI Earnings, Price Targets & The Bull Case
Josh jumps straight into the market discussion by asking Denise for a year-end target on the S&P 500, which she declines to give as a specific spot estimate while remaining generally constructive. The conversation turns to Goldman Sachs raising its S&P 500 price target from 7,600 to **8,000**, driven by strong earnings growth in the wake of AI infrastructure investments. Goldman projects **24% year-over-year earnings growth** for the current year and 13% for 2027.
Goldman's thesis argues that while AI capital expenditures are fueling massive earnings growth, valuation multiples remain grounded due to ongoing uncertainty surrounding the macroeconomic outlook and AI's long-term deployment. Denise agrees with this assessment, pointing out that earnings and CapEx recoveries are broadening beyond just a few tech giants to encompass the broader market.
Denise provides historical context on corporate spending:
1. **Post-GFC Buyback Era:** After the 2008 financial crisis, investors complained that corporate earnings growth was "fake" because it was fueled by stock buybacks and dividends rather than capital investment.
2. **Current CapEx Acceleration:** CapEx-to-sales ratios are accelerating across all 11 GICS sectors.
3. **Bubble vs. Growth Reality:** At the peak of the dot-com bubble in 2000, aggregate corporate CapEx was **3.5x to 4x free cash flow**. Today, aggregate corporate CapEx remains **under 1x free cash flow**.
> "At the peak of the bubble in 2000, corporate America in aggregate was spending three and a half to four times their free cash flow at the time. We are still under one in terms of free cash flow."
Denise emphasizes that while six or seven mega-cap tech hyperscalers are spending aggressively, the spending is not systemically overextended relative to free cash flow across the aggregate technology sector or the broader S&P 500.
[11:38](https://www.youtube.com/watch?v=LgmzAXMBbu4&t=698s) The Psychology of CapEx Waves and Market Skepticism
Josh and Denise explore why investors reflexively assume any surge in capital expenditure must be a speculative bubble destined to pop. Denise attributes this to recency bias, as the last major CapEx boom that investors vividly remember was the 1990s tech bubble, which ended in a market crash. In reality, most historical CapEx cycles create a virtuous economic circle by boosting job creation, GDP growth, and long-term corporate productivity.
Josh recalls how critics previously condemned companies for relying on float shrink and share buybacks instead of investing in R&D or CapEx. Yet, now that corporate America has shifted toward heavy CapEx spending, those same critics claim the spending is reckless. Denise notes that skepticism often stems from a misconception of how the stock market functions: investors want the market to reflect smooth, clear, and obvious "good times," whereas equities frequently serve as a forward-looking hedge or discount mechanism ahead of fundamental shifts.
Here is a detailed, faithful walkthrough of the provided transcript section.
---
[15:09](https://www.youtube.com/watch?v=LgmzAXMBbu4&t=909s) The Mental Struggle of Equity Investing & The Uncertainty Paradox
Michael Batnick and Denise Chisholm dive into the core psychological challenge that investors face when looking at long-term stock market returns. When studying financial history, it is easy to become hyper-aware of every headline risk and macro problem that could go wrong. The real downside risk, however, is asking: *"Well, what if they don't go wrong in the way that you think that they will?"*. By sitting on the sidelines out of fear, investors surrender average market returns of 8% a year—one of the rare asset classes capable of keeping pace with inflation over time.
The conversation pivots to how political biases skew market perceptions. Josh Brown notes that investors who disagree with the current White House administration or cultural trends often suffer from cognitive dissonance when watching stocks hit new highs. They struggle to process how the market can rise when they personally feel so negatively about the country's direction. Chisholm explains that this human emotional trap is precisely why quantitative analysis is essential. For instance, intuition suggests that low consumer confidence is a bad sign, yet historically, buying equities during periods of depressed consumer confidence yields far better results than buying when confidence is high.
Chisholm breaks down her quantitative research on economic "uncertainty"—specifically addressing concerns around tariffs and corporate spending. Diversified portfolio managers frequently express concern that corporate America will freeze spending and halt hiring during uncertain times. However, when quartiling uncertainty historically, Chisholm found the exact opposite: higher uncertainty actually correlates with higher odds of stock market advances and increased capital spending. By the time a threat becomes plastered across magazine covers, it has already been discounted by the market.
To highlight how costly it is to time the market based on macro fears, Chisholm points to the market cycle between 1976 and 1985:
* The actual market bottom occurred in 1978—*before* two back-to-back recessions hit and before interest rates spiked to 15%.
* An investor who correctly foresaw those terrible economic conditions, sold out in 1978, and waited to buy back at the end of 1982 when job growth finally recovered lost **40% in cumulative nominal returns** by missing the rally.
---
[18:05](https://www.youtube.com/watch?v=LgmzAXMBbu4&t=1085s) Valuation Compression: Why Persistent Fear Drives the Bull Market
The group discusses the market dynamics seen earlier in the year when geopolitical shocks—such as fears surrounding the closure of the Strait of Hormuz—failed to derail stocks. While commentators braced for a "black swan" event with crude oil spiking to $150 a barrel and the S&P 500 hitting limit-down circuit breakers, the market essentially yawned. During this window, earnings estimates rose rapidly while stock prices remained flat or dipped slightly, creating a dramatic valuation compression over a 6-month period.
Chisholm explains why she maintained a bullish outlook despite institutional pushback regarding high market valuations and a strong multi-year run:
* Quantitatively, strong multi-year performance (momentum) historically leads to continued outperformance. Taking the short side of a rising market requires accepting lower-probability odds.
* Valuation alone has no meaningful quartile difference in predicting whether the equity market will advance or decline.
* Since 2022, the stock market has exhibited persistent fear. During the "tariff tantrum," the VIX spiked to 50, while the more recent market pullback saw the VIX jump to 30.
* Comparing persistent equity market fear against credit market indicators reveals a linear relationship showing that the market is primed to continue "climbing the wall of worry".
Josh points out that even brief 2% pullbacks in the S&P 500 trigger immediate spikes in the put-call ratio, proving that the market is far from a euphoric bubble. Chisholm notes that it would take a staggering 70% market rally to outrun 29% earnings growth and trigger true, dangerous multiple expansion. Batnick and Chisholm agree that outside of a few side-show speculative pockets, the aggregate market is behaving remarkably soberly relative to its underlying earnings growth.
---
[22:25](https://www.youtube.com/watch?v=LgmzAXMBbu4&t=1345s) Are Big Tech Stocks Becoming "Modern Industrials"?
The hosts review a chart tracking the forward P/E ratio of the technology sector relative to the broader S&P 500. Earlier in the year, tech multiples converged with the S&P 500, offering a massive "fat pitch" for investors to buy high-growth tech leaders at general market valuations. In the 38-day period following that convergence, technology dramatically outperformed the broader index, generating an 18% relative performance spread.
Batnick raises a structural argument about why tech stock valuations have compressed: these companies are undergoing a fundamental business model transformation. They are transitioning from capital-light, software-dominated businesses with ultra-high margins and minimal capex into heavy infrastructure builders pouring over 100% of their cash flows into long-term physical projects. With the exception of Apple, whose capex remains lower year-over-year, major tech giants are conducting a massive capex expansion that makes them resemble "modern industrials" rather than traditional software companies.
Chisholm responds that whether tech multiples deserve to permanently shrink depends on their ultimate long-term margin structure:
* Despite aggressive capex spending, these companies have maintained historically high margins and returns on capital so far.
* Historically, technology makes expensive, scarce resources cheap and abundant over time, which may ultimately prevent capex from permanently depressing free cash flow.
* Unlike the 2000 tech bubble—where massive corporate spending was completely disconnected from underlying earnings and funded by equity issuance—today's capex binge is directly backed by massive corporate cash flows.
Josh highlights Meta as a primary example of AI capex generating real monetary returns. Meta's investment in AI recommendation engines transformed Instagram Reels into a product generating $50 billion in annualized revenue—surpassing Netflix's total revenue. Josh quips that Reels has become *"literal heroin"* and *"the world's most addictive product,"* capturing the attention of eight out of ten people walking through airport terminals and enabling Meta to dramatically improve its ad-targeting capabilities.
---
[26:25](https://www.youtube.com/watch?v=LgmzAXMBbu4&t=1585s) Semiconductors Go Parabolic: Bubble or Earnings-Driven Momentum?
The conversation shifts to the semiconductor sector, which Batnick notes is the one area where skeptics question whether the market is truly being sober.
* The PHLX Semiconductor Index (SOX) reached **69% above its 200-day moving average**, a extreme dynamic unseen in at least the last 25 years.
* Micron Technology recently joined the trillion-dollar market cap club as the 11th company to reach that benchmark.
* UBS drastically raised its price target on Micron from **$535 to $1,625**—more than doubling its previous target relative to its recent closing price of $751.
Josh admits these skyrocketing memory and semiconductor valuations give market veterans uncomfortable nostalgic vibes, bringing back memories of the dot-com bubble era with companies like Cisco, Lucent, and JDS Uniphase 25 years ago.
Chisholm analyzes historical market data across all industry groups dating back to the 1960s to contextualize the semiconductor surge:
* Over the past year, semiconductors are up roughly 100%—a massive move, but one that is **exactly in line with their underlying earnings growth**.
* Historically, when semiconductors have surged 100% in a single year, they go on to outperform the market again over the following year **55% of the time**.
* Across *all* stock market industries since the 1960s, a 70% to 100% 12-month gain occurs only 2% of the time. Yet, when it happens, those industry groups go on to outperform the broader market the following year **65% of the time**.
Rather than representing a mindless speculative mania, Chisholm points out that these extreme moves reflect rational behavior by investors responding to an extraordinary earnings growth anomaly.
---
<FollowUp label="Want to go deeper into the S&P 493 vs. Mag 7 earnings comparison?" query="Walk me through the data on the S&P 493 versus the Magnificent 7 earnings growth from the transcript."/>
Here is a detailed, faithful walkthrough of Part 3 of the episode.
---
[29:28](https://www.youtube.com/watch?v=LgmzAXMBbu4&t=1768s) The Semiconductor Anomaly & The Parabolic Rise of Micron
Michael Batnick and Josh Brown dive into the staggering run of semiconductor stocks, highlighting that earnings growth in the industry has outpaced expectations for over two years. Michael emphasizes how unusual this is historically; semiconductors have traditionally been a cyclical roller-coaster, never compounding earnings at a 50%+ rate for this long without massive drawdowns in between. Josh notes that average investors focus on the price charts, referencing a *Wall Street Journal* graphic about how quickly companies are hitting market cap milestones. Pointing to Micron in particular, Michael highlights its meteoric rise: a year ago, it wasn't even a $100 billion company and sat as the 127th largest stock in the S&P 500. Today, it has surged to number 11 (and was number 381 just ten years ago).
Josh shares an anecdote about warning a friend who has made a lot of money holding Micron to set a "sober exit plan" while the stock climbs 5% a day. He warns that when momentum breaks, it drops fast—demonstrated by a recent post-earnings 30% pullback. When his friend argued that Micron is sold out of capacity for a year and asked if it is still a cyclical business, Josh said yes. Denise Chisholm jumps in to clarify the mechanics of cyclical stocks: when a cyclical business looks cheap, the market is often pricing in a peak in earnings. However, Denise points out that over the past decade, there is a clear linear relationship in semiconductors where lower starting valuations (the bottom quartile of valuation) historically translate to a 70% probability of outperforming over the next 12 months. She suggests the underlying business model and cycle length may be expanding from 3 years to 7 years, meaning the price might be signaling a shift that investors don't yet fully grasp.
- **Micron's S&P 500 Rank Trajectory:** Ranked #381 ten years ago, #127 one year ago (under $100B market cap), up to #11 today.
- **Stock Volatility Example:** Micron experienced a 30% drop following its recent earnings report.
- **Historical Outperformance Odds:** Semiconductor valuations in the bottom quartile have historically carried a 70% chance of outperforming the broader market over the following 12 months.
---
[33:06](https://www.youtube.com/watch?v=LgmzAXMBbu4&t=1986s) Dot-Com Comparisons: Nvidia, Micron, and the Fiber Optic Analog
Josh pivots to how commentators compare today's AI buildout to the 2000 Dot-Com crash. He jokes that two years ago everyone compared Nvidia to Cisco, but now "Nvidia has become Taylor Swift and Micron is Olivia Rodrigo," as younger investors shift focus to the next big runner. Skeptics point to the late-1990s telecom boom, where companies laid thousands of miles of fiber optic cable that sat dark and drove telecom firms into bankruptcy—only for YouTube to make use of it five years later. Having owned those bankrupt telecom stocks like MFNX back then, Josh rejects the comparison. He points out that Micron's memory chips aren't being installed in data centers to collect cobwebs; they are literally short on compute relative to *today's* actual demand, not speculative demand three years out.
Denise agrees and adds crucial structural context. In the late 1990s bubble, the median technology stock's earnings peaked as early as 1996, creating a multi-year disconnect between skyrocketing stock prices and deteriorating fundamentals. Today, the median tech stock remains highly profitable, cap-weighted tech margins are still expanding, and the financial landscape is vastly healthier. Josh then brings up a major source of market anxiety: heavy AI capital expenditure is being funneled into private startups like OpenAI and Anthropic, which lack public quarterly tickers and disclosures. While executives drop casual revenue hints at events like the Milken Institute Conference, investors struggle to directly tie CapEx spending to audited revenue streams, fueling persistent skepticism.
- **Dot-Com Disconnect:** During the 1990s bubble, median tech stock earnings peaked in 1996, four years before the market top.
- **Key Difference:** Today's CapEx buildout is driven by current compute shortages rather than speculative "build it and they will come" infrastructure.
---
[37:45](https://www.youtube.com/watch?v=LgmzAXMBbu4&t=2265s) Profit Margins, Unit Labor Costs, and the S&P 493 Broadening
Michael highlights a chart from BCA Research showing that net profit margins across almost every sector sit at all-time highs and are projected to expand further. Denise explains that the single tightest correlation to corporate profit margins is **unit labor costs** adjusted for productivity. Currently, unit labor costs are in the bottom quartile of historical data. Restrained wage growth coupled with accelerating productivity gains has provided a strong tailwind for profit margins. While Josh asks if companies are simply shifting labor budget into buying compute and AI tools, Denise notes it is still early for full AI integration, but the macroeconomic setup naturally supports elevated corporate profitability despite pervasive market fear.
Josh and Denise shift to what Josh calls "the most underappreciated market story of the year"—the performance and earnings recovery of the "S&P 493" (the index excluding the Magnificent 7). Denise notes that while cap-weighted earnings held up fine, equal-weighted earnings suffered a prolonged, three-year contraction starting in 2022 (a "full-employment earnings recession"). Now, equal-weighted earnings are finally recovering into a "full-employment recovery," currently just four months into what typically is a multi-year expansion cycle.
- **Primary Margin Driver:** Unit labor costs sit in the bottom quartile of historical ranges, directly fueling record corporate profit margins.
- **Duration of Earnings Contraction:** Equal-weighted earnings contracted for roughly 3 years prior to the current 4-month recovery.
---
[41:48](https://www.youtube.com/watch?v=LgmzAXMBbu4&t=2508s) Year-to-Date Market Returns and Index Contributions
Josh highlights year-to-date performance numbers to dispel the narrative that the market is solely reliant on the Big Tech giants. The Magnificent 7 stocks are up roughly 6.6% year-to-date, actually *underperforming* the rest of the market (the S&P 500 ex-Mag 7 is up 10.25%). Furthermore, the Mag 7 members are diverging from one another rather than trading as a single monolith.
Looking at the top ten individual contributors to the S&P 500's gains this year, Alphabet (Google) holds the number one spot, followed closely by Micron as the number two contributor—adding over 100 basis points to the index performance single-handedly after starting the year at just $100 billion. The top list of contributors is heavily dominated by tech and semiconductor names:
Together, these top 10 stocks account for roughly 2.3% of the overall S&P 500 gain out of the total 10% year-to-date advance, proving that market participation has broadened significantly beyond just a few mega-caps.
- **Mag 7 vs. S&P 493 YTD:** Mag 7 is up ~6.6% YTD, while the S&P 500 ex-Mag 7 is up ~10.25%.
- **Micron Index Impact:** Contributed over 100 bps to the total index return year-to-date.
<ElicitationsGroup message="Explore related market trends and podcast topics:">
<Elicitation label="Analyze the Fed policy and inflation discussion from TCAF 244" query="Summarize what Michael Batnick, Josh Brown, and Denise Chisholm discussed regarding inflation, oil prices, and Fed policy in TCAF episode 244."/>
<Elicitation label="Break down the upcoming IPO wave discussion for SpaceX and OpenAI" query="What did the TCAF 244 host and guests say about the prospective IPO wave including SpaceX, OpenAI, and Anthropic?"/>
</ElicitationsGroup>
[44:03](https://www.youtube.com/watch?v=LgmzAXMBbu4&t=2643s) Small-Cap Earnings Dynamics and Manufacturing Recovery
Michael Batnick highlights a dramatic divergence in expected four-quarter forward earnings growth between small-cap and large-cap sectors. While energy and materials present predictable dynamics, the spread is staggering in sectors like financials—where small caps are projected to see 66% earnings growth versus just 7% for large caps—as well as real estate and consumer discretionary.
Josh Brown and Michael Batnick question whether these aggressive small-cap projections are distorted by accounting mechanics—specifically how non-earning companies in indices like the Russell 2000 are factored into calculations when transitioning from losing money to generating modest profits (e.g., going from $-0.05$ to $\$0.05$). Batnick points out that this surge isn't driven by expectations of Federal Reserve rate cuts, as market pricing for rate cuts has moved in the opposite direction.
Denise Chisholm explains that this shift represents the early stages of a cyclical recovery tied directly to the manufacturing economy. She notes that the ISM New Orders index recently inflected higher for the first time in three years—a rare event, as a three-year manufacturing malaise has not been seen since the 1980s. Because small businesses are heavily linked to domestic productive capacity, their median earnings are finally emerging from a localized three-year recession.
- **Financials forward earnings growth:** 66% expected for small caps vs. 7% for large caps.
- **Russell 2000 Non-earners:** Historically ~20% or more of the index; small profit swings heavily distort percentage growth metrics.
- **ISM New Orders:** Inflected higher for the first time in 3 years, signaling an end to a protracted manufacturing slump.
---
[45:52](https://www.youtube.com/watch?v=LgmzAXMBbu4&t=2752s) Inflation, Shelter Distortions, and Equity Market Sweet Spots
The discussion pivots to inflation trends, with Josh Brown highlighting that persistent inflation has altered market expectations surrounding Fed policy, pushing the probability of the first interest rate cut of 2026 into December or off the table entirely. Brown raises the question of whether investors should brace for rate hikes if inflation numbers fail to cool over the coming months.
Denise Chisholm argues that equity investors don't necessarily need inflation to cool down to 2.5% for stocks to perform well. Historical data demonstrates that the "sweet spot" for equity markets is when inflation sits between 3% and 4%, where stocks effectively serve as an inflation hedge driven by earnings growth. Equities only struggle during periods where inflation is in the top quartile (above 4.5%) and actively rising.
Furthermore, Chisholm highlights a major structural distortion in current Core CPI data: shelter costs. Acting like a classic supply shock—because high mortgage rates locked homeowners in place, freezing housing supply—shelter makes inflation appear far worse than underlying economic reality. Excluding shelter, Core CPI came in at just 2.3% last month.
- **Equity market sweet spot:** 3% to 4% inflation allows stocks to act as a natural inflation hedge.
- **High-risk inflation threshold:** Top quartile inflation (>4.5% and rising) is the primary regime where equities underperform.
- **Core CPI ex-shelter:** Reads at 2.3%, illustrating that shelter acts as a supply-shock anomaly rather than broad demand-pull inflation.
---
[48:38](https://www.youtube.com/watch?v=LgmzAXMBbu4&t=2918s) Oil Shocks, Fed Policy, and Corporate Pricing Power
Addressing concerns about rising energy prices, Denise Chisholm presents counterintuitive historical data on how oil price spikes affect Federal Reserve behavior. When examining 6-month spikes in oil prices ranging from 10% to 60%, history shows a *negative* correlation with Fed rate hikes over the subsequent 12 months. Even after a 60% surge in oil, the historical probability of the Fed raising interest rates is only 25%.
Josh Brown and Chisholm discuss why this occurs: central bankers view energy spikes as a supply shock that acts like a tax hike on consumers rather than a catalyst for sustained core inflation. Raising interest rates in response to expensive gasoline does not create more oil; it merely compounds the economic burden on households. Since 1980, oil spikes have passed through to core inflation only 48% of the time.
In contrast, what actually triggers Fed rate hikes is strong economic growth, specifically durable goods orders and core capital goods shipments. With core capital goods orders currently sitting in the top quartile, historical odds of a Fed hike increase to 65%. Chisholm notes that corporate America's ability to pass on costs has diminished; over the past 12 months, consumers pushed back against higher prices by reducing quantity demanded, forcing companies in sectors like autos and airlines to cut prices.
> "Many investors see higher oil prices as the factor that's increasing the odds of a Fed hike. But when you examine the data, oil-driven shocks have historically made the Fed less likely to tighten, not more—functioning more like a tax on the consumer than a catalyst for broad-based price increases."
- **Oil shock reaction:** Historical chance of a Fed hike after a 60% oil spike is only 25%.
- **Pass-through rate:** Oil spikes have led to core inflation pass-through only 48% of the time since the 1980s.
- **Capital goods indicator:** Top-quartile growth in core capital goods raises the historical probability of Fed tightening to 65%.
---
[50:52](https://www.youtube.com/watch?v=LgmzAXMBbu4&t=3052s) Modest Rate Hikes, 10-Year Yields, and the "Gift of the Magi"
Josh Brown jokes about his experience on financial television, where pundits obsess over rate hikes versus cuts in overly simplistic binary terms while ignoring the critical factor of *magnitude*. Chisholm points out that when the Fed hikes rates modestly—by 25 to 100 basis points over a year—the stock market actually outperforms its baseline historical win rate (rising above the standard 75% probability). This occurs because small hikes confirm that economic growth is solid and that the Fed is following the cycle rather than choking it.
Brown compares the market's overreaction to oil-driven inflation to O. Henry's classic short story *The Gift of the Magi*—where a husband sells his watch to buy hair combs for his wife, only to find she sold her hair to buy a watch chain. Worrying that an oil tax on consumers will force the Fed to raise rates is similarly counterproductive: it exacerbates the exact burden it seeks to relieve.
Regarding the 10-year Treasury yield, Chisholm emphasizes that current levels are not anomalous when benchmarked against GDP growth. In the 1990s, the 10-year yield comfortably sat at 5% to 6% during a booming economy. Lower interest rates are often a symptom of sluggish growth, whereas slightly higher yields simply reflect healthy economic activity.
- **Modest hike performance:** Stock market win rates exceed the 75% baseline during minor rate-hiking cycles (25–100 bps) due to underlying economic strength.
- **10-year Treasury yield context:** Current yield levels align with historical GDP growth regimes and mirror healthy 1990s environments (where 10-year yields hovered between 5% and 6%).
---
[55:33](https://www.youtube.com/watch?v=LgmzAXMBbu4&t=3333s) Mega-IPOs and Market Liquidity Concerns
The group transitions to the mega-cap private companies preparing to enter the public market, led by expected offerings from SpaceX, OpenAI, and Anthropic. Batnick presents a historical comparison of capital raised during the dot-com IPO boom of 1998–2000, which generated \$34 billion, \$65 billion, and \$65 billion in consecutive years ($164 billion total across hundreds of deals).
By contrast, just three mega-deals today—SpaceX (potentially listing as soon as June), OpenAI, and Anthropic—could collectively absorb upwards of \$170 billion in capital. While Batnick and Brown acknowledge that these absolute dollar amounts should be contextually rebased against today's vastly larger total market capitalization, the sheer size of these individual offerings raises questions about market liquidity.
Chisholm notes that while IPO booms historically correlate with market tops, euphoria, and peak economic conditions, today's broader market lacks the typical top-quartile sentiment and exorbitant earnings signals that characterize a classic bubble bust. Batnick shifts the discussion to the mechanical strain on institutional portfolio managers who may need to liquidate existing holdings to make room for these massive new equity supply issues.
- **1998–2000 IPO Boom:** $\$164$ billion raised across hundreds of companies over 3 years (\$34B in '98, \$65B in '99, \$65B in '00).
- **Modern Mega-IPO Wave:** SpaceX, OpenAI, and Anthropic could demand $\sim\$170$ billion in market liquidity across just 3 offerings.
[58:12](https://www.youtube.com/watch?v=LgmzAXMBbu4&t=3492s) High-Beta "Junk" Tech, IPO Absorption, and Market Breadth
The hosts and Denise Chisholm navigate the market dynamics surrounding massive upcoming mega-IPOs like SpaceX, examining how the market will absorb tens of billions of dollars in new equity issuance. Josh Brown highlights a guest's calculation that a major listing could raise $74 billion—or up to $86 billion if the green shoe option is exercised. He points out that for the stock to open up rather than pop and immediately break down, double that capital might need to be mobilized, forcing institutional managers to sell other tech holdings.
Chisholm responds that while short-term liquidity bottlenecks and "idiosyncratic volatility" can occur, history shows that capital absorption issues resolve quickly once earnings take over. She points out that similar rebalancing shifts occurred during the 2000 Russell index shifts. As long as broader corporate earnings remain robust, buyers are naturally drawn back into the market, absorbing new share supply seamlessly—especially if corporate share buybacks remain active.
Moving to retail speculation, Michael Batnick questions whether the surge in unprofitable, speculative tech stocks—evidenced by the Roundhill MEME ETF reaching all-time highs—is a troubling signal. Chisholm notes that while high-beta technology stocks have surged off their bottoms, relative performance paints a very different picture. Rebased against the S&P 500, high-beta tech has actually lagged broader tech, maintaining a structural relative downtrend that traces back to the late 1990s. This initial surge in low-quality or "junk" stocks is a standard hallmark at the start of a broader earnings recovery cycle, meaning current market behavior aligns closely with historical norms rather than an unhinged bubble.
- A green shoe exercise on a major mega-IPO could bring total issuance to $86 billion, requiring significantly higher secondary demand to ensure a successful post-listing pop.
- High-beta tech stocks within the S&P 500 have hit absolute highs, but relative to broader technology, lower-volatility quality tech has outperformed them by approximately 75%.
- Unprofitable meme basket holdings include space and quantum names such as Redwire, AST SpaceMobile, Applied Optoelectronics, Iridium, Applied Digital, and Rocket Lab.
---
[01:02:30](https://www.youtube.com/watch?v=LgmzAXMBbu4&t=3750s) Key Takeaways for Investors
Josh Brown summarizes the core thesis of the discussion into three pivotal takeaways for market participants. First, the market may still be in the early innings of an earnings recovery cycle for the "S&P 493"—the non-Mega-Cap 7 stocks. While casual observers assume the multi-year bull run is nearing exhaustion, small-cap margins are expanding, equal-weighted indices are accelerating, and earnings growth outside the Magnificent Seven is set to lead. Following a three-year period of compressed earnings and margins for the broader market, a multi-year expansion for the 493 could be the most underappreciated story on Wall Street.
Second, the recent valuation multiple compression represents a healthy setup. Because P/E ratios are compressing due to robust earnings growth outstripping price appreciation—rather than declining stock prices during an earnings crash—it reflects persistent wall-of-worry skepticism that leaves room for further upside. Third, Federal Reserve policy is unlikely to act as a significant headwind or primary threat to equities over the second half of the year.
> "The number one thing for me from this conversation is that we could be relatively early in the earnings growth cycle for the 493... What if we had 3 years of earnings expansion, margin expansion for everything that's not a Mag 7? That might be the most underappreciated aspect of the market." — Josh Brown
- **Earnings Broadening:** Small-cap margins and equal-weighted index earnings growth are beginning to outpace the Magnificent Seven.
- **Multiple Compression:** Falling valuation multiples driven by strong underlying earnings growth provide a resilient backdrop for equities.
- **Fed Outlook:** Monetary policy is positioned to be neutral to supportive rather than a major market disruptor in the near term.
---
[01:04:19](https://www.youtube.com/watch?v=LgmzAXMBbu4&t=3859s) Boston Favorites, Fidelity Research, and Closing Remarks
The conversation shifts to a lighthearted wrap-up exploring life in Boston, where Denise Chisholm is based. When asked about her favorite aspect of the city, Chisholm eschews the humid summer heat in favor of Boston's autumn season. The group chats about iconic local staples, ranging from Dunkin' runs to the famous Italian bakeries of the North End like Mike's Pastry. While Michael and Josh fondly recall staying in the revitalized Seaport district—once a landscape of parking lots—Chisholm jokes that despite the city's celebrated seafood, the best seafood dinner in Boston is cooked at home by her husband.
Closing out the show, Chisholm shares where institutional and retail investors can track her ongoing macroeconomic and market strategy research. She publishes regular content across Fidelity platforms, including weekly charts, monthly white papers, and client updates.
- **Fidelity Market Insights:** Denise Chisholm hosts Fidelity's *Market Insights* podcast and delivers quarterly sector research updates for Fidelity clients.
- **LinkedIn Newsletter:** Weekly macro charts and research analysis are published directly on her LinkedIn page.
<FollowUp label="Would you like a summary of the macro points on AI capex and semiconductors from earlier in the episode?" query="Summarize the core macro arguments made in this episode regarding AI capex, semiconductor cycles, and historical market comparisons."/>
## Notable quotes
> [09:39](https://www.youtube.com/watch?v=LgmzAXMBbu4&t=579s) At the peak of the bubble in 2000, corporate America in aggregate was spending three and a half to four times their free cash flow at the time. We are still under one in terms of free cash flow. — Denise Chisholm
> [15:09](https://www.youtube.com/watch?v=LgmzAXMBbu4&t=909s) Well, what if they don't go wrong in the way that you think that they will? — Denise Chisholm
> [22:25](https://www.youtube.com/watch?v=LgmzAXMBbu4&t=1345s) literal heroin — Josh Brown
> [22:25](https://www.youtube.com/watch?v=LgmzAXMBbu4&t=1345s) the world's most addictive product — Josh Brown
> [33:06](https://www.youtube.com/watch?v=LgmzAXMBbu4&t=1986s) Nvidia has become Taylor Swift and Micron is Olivia Rodrigo — Josh Brown
> [37:45](https://www.youtube.com/watch?v=LgmzAXMBbu4&t=2265s) the most underappreciated market story of the year — Josh Brown
> [48:48](https://www.youtube.com/watch?v=LgmzAXMBbu4&t=2928s) Many investors see higher oil prices as the factor that's increasing the odds of a Fed hike. But when you examine the data, oil-driven shocks have historically made the Fed less likely to tighten, not more—functioning more like a tax on the consumer than a catalyst for broad-based price increases. — Denise Chisholm
> [01:02:30](https://www.youtube.com/watch?v=LgmzAXMBbu4&t=3750s) The number one thing for me from this conversation is that we could be relatively early in the earnings growth cycle for the 493... What if we had 3 years of earnings expansion, margin expansion for everything that's not a Mag 7? That might be the most underappreciated aspect of the market. — Josh Brown
## Mentioned
Michael Batnick, Downtown Josh Brown, Denise Chisholm, Neil deGrasse Tyson, Kyma, Toast, Uber Eats, Anthropic, Altimeter Capital, Dragoneer, Greenoaks, Sequoia, Capital Group, Coatue, D1 Capital Partners, GIC, Iconiq, Accel, Baillie Gifford, Blackstone, Brookfield, D.E. Shaw, DST Global, Fidelity Management & Research, General Catalyst, Insight Partners, Jane Street, Lightspeed, Franklin Templeton, Fidelity Investments, Goldman Sachs, S&P 500, Apple, Meta, Instagram Reels, Netflix, PHLX Semiconductor Index (SOX), Micron Technology, UBS, Cisco, Lucent, JDS Uniphase, Taylor Swift, Olivia Rodrigo, MFNX, YouTube, OpenAI, Milken Institute Conference, BCA Research, S&P 493, Magnificent 7, Alphabet, Nvidia, AMD, Amazon, Intel, Broadcom, Sandisk, Lam Research, Russell 2000, Federal Reserve, ISM New Orders, Core CPI, SpaceX, Roundhill MEME ETF, Redwire, AST SpaceMobile, Applied Optoelectronics, Iridium, Applied Digital, Rocket Lab, Dunkin', Mike's Pastry
Fidelity quantitative strategist Denise Chisholm and hosts Downtown Josh Brown and Michael Batnick argue that the equity bull market remains grounded in corporate fundamentals rather than speculative euphoria. They suggest investors may be in the early stages of a multi-year earnings recovery cycle outside mega-cap tech, supported by disciplined capital expenditure and improving market breadth.
AI Infrastructure Spending Versus Dot-Com Bubble Excess (7:39)
Goldman Sachs raised its S&P 500 price target to 8,000, projecting 24% year-over-year earnings growth for the current year and 13% for 2027, driven by artificial intelligence infrastructure investments. Skeptics frequently compare rising capital spending to the 1990s telecom bust, where fiber optic cable sat unutilized. However, Chisholm points out that during the 2000 dot-com peak, corporate America’s aggregate CapEx stood at 3.5x to 4x free cash flow. In contrast, aggregate corporate CapEx across the S&P 500 today remains under 1x free cash flow.
Batnick notes that major tech companies are shifting from capital-light software models into capital-intensive "modern industrials" spending heavily on physical projects. Even so, Chisholm emphasizes that tech hyperscalers maintain high margins and returns on capital, funded directly by cash flow rather than dilutive equity issuance. Brown cites Meta generating $50 billion in annualized revenue from AI-driven Instagram Reels as evidence that current CapEx addresses immediate compute shortages and produces real monetary returns.
Semiconductor Momentum Anchored by Earnings Growth (26:25)
Extreme momentum in semiconductors—such as the PHLX Semiconductor Index trading 69% above its 200-day moving average and Micron joining the trillion-dollar market cap club after ranking #127 a year earlier—has raised concerns of cyclical overextension. UBS also raised its price target on Micron from $535 to $1,625. However, Chisholm highlights that the semiconductor sector’s 100% gain over the trailing 12 months matches underlying earnings growth rather than multiple expansion.
Historical data across all market industries since the 1960s indicates that while 70% to 100% 12-month advances occur only 2% of the time, groups achieving that pace outperform the broader market the following year 65% of the time. Furthermore, Chisholm notes that semiconductor valuations in the bottom quartile historically yield a 70% probability of 12-month outperformance, suggesting the traditional three-year semiconductor cycle may be extending toward a seven-year structural expansion.
The S&P 493 Earnings Recovery and Expanding Margins (37:45)
Year-to-date market returns contradict the assumption that equities depend entirely on the Magnificent Seven. The Magnificent Seven gained roughly 6.6% year-to-date, trailing the S&P 500 ex-Mag 7's 10.25% gain. Chisholm notes that while equal-weighted index earnings experienced a three-year contraction starting in 2022, they are now four months into an early-stage recovery cycle that historically lasts multiple years.
Underlying profitability is supported by unit labor costs adjusted for productivity, which currently sit in the lowest quartile of historical data. Simultaneously, the ISM New Orders index inflected higher for the first time in three years, indicating an end to protracted manufacturing weakness. Forward earnings growth expectations reflect this cyclical broadening, with small-cap financials projected to expand earnings by 66% compared to 7% for large caps.
Macroeconomic Sweet Spots in Inflation and Monetary Policy (45:52)
Chisholm contends that macro fears regarding inflation and interest rates are often misdiagnosed. Historical data shows that equities perform best when inflation sits between 3% and 4%, functioning as a natural inflation hedge via earnings growth. Equities typically suffer only when inflation accelerates within the top quartile (above 4.5%). Furthermore, Core CPI ex-shelter sits at 2.3%, illustrating that housing supply distortions from locked-in mortgages exaggerate headline inflation.
Similarly, historical data indicates a 60% surge in oil over six months results in a Fed rate hike only 25% of the time, because policymakers view energy spikes as a consumer tax that passed through to core inflation only 48% of the time since 1980. Central bank tightening is driven instead by strong capital goods orders. When the Fed hikes rates modestly by 25 to 100 basis points, stock market win rates exceed the baseline 75% rate by confirming underlying economic expansion.
Mega-IPO Liquidity Demands and Retail Speculation (55:33)
Private capital expansion—exemplified by Anthropic’s $65 billion Series H funding at a $965 billion valuation—previews a massive mega-IPO wave. Expected offerings from SpaceX, OpenAI, and Anthropic could seek approximately $170 billion, matching the $164 billion raised across hundreds of listings during the 1998–2000 tech boom. Brown and Batnick caution that institutional managers may need to sell existing tech holdings to absorb these listings, potentially generating short-term liquidity bottlenecks.
Chisholm notes that while high issuance can cause temporary volatility, robust corporate earnings and share repurchases historically absorb new supply. Addressing retail speculation, Chisholm observes that while high-beta tech has rallied off its lows, quality tech has outperformed high-beta tech by roughly 75% on a relative basis since the late 1990s. She views initial rallies in low-quality, speculative shares as typical behavior during early earnings recovery cycles rather than evidence of late-stage mania.
While upcoming mega-IPOs could test secondary market liquidity, the hosts and Chisholm conclude that corporate balance sheets, expanding profit margins, and broadening earnings outside mega-cap tech provide durable support. An unresolved question is whether private AI companies can demonstrate audited revenue streams and public market absorptive capacity when their multi-billion-dollar listings debut.
[9:39] Denise Chisholm: At the peak of the bubble in 2000, corporate America in aggregate was spending three and a half to four times their free cash flow at the time. We are still under one in terms of free cash flow.
[15:09] Denise Chisholm: Well, what if they don't go wrong in the way that you think that they will?
[22:25] Josh Brown: literal heroin
[22:25] Josh Brown: the world's most addictive product
[33:06] Josh Brown: Nvidia has become Taylor Swift and Micron is Olivia Rodrigo
[37:45] Josh Brown: the most underappreciated market story of the year
[48:48] Denise Chisholm: Many investors see higher oil prices as the factor that's increasing the odds of a Fed hike. But when you examine the data, oil-driven shocks have historically made the Fed less likely to tighten, not more—functioning more like a tax on the consumer than a catalyst for broad-based price increases.
[62:30] Josh Brown: The number one thing for me from this conversation is that we could be relatively early in the earnings growth cycle for the 493... What if we had 3 years of earnings expansion, margin expansion for everything that's not a Mag 7? That might be the most underappreciated aspect of the market.
Original transcript
[0:00] Good.
[0:00] >> We were just talking about your octopus.
[0:02] >> What's up, man?
[0:02] >> Yeah.
[0:03] >> Um
[0:05] I saw a reel from Neil deGrasse Tyson on
[0:08] these being the closest thing we have to
[0:10] aliens. They have like nine hearts, a
[0:12] couple of brains.
[0:14] >> I did not know that.
[0:15] >> off their arm and it grows back.
[0:16] >> Well, that part I know. I remember that.
[0:17] Yeah, yeah.
[0:18] >> Each one of their tentacles can see,
[0:20] feel, touch, smell, taste.
[0:23] >> I don't eat I don't eat octopus.
[0:25] >> Okay, you don't.
[0:26] >> But I eat calamari. I eat squid.
[0:28] >> Okay.
[0:28] >> I don't know why I draw the distinction.
[0:30] Um but the I saw a documentary about how
[0:32] intelligent octopi are.
[0:35] >> Yep.
[0:35] >> And I just
[0:36] >> Good use of plural there.
[0:38] >> So, the problem is we go to like we go
[0:39] to Kima, we go to like all these like
[0:41] Mediterranean restaurants, and everybody
[0:43] gets the grilled octopus.
[0:45] You know, I used to like it a lot.
[0:47] >> But now you feel bad about
[0:48] >> I'm wasting away.
[0:49] Um Denise,
[0:51] >> [laughter]
[0:51] >> here's where I'm at.
[0:53] >> Tell me.
[0:54] >> I don't know if this is my age or my
[0:56] personality.
[0:59] I'm now at a stage where I eat out of a
[1:02] restaurant
[1:02] >> Mhm.
[1:03] >> and I have no patience for the bringing
[1:06] of the check routine.
[1:08] >> Mhm.
[1:08] >> Like you have to flag somebody down,
[1:11] they come over, I'd like the check, they
[1:14] will be right back, they go and get it,
[1:15] then they come, they leave it there.
[1:18] Then you have to sit with it for 5
[1:19] minutes.
[1:19] >> Yep. Please come back. Please come back.
[1:21] >> Then you put your credit card in and
[1:22] you're looking around for somebody. I'll
[1:24] give it to a busboy. I don't give a
[1:25] [ __ ]
[1:26] >> own Toast?
[1:27] >> Hold on.
[1:27] >> [laughter]
[1:27] >> And then and then they'll come take it
[1:30] and then that's a mystery. Where do they
[1:32] go? Cuz the thing that they dial it into
[1:35] is always by the kitchen.
[1:36] >> They're yep.
[1:37] >> Fine.
[1:37] >> I see it.
[1:38] >> Then they come back, then I have to look
[1:40] at it and pretend that I'm looking at
[1:42] it, and then the and then the signing
[1:43] the tip.
[1:45] So, when the Toast thing came along,
[1:47] okay, I loved it.
[1:48] >> Yeah.
[1:49] >> And I'm I'm a I own uh shares of Toast
[1:52] the stock. But like, can I have a check?
[1:54] Yes, here it is, right here.
[1:56] >> I have the control.
[1:57] >> I just want to press a button.
[1:59] Literally, the last forkful, I want to
[2:00] drop the fork and walk out of the
[2:02] restaurant.
[2:03] Now, I don't know if that's me like my
[2:05] >> achieve that? Yeah.
[2:06] >> This is This is Josh's softer side. This
[2:08] is how he connects with the audience.
[2:09] >> No, [laughter] it's really bad. My The
[2:11] point I was trying to make is I used to
[2:14] have a lot more It's not tolerance,
[2:17] patience.
[2:18] I just want to When I finish something,
[2:21] I want to be on to the next thing, and
[2:23] the lingering is what
[2:25] >> Was it an SNL skit with the doctor and
[2:28] the old man that you have EOG?
[2:30] >> What is EOG? Am I allowed to say
[2:32] >> Early onset grumpiness.
[2:34] >> [laughter]
[2:34] >> Did you ever
[2:35] >> Yeah, I was diagnosed. Yeah.
[2:37] >> You have EOG? Can I get rid of it?
[2:38] >> No, there's no way you can get
[2:39] [laughter] rid of it. Why would I not
[2:41] complain?
[2:42] >> But isn't it better for the Isn't it
[2:44] better for the server, for the
[2:46] restaurant owner?
[2:47] >> All right, so as a former As a former
[2:49] waiter, I was a waiter for years.
[2:51] >> Yeah. Full time.
[2:52] >> Why does it take so long?
[2:53] >> Because you, sir, are not the only
[2:55] customer.
[2:55] >> But why do we have to do this dance?
[2:57] >> What dance?
[2:58] >> I just want to It's 2026. I just want to
[3:02] put put my fork down, put the napkin on
[3:04] the table, and walk out.
[3:05] >> can say is usually, like it's 50/50 if
[3:07] they bring you a toast.
[3:08] >> What if I just give them my credit card
[3:10] on the way in?
[3:11] >> Just stay home.
[3:12] >> Yeah.
[3:12] >> [laughter]
[3:13] >> All right, problem solved.
[3:14] >> out. Uber Eats.
[3:15] >> Problem solved.
[3:16] >> thought of that.
[3:17] I hadn't thought of that.
[3:18] >> you in New York frequently? Do you come
[3:19] here often?
[3:20] >> Not Not that frequently, no.
[3:22] >> No.
[3:22] >> Well, everyone here is just like me, so
[3:24] >> [laughter]
[3:25] >> No, I'm not really normally like this.
[3:27] >> Yeah, that's okay.
[3:27] >> We know you can't do individual stocks,
[3:30] we can. So, we'll do the talking.
[3:31] >> You do the talking.
[3:32] >> Yeah.
[3:34] >> So, I know you can't confirm or deny,
[3:35] but it's public now. It's public. Uh
[3:38] this just happened before we came on
[3:39] here, Anthropic series H.
[3:43] Where we go? Where Where is this? Series
[3:44] H, they're raising $65 billion at
[3:48] $965 billion post money. The round is
[3:50] being led by Altimeter Capital,
[3:52] Dragoneer, Greenoaks, and Sequoia. And
[3:54] listen to who's participating.
[3:55] Basically, everybody. Um
[3:58] uh Capital Group, Coatue, D1 Capital
[4:00] Partners,
[4:01] >> Travis Kalanick
[4:02] >> GIC, Iconic, yeah, and and Thaler, too.
[4:04] And Accel, um AMP, AMP, BBC, Baillie
[4:09] Gifford, Blackstone, Brookfield, D.E.
[4:10] Shaw, DST Global, Fidelity Management
[4:13] and Research Company, General Catalyst,
[4:15] Insight Partners, Jane Street,
[4:17] Lightspeed Partners. I'm like halfway
[4:18] done. I'll stop reading, but
[4:19] >> Right.
[4:19] >> holy [ __ ]
[4:20] >> with that amount of money, you need
[4:22] everybody.
[4:23] >> Basically.
[4:23] >> Like it's like the it's like a it's like
[4:25] the last Avengers.
[4:27] Right? Like everybody's got to show up
[4:29] for this. You You're trying to You're
[4:32] trying to do $2 million, maybe $3
[4:35] trillion IPOs inside of a 6-month
[4:37] window.
[4:38] You need all the Avengers.
[4:40] >> Mhm.
[4:40] >> So, I don't know.
[4:41] >> Are we potting?
[4:42] >> Yeah.
[4:42] >> All right.
[4:43] >> We're ready.
[4:43] >> Are you nervous about the IPOs? We're
[4:45] going to talk about it.
[4:46] >> Not the ones that Fidelity's invested
[4:48] in.
[4:48] >> There we go.
[4:49] >> I have it on good authority.
[4:51] >> I mean, the cult Look at this. John's on
[4:53] John's on the
[4:55] >> See you at 2:45.
[4:55] >> I'm
[5:01] >> [music]
[5:07] [music]
[5:07] >> Quick trivia question.
[5:09] Which asset class saw a 100% increase in
[5:11] flows this Q1 versus last [music] Q1?
[5:14] The answer, drum roll, please, municipal
[5:16] bonds. With taxable equivalent yields
[5:19] looking extremely [music]
[5:20] favorable, investors are finding this
[5:22] boring asset class pretty exciting. And
[5:25] when it comes to munis, Franklin
[5:26] Templeton has the expertise and
[5:28] experience you need. They've been
[5:30] managing tax-free income strategies for
[5:32] over 40 years. Today, they offer a
[5:34] comprehensive muni bond lineup,
[5:36] including more state-specific strategies
[5:38] and more active muni ETFs than any other
[5:40] manager. See their full range of muni
[5:42] mutual funds, ETFs, and SMAs at
[5:45] franklintempleton.com/munis.
[5:47] Before investing, carefully consider a
[5:49] fund's investment objectives, risks,
[5:51] charges, [music] and expenses. You can
[5:53] find this and other information and each
[5:54] prospectus or summary prospectus, if
[5:56] available, at franklintempleton.com.
[5:59] Please read it carefully. All investing
[6:00] [music] involves risk, including
[6:02] possible loss of principal. Franklin
[6:04] Distributors LLC, member FINRA, SIPC.
[6:07] >> Business oriented.
[6:09] >> Oh my god, ladies and gentlemen, welcome
[6:12] to the very finest investing podcast in
[6:14] the world.
[6:16] I'm your host Downtown Josh Brown. If
[6:18] this is your first time joining us,
[6:21] man, are you in for [cheering] a treat.
[6:22] Or I apologize.
[6:24] I'm not sure.
[6:26] To my left, my co-host, co-creator of
[6:28] the show,
[6:30] all around good guy, Mr. Michael
[6:31] Batnick.
[6:33] >> Hello, hello.
[6:34] >> That's it? That's all we got?
[6:36] >> Thank you. Thank you.
[6:38] >> All right. Far too kind.
[6:40] >> [applause]
[6:40] >> Our special guest, returning champion,
[6:42] she crushed it on the show the first
[6:45] time we had we were in Boston. Is that
[6:46] right?
[6:47] >> That's right.
[6:47] >> All right.
[6:48] >> [applause]
[6:49] >> Denise Chisholm is director of
[6:51] quantitative market strategy within the
[6:53] quantitative research and investments
[6:55] division at Fidelity Investments.
[6:58] Denise focuses on historical analysis
[7:01] and its application in diversified
[7:03] portfolio strategies using factors.
[7:06] Oh, they like the factors, Denise.
[7:08] >> Oh, good.
[7:08] >> Or sectors.
[7:10] >> Yeah, that's better. Yeah, I like
[7:11] sectors, too.
[7:12] >> And themes. Denise joined Fidelity in
[7:14] 1999.
[7:16] Her research informs the views [music]
[7:17] of roughly 150 managers overseeing more
[7:20] than 450
[7:22] mutual funds and ETFs. Thank you so
[7:24] much.
[7:25] >> Yeah, thanks for having me. Thanks for
[7:26] having me back.
[7:28] >> Question one.
[7:30] Where will the S&P 500 finish 2026?
[7:33] >> No idea. Don't give us spot estimates.
[7:35] So,
[7:36] higher or lower is
[7:38] >> I think I think that's a good bet.
[7:39] >> Yeah.
[7:39] >> Uh Goldman Sachs joined the S&P 8000
[7:43] chorus this week. I want to read their
[7:46] rationale and
[7:48] get your response.
[7:50] All of this checks out with me. So, all
[7:52] right, earnings growth powered by the AI
[7:54] boom will drive further gains in stocks.
[7:57] Okay, I think we're all experiencing
[7:58] that right now. We would all agree.
[8:00] Goldman is going to 8000 from 7600.
[8:04] Quote, "Continued earnings growth should
[8:07] drive continued equity market upside.
[8:09] The increased return forecast reflects
[8:11] increased estimates for S&P earnings
[8:14] following an exceptionally strong first
[8:16] quarter reporting season. I also would
[8:18] point out their earnings per share
[8:20] forecast would
[8:23] equate to 24% year-over-year growth this
[8:26] year. And they're bumping up 27 to 13%
[8:30] growth. The argument is there's a lot of
[8:32] beneficiaries of artificial intelligence
[8:34] infrastructure investment in the S&P.
[8:37] Maybe that was under appreciated in
[8:39] January and we've all woken up to this.
[8:41] Last thing, the combination of
[8:45] decelerating earnings growth and
[8:46] continued uncertainty around both AI and
[8:49] the macroeconomic outlook should prevent
[8:52] a major increase in valuations. So,
[8:55] they're saying not a bubble. The
[8:56] governor is there's still this
[8:58] uncertainty about AI. So, the
[9:00] infrastructure powers the earnings, but
[9:03] the multiple stays in check because
[9:05] people are a little bit nervous about
[9:07] what is it all going to mean. Does that
[9:08] sound certainly in line with what what
[9:11] you expect?
[9:12] >> Yeah, well, I think that there's a lot
[9:13] of data that supports what they said and
[9:15] then in addition to that, which is to
[9:18] say that it is becoming more diffuse. It
[9:20] is becoming more broad in terms of the
[9:22] recovery. And you can measure it a bunch
[9:24] of different ways. And I think the
[9:26] interesting part about CapEx cycles is
[9:28] that you can measure them historically.
[9:29] I mean, post the financial crisis, we a
[9:31] lot of investors complained about the
[9:33] fact that corporate America wasn't
[9:34] spending, right? And that the earnings
[9:36] was fake-ish in the sense that it was
[9:38] driven by buybacks and dividends, and it
[9:40] wasn't real earnings. So, you can
[9:42] measure it historically. Now, we're
[9:43] starting to to complain, I would say, or
[9:46] to be concerned about CapEx. But, CapEx
[9:48] is usually the better path, right? So,
[9:50] if you say CapEx relative to sales is on
[9:52] an upward trajectory, and that's let's
[9:54] call that a CapEx recovery, and you
[9:56] could call the opposite something that's
[9:57] not, you would rather as an investor,
[10:00] from a stock market perspective, from an
[10:01] earnings perspective, from a GDP
[10:02] perspective, and from a job perspective,
[10:04] rather have a CapEx recovery.
[10:06] That CapEx recovery on the high end is
[10:08] definitely driven by CapEx seen in
[10:10] technology stocks, but it's getting more
[10:12] diffuse. So, all of the sectors now, of
[10:15] the 11 GICS sectors, we have the data
[10:18] going back in history, you can measure
[10:19] it CapEx relative to sales, they're all
[10:20] accelerating. And not to such a degree
[10:23] that we saw in any kind of bubble. I
[10:25] mean, at the bubble time, when you
[10:27] measure it, especially relative to free
[10:28] cash flow, at the peak of the bubble in
[10:30] 2000, corporate America in aggregate was
[10:33] spending three and a half to four times
[10:35] their free cash flow at the time. We are
[10:37] still under one
[10:38] in terms of free cash flow, even with
[10:40] >> Outside of the hyperscalers.
[10:42] >> Even in addition to them, like so, in
[10:44] the aggregate. So, yes, outside them,
[10:46] we're not really anywhere in that bubble
[10:48] territory.
[10:48] >> So, when people say they're spending all
[10:49] their free cash, you say, "So what?"
[10:51] >> So, I say that's six or seven companies
[10:53] over the last six or seven years, but
[10:56] it's not systemic. So, there's
[10:58] idiosyncratic, right? And then there's
[11:00] systemic. And again, when you
[11:02] idiosyncratically focus on a couple of
[11:04] companies, you you could fall prey to
[11:06] the fact that, you know, we'll see. Will
[11:08] the CapEx estimates come to fruition?
[11:10] Will the free cash flow not be there, or
[11:12] will the will revenues actually grow,
[11:15] you know, in addition to what you think?
[11:16] Or maybe they'll figure out other ways
[11:18] to generate free cash flow, which we've
[11:19] seen in the past. But, you're not seeing
[11:21] that for the aggregate of the technology
[11:24] index. So, they've grown free cash flow
[11:26] above CapEx for the better part of 20
[11:28] years. So, the recent hookup is still
[11:32] we're still from an aggregate sector
[11:34] perspective under spending in terms of
[11:36] CapEx relative to free cash flow.
[11:38] >> Why do you think people have so much
[11:40] trouble
[11:41] accepting a CapEx wave
[11:44] and not automatically going to well, it
[11:46] surely must be a bubble because
[11:48] the numbers are going up from last year.
[11:50] Therefore, it's some sort of a mania.
[11:53] Like why can't people just accept not
[11:55] every wave of CapEx spending
[11:57] automatically turns into a pumpkin?
[11:59] >> Well, don't you think maybe it's just
[12:00] because that's
[12:02] what we lived through? Meaning that
[12:04] there hasn't been a CapEx cycle in so
[12:06] long.
[12:06] >> bias. We only remember the last one and
[12:09] it turned out badly.
[12:10] >> Correct.
[12:11] >> Okay.
[12:11] >> Correct.
[12:12] >> Um have there been examples of CapEx
[12:13] bubbles that didn't result in a stock
[12:16] market crash?
[12:17] >> CapEx bubbles?
[12:17] >> Or CapEx waves, sorry, that didn't
[12:20] become bubbles and result in a a crash.
[12:22] >> Oh, for sure. I'd say like again, back
[12:24] to that sort of data, if you say a CapEx
[12:25] recovery is when you're spending CapEx
[12:27] relative to your sales base and the
[12:29] opposite, most CapEx cycles actually
[12:31] generate growth rather than create a
[12:34] bubble that deters it. So, I mean, if
[12:36] you think about it just in the basic uh
[12:38] like the virtuous cycle of the US
[12:39] economy, when corporate America sees
[12:42] growth and spends for growth, they
[12:44] create growth by spending, creating
[12:46] jobs. So, it's in some ways the it
[12:49] reflects the durability of the cycle.
[12:51] >> Can we go back to something that you
[12:52] said?
[12:53] This I think is a really key point.
[12:56] Michael and I
[12:57] have been around long enough that we
[12:59] were probably maybe not doing this show,
[13:01] but we're doing blogs or whatever,
[13:04] doing this period of time where a lot of
[13:06] the earnings per share growth was coming
[13:09] as a consequence of float shrink,
[13:11] where companies were being rewarded by
[13:13] shareholders for not spending on R&D,
[13:16] CapEx, M&A, and just like running their
[13:19] businesses, buying back stock, and those
[13:22] would be the top performers in the
[13:24] market or among the top performers, and
[13:26] that was like good enough, but you had a
[13:29] lot of critics
[13:31] railing that it's a it's a bubble
[13:33] because it's all being driven by
[13:34] buybacks, and once the buybacks stop,
[13:37] it'll all come crashing down. And
[13:39] actually, what ended up happening was
[13:40] not that. The buybacks stopped because
[13:43] there became an urgency for investment.
[13:45] >> Yeah.
[13:46] >> And then all of a sudden, the stock
[13:48] market stopped punishing people for
[13:50] capex and started rewarding
[13:52] and getting more bullish.
[13:54] >> Yes.
[13:54] >> Um and and buying the stocks of
[13:56] companies that were making these
[13:58] investments.
[13:58] >> Yeah.
[13:59] >> And now it's a lot of the same critics,
[14:02] and now they've changed their tune. Now
[14:04] they're not a
[14:05] the buybacks are over,
[14:07] but they still hate the market, and now
[14:09] the reason they hate the market is cuz
[14:10] they're not doing buybacks. They're so
[14:11] busy investing.
[14:12] >> Yeah.
[14:12] >> What are they making all these
[14:13] investments for? So, there there is a
[14:15] component to the market where they will
[14:17] just dislike a rally, and you can come
[14:20] up with the reason after it almost
[14:21] doesn't matter. Do you you feel that
[14:23] there's some of that in the air?
[14:25] >> Oh, absolutely. Absolutely.
[14:27] I think
[14:27] >> Anyone [laughter] that you want to call
[14:29] out?
[14:29] >> No, I won't [clears throat] call anybody
[14:30] out. Yeah.
[14:31] >> But you think that's a a real thing?
[14:33] >> Well, I think the the most interesting
[14:35] part is I think that most investors, and
[14:37] I think, you know, for people who study
[14:39] history, this is the exception, but most
[14:40] investors want the equity to market to
[14:43] reflect good times. And good diffuse
[14:46] times, meaning that not just a few
[14:48] companies are spending, but many
[14:49] companies are spending. There is good
[14:50] growth. There is good job growth. But
[14:52] when you study history, the equity
[14:54] market doesn't always reflect good
[14:55] times. In fact, if you had to say, if
[14:57] you dropped a quant onto it, and I'm
[14:58] kind of a quant, and you said, "Is the
[15:00] equity market reflective of good times,
[15:02] or is it a hedge against bad times?"
[15:03] You'd almost say that it's more often
[15:05] the hedge [clears throat] against bad
[15:06] times. I mean, think of all the things
[15:07] that have gone wrong over the last 5
[15:09] years, and the equity market is, you
[15:11] know, 70% higher. So, this is the trick,
[15:14] I think, of investing, that when you
[15:16] study history, like you understand all
[15:18] the risks, all the headline, like all
[15:19] the problems that can go wrong, and your
[15:21] downside risk is, "Well, what if they
[15:23] don't go wrong in the way that you think
[15:26] that they will?" Then you give up on
[15:29] average returns of 8% a year. Right,
[15:31] which is one of the few asset classes
[15:33] that can actually keep pace with
[15:34] inflation. So, I think that's the that's
[15:36] the the tug of the the the, you know,
[15:38] riddle with equity investing.
[15:40] >> I think there are investors also who
[15:42] politically
[15:44] are just on the other side of the
[15:45] administration.
[15:47] And that's, you know, perfectly fine.
[15:50] They'll have their time in the sun
[15:51] someday, too, we assume. Like, it goes
[15:53] back and forth.
[15:53] >> always goes back and forth.
[15:54] >> But there are people that when they
[15:56] don't like the direction the country
[15:57] seems to be headed in,
[15:59] they don't like who's in the White
[16:00] House, or they disagree with
[16:03] the way like certain things are
[16:05] happening in the culture,
[16:08] it it's like a cognitive dissonance that
[16:10] they almost can't bear.
[16:12] They can't process, "Why is the stock
[16:14] market higher? Isn't A so bad and B so
[16:17] bad and C so bad?" This surely this is
[16:21] wrong because I don't feel good right
[16:23] now about what I'm seeing.
[16:26] >> But the problem is that
[16:27] >> think anyone's like fully immune to
[16:28] that. Hence, the need for quantitative.
[16:31] Okay.
[16:31] >> I think that that's what what's helpful,
[16:33] right? If you say like consumer
[16:34] confidence is at all-time lows, like is
[16:36] that a problem? And you go, "Well, wait
[16:37] a minute. You'd actually be rather be
[16:39] buying equities when consumer confidence
[16:40] is low relative to high."
[16:42] >> paying attention to that a long time
[16:43] ago.
[16:43] >> Right? I mean, the same thing with
[16:45] uncertainty. Like, we we got this with
[16:46] tariffs originally, um, you know, last
[16:48] year when people were like, "I don't I
[16:50] had a lot of diversified portfolio
[16:51] managers come to me and say, 'Denise,
[16:52] this is a very uncertain environment,
[16:54] and in an uncertain environment,
[16:55] corporate America's not going to spend.
[16:56] If they don't spend, jobs aren't going
[16:57] to grow.'" And you say, "Okay, well, we
[16:59] can measure all of those things, and we
[17:00] can see if that's true." And the
[17:02] interesting part is when you quartile
[17:03] out uncertainty, the more uncertain the
[17:05] environment, the higher the odds of the
[17:07] stock market advancing, and the higher
[17:09] the odds that there's capital spending,
[17:11] meaning
[17:14] >> No, nobody thinks that way intuitively.
[17:15] >> But by the
[17:16] but it's like the Barron's head like the
[17:18] the covers. It's by the time it is so
[17:21] visible, it is more likely than not
[17:23] already discounted. Corporate America is
[17:26] already not spent. Corporate America is
[17:27] already not hired. The stock market has
[17:29] already worried about all the things
[17:30] that you're very visibly worrying about.
[17:32] And, I mean, to to put a fine point on
[17:34] it, I don't remember if we talked about
[17:35] it last time, but remember, I mean, the
[17:36] low in the market between like 1976 and
[17:39] 1985 was 1978 before either of the
[17:42] recessions happened. So, if you said
[17:43] like, "Hey, Denise, what's going to
[17:45] happen.
[17:46] We're going to have two back-to-back
[17:47] recessions and rates are going to go to
[17:49] 15%."
[17:50] >> Nobody buys that.
[17:51] >> But, then, if you said like, "I'm going
[17:52] to sell in '78. I'm going to get this
[17:54] right. I'm going to nail the risks. I'm
[17:55] going to get the risks right, and I'm
[17:57] going to buy back at the end of '82 when
[17:59] jobs finally started to recover." You
[18:01] lost 40% cumulative nominal returns.
[18:04] >> So, we saw a lot of worries in the first
[18:06] quarter of the year where the market
[18:08] didn't really seem to react to the news
[18:10] immediately, and there was a lot of
[18:11] people thinking like,
[18:13] "Does How is this happen The
[18:15] closure of the Strait of Hormuz was
[18:17] supposed to be a black swan type of
[18:19] event where oil goes up to $150 barrel,
[18:23] S&P closes limit down." Like, that's you
[18:25] know, it was a black swan type of
[18:26] outcome, and the market seemed to be
[18:28] sort of yawning past it.
[18:30] And, you had this weird dynamic where
[18:32] earnings estimates were rising, and
[18:35] price was coming down a little bit, and
[18:36] so you saw the the valuation compress in
[18:39] a big way. So, you went through history,
[18:41] and you looked at this Daniel chart one,
[18:43] please, of the valuation compress
[18:45] compression over a 6-month period. What
[18:48] were you saying during this period of
[18:51] the multiple coming down with this weird
[18:54] dynamic of earnings skyrocketing?
[18:56] >> Yeah, so it's an interesting dynamic.
[18:57] This is rare that you have this kind of
[18:58] multiple compression. But, if you go
[19:00] like reverse to when we started the
[19:02] year, I had a lot of people, you know,
[19:04] asking me just even even from a
[19:06] institutional perspective like,
[19:08] "How can you be bullish on the market
[19:09] when the market is up so much over the
[19:11] last 3 years, and stocks are expensive.
[19:13] And the problem is again quantitatively
[19:15] neither of those things bend your odds
[19:18] for underperformance of equities, right?
[19:19] So the more the equity market goes up,
[19:21] you guys know like momentum usually
[19:23] begets momentum, which is not to say
[19:24] that it's 100% of the time, but it is to
[19:26] say that if you bet on that, if you want
[19:28] to take the other side of stocks going
[19:29] up, you have to accept the fact that
[19:31] it's a lower likelihood, not a higher
[19:32] likelihood and you know something that
[19:34] the stocks don't know. Uh second same
[19:36] thing for, you know, valuations. Like
[19:38] there's no quartile difference in terms
[19:40] of the odds of an equity market advance.
[19:42] Coming into the year, for me what has
[19:44] been different since 2022 is the equity
[19:46] market is just persistently fearful. You
[19:48] can measure it in valuation spreads on a
[19:49] rolling measure of the VIX, right? I
[19:51] mean during the tariff tantrum, um you
[19:53] know, you saw the VIX spike to 50. I
[19:55] think during this tantrum we saw it
[19:57] spike to 30. Um when you sort of roll it
[20:00] out through time, when you look at the
[20:02] the fear in the equity market that has
[20:03] been persistent relative to the fear in
[20:05] the credit market, that's where you
[20:06] start to get this linear relationship
[20:08] that you potentially want to take the
[20:10] other side and the market has more
[20:11] likelihood to climb the wall of worry.
[20:14] >> I'm so glad you said that because people
[20:16] point to the stock market and say, "What
[20:17] an all-time high. What do you mean
[20:19] there's fear in the market?" Even last
[20:20] week or 2 weeks ago when the S&P fell
[20:22] 2%. It was nothing. The put-call ratio
[20:24] spikes immediately. There is a lot of
[20:26] fear and it's really hard to have both
[20:29] of those thoughts in your head at the
[20:29] same time cuz you feel like, "Oh, this
[20:31] is bubble everybody's in." No, and that
[20:33] is why it keeps grinding higher.
[20:35] >> Correct. I I completely Yeah.
[20:36] >> What would be your signal though for
[20:38] that unwant Like what what would have to
[20:40] happen for you to say
[20:42] there's not enough fear in the market,
[20:43] multiple expansion again?
[20:44] >> Yeah, so the the 15% down sort of
[20:46] confirmed that whole thing.
[20:49] >> though it is to have 29% earnings growth
[20:51] and outrun that with price.
[20:52] >> Yeah.
[20:53] >> We would have to have like a 70% rally
[20:55] in the market in order to get multiple
[20:57] expansion.
[20:57] >> god we didn't have that happen. That
[20:58] would That would have been scary.
[20:59] >> Well, that's exactly. So when people say
[21:02] like what's what could be the problem,
[21:03] something like that where you see very
[21:06] little fear in the equity market or a
[21:07] bubble like that in terms of that price
[21:09] advance or something like that looks
[21:11] more like that and good economic times
[21:14] top quartile you know GDP growth which
[21:16] we're still grinding it out at like two
[21:18] two and a half and we'll see where
[21:19] earnings growth ends up but you know for
[21:22] the most part it's been between 10 and
[21:24] 15.
[21:24] >> So don't don't you think it's easy to
[21:26] make the case that investors as a whole
[21:28] are being sober right now even though
[21:30] we're about to get to some of the crazy
[21:32] [ __ ] that's happening because there is
[21:33] obviously crazy [ __ ] happening. But I've
[21:35] said this to Josh a million times. In
[21:37] today's modern digital markets
[21:39] >> Yeah.
[21:39] >> in a bull market there will always be
[21:41] many maniacal behavior. Like that's just
[21:44] there will never not happen again.
[21:45] >> Yeah. And side shows.
[21:46] >> Yeah, of course. But in the aggregate
[21:48] the fact that we are not outpacing
[21:50] earnings growth I think the market is
[21:51] being pretty sober.
[21:52] >> Completely agree.
[21:53] >> All right. So
[21:55] rewind back to
[21:57] um
[21:58] I guess earlier in the year. I don't
[21:59] know know when we made this chart but
[22:01] remember the forward PE of tech next
[22:03] chart please Daniel and the forward PE
[22:05] of the S&P 500 converged.
[22:06] >> Yep. Yeah yeah.
[22:07] >> And we were like
[22:08] is this good is this bad this seems
[22:10] weird. All right. Well that was the fat
[22:11] pitch.
[22:12] >> Yep. We got it.
[22:13] >> Literally the forward PE of tech and the
[22:15] whole market converged for a minute.
[22:17] >> to buy all of these quote-unquote high
[22:19] flyers at the same multiple as the
[22:21] overall market.
[22:22] >> So we made this last week I forgot to
[22:23] put it in the in the deck but even
[22:25] better we saved a few Denise. The
[22:26] rolling 38 day performance since we made
[22:28] this chart or since those lines
[22:29] converged. Look at that fat pitch. Look
[22:31] at that home run.
[22:32] >> I know.
[22:32] >> What's was that plus 18%?
[22:34] >> So it's a total
[22:35] performance but of tech versus the S&P
[22:36] 500 that time period.
[22:37] >> Yeah I figured. Yeah no there's and we
[22:39] have the data going back to the 60s
[22:40] right? So I have it going back to the
[22:41] 30s. That's I don't really you have
[22:43] technology that I was like wow. You have
[22:46] to share that with me. There is there's
[22:47] a relationship the cheaper technology
[22:49] stocks have been relative to the S&P 500
[22:51] >> Tech in the 30s was booms.
[22:53] Booms were [laughter] very big. So um
[22:56] in in many ways the multiple compression
[22:59] is justified because the companies
[23:02] themselves are undergoing a
[23:04] transformation.
[23:05] They're going from capex light
[23:07] predominantly software businesses with
[23:10] crazy high margins,
[23:11] a little bit of R&D, a little bit of
[23:13] capex, but nothing crazy to 120% cash
[23:17] flow going into long-term infrastructure
[23:20] projects.
[23:21] Can't say they're capital light anymore.
[23:23] >> Right.
[23:23] >> Um maybe with the exception of
[23:27] uh I mean, even Apple would be a
[23:29] stretch. They're the only one not
[23:31] engaging in this capex frenzy. Their
[23:33] capex actually is down versus last year,
[23:36] at least so far. But like
[23:38] these stocks should not be trading at 35
[23:41] times earnings anymore. They are
[23:43] industrial. They're very modern
[23:45] industrials. What do you think about
[23:47] that?
[23:47] >> It's a great point.
[23:48] >> Well, I think it depends on their
[23:49] ultimate margin structure, which we
[23:51] don't know the answer to yet. I think to
[23:53] your point, like
[23:53] >> In this transition period while they
[23:55] build,
[23:56] they look more like heavy industrial
[23:59] companies.
[23:59] >> With a much higher margin structure and
[24:01] return structure. Currently, that's what
[24:02] I mean. So, what we know is today, that
[24:05] has not been true in the sense that they
[24:06] have spent more in terms of capex, and
[24:08] yet they have retained this margin
[24:10] structure. Now, we will see where it
[24:12] ends up. Again, like all estimates don't
[24:14] always come to fruition. What they will
[24:16] spend, maybe there will be bottlenecks.
[24:17] Maybe in fact technology will do what
[24:19] technology always does, which is make
[24:21] something, you know, very expensive and
[24:22] scarce, and then they will make it
[24:23] cheaper and abundant. Right? So, maybe
[24:25] this capex ends up not being as
[24:27] egregious as we think and doesn't weigh
[24:29] on free cash flow as much. So, there are
[24:31] all kinds of possibilities. I think that
[24:34] what was the debate in the bubble was
[24:36] that all of the spending was very
[24:38] clearly not associated with any margin
[24:41] or any earnings. And to date, the
[24:43] spending that we're seeing has been
[24:45] associated with
[24:47] >> So, we made that we've made that point
[24:48] before, and we've also made the sort of
[24:51] parallel point that the equity-funded
[24:55] bubble of 2000
[24:57] is very different than the cash flow
[24:59] funded bubble of today.
[25:00] >> Yes.
[25:00] >> So that though um they that may not stay
[25:04] true.
[25:05] I think half the backlog for AI CapEx is
[25:07] open AI and Anthropic.
[25:09] >> Mhm.
[25:09] >> And that money is very obviously has to
[25:11] come from IPOs or raised assets. So
[25:14] that's sort of equity equity issuance
[25:17] funded uh spending.
[25:18] >> Mhm.
[25:19] >> But like the CapEx itself is coming
[25:21] directly from the companies that are
[25:22] most capitalized to actually do this
[25:26] better.
[25:26] >> also look at Meta. So they've obviously
[25:28] spent a lot of money on AI and Reels,
[25:30] which is a 3-year-old product, is now
[25:32] doing 50 billion dollars in annualized
[25:36] revenue. That's more than Netflix. And
[25:37] that is a direct result of the AI spend.
[25:40] >> Right. Reels has become the world's most
[25:42] addictive product. It's it's literal
[25:44] heroin. If you If you walk through an
[25:46] airport,
[25:47] like and just look to the left, look to
[25:49] the right, walk through a terminal,
[25:51] you will see eight out of 10 people are
[25:53] staring at their rectangle.
[25:55] Eight out of 10.
[25:56] >> Mhm.
[25:56] >> If you If it's kids, it's 10 out of 10.
[25:59] >> Mhm.
[25:59] >> Um and that's Reels. So a little bit
[26:02] TikTok, but a lot of Reels. And they've
[26:04] used AI to essentially rewire our
[26:07] brains.
[26:07] >> Mhm.
[26:08] >> We can't stand in an elevator and not
[26:10] look down at the phone, right? It's like
[26:12] it's captivated. So AI has enabled just
[26:15] an incredible step change in how
[26:18] addictive uh
[26:20] Meta is and how good they are at serving
[26:22] ads more more most importantly.
[26:24] >> Right. Which is how they generate
[26:25] >> So the biggest beneficiary of all this
[26:27] spend in the market today and the area
[26:30] where if somebody said, "Michael, what
[26:31] do you mean the market is sober? Have
[26:33] you not looked at semiconductors?"
[26:34] >> Yeah.
[26:34] >> Okay, fine. Point taken. So chart three,
[26:36] Daniel, please. The SOX index is 69%
[26:41] above its 200-day moving average,
[26:44] >> Yeah.
[26:44] >> which is unlike anything going back to
[26:47] So I guess we only have data going back
[26:49] to 2002 here.
[26:49] >> Okay.
[26:50] >> Um but we've never seen anything in the
[26:52] last 25 years like this. It is going
[26:54] straight up. We spoke
[26:55] Josh and I were talking about Micron,
[26:57] how it just joined the trillion-dollar
[26:58] club. It's the 11th stock, and I guess
[27:00] Entropic is on its way. So, on Tuesday,
[27:03] UBS raised its Chart 4, Daniel, please.
[27:06] UBS raised its price target for Micron
[27:09] to $1,625
[27:11] from $535,
[27:14] more than double its closing price on
[27:16] Friday of $751.
[27:19] >> Without commenting specifically on
[27:20] Micron,
[27:21] >> [clears throat]
[27:22] >> you would agree this recent development
[27:25] of these memory stocks and Korean stock
[27:28] market and
[27:29] >> All related, right?
[27:30] >> some semiconductors that Denise is not
[27:32] specifically talking about, you would
[27:34] agree this is an area that's causing
[27:36] portfolio managers and market watchers
[27:39] to be like,
[27:40] >> Wait a minute. What's going on?
[27:41] >> I'm getting shades of Cisco, Lucent, JDS
[27:46] Uniphase. Like, I'm getting I'm getting
[27:49] those feelings back from 25 years ago.
[27:51] You'd agree there's some element to
[27:53] that.
[27:53] >> Yeah, so that's where I think the data
[27:54] is really interesting.
[27:55] >> Should we short Micron?
[27:56] >> [laughter]
[27:57] >> I'm just teasing you.
[27:58] >> I know you're teasing me. I want to
[27:59] answer. It doesn't matter anyway. So,
[28:01] no, I think that's a really interesting
[28:02] point. In terms of like, when you
[28:03] aggregate it together, forget Micron or
[28:05] any individual stock, and just aggregate
[28:07] all the semiconductors together, you go,
[28:08] "Okay, well, what's happened over the
[28:10] last 6 months, right? They're up 70%.
[28:12] What's happened over the last year?
[28:13] They're up 100%." And now, let's look at
[28:15] the data. Let's just pretend, again,
[28:16] back to sort of all the charts, like,
[28:18] let's pretend we don't know the answer.
[28:19] And let's be open-minded. Now, you look
[28:21] at that, and you could say, "Okay, well,
[28:23] it's been up 100% before over the last
[28:25] year." And two things. One, it's exactly
[28:28] in line with the third earnings growth.
[28:30] And two,
[28:31] >> That's important.
[28:32] >> And it gets more important in a second.
[28:34] And two, if I bought it every time it
[28:36] was up 100%, clearly the bubble was one
[28:39] instance that was negative, but more
[28:40] often than not, like 55% of the time, it
[28:43] goes on to outperform again the next
[28:45] year. The interesting part is, let's
[28:46] forget semiconductors for a second.
[28:47] Let's take all of the industries going
[28:50] back to the '60s for anything in any gig
[28:52] sector and say, "Well, what if I bought
[28:54] them when they were up 70% to 100%?"
[28:56] >> Any sector that's up 70% to 100%?
[28:58] >> industry, industry. So, one one click
[29:00] down. So, that'll be it's only happened
[29:02] like 2% of the time, you know,
[29:04] historically. But, every sector kind of
[29:05] has some participants. 65% of the time,
[29:08] they go on to outperform.
[29:10] >> That's a lot.
[29:11] >> Right? Surprising, too. Which is sort of
[29:13] to the point of, "Wait a minute, is
[29:15] there something the market is not
[29:16] >> But, investors aren't stupid. Like,
[29:18] there's a reason why this happened.
[29:19] >> not doing this randomly.
[29:20] >> Because what the anomaly is has been
[29:23] earnings growth. So, over the last 2
[29:25] years, the price performance is less
[29:28] than the earnings growth have been for
[29:30] semiconductors as an industry over the
[29:32] last 2 years.
[29:33] >> Right.
[29:33] >> That's the anomaly. They've never
[29:35] compounded earnings like this without
[29:36] being down 100% or, you know, not 100%
[29:39] and then up 100%. But, now this up
[29:41] trajectory of let's call more than 50%
[29:43] has lasted more than 2 years. That's the
[29:46] difference than history.
[29:47] >> I think the average investor, they see
[29:49] the price.
[29:49] >> Right.
[29:50] >> So, they see like the Wall Street
[29:51] Journal had this great chart. The Wall
[29:53] Street Journal had this great graphic
[29:55] showing the time between reaching $500
[29:59] billion you know, whatever it was a long
[30:00] time ago. But, Micron it happened in how
[30:03] many trading days? Is that like I don't
[30:04] know. I can't see it doesn't say, but
[30:06] >> Yeah.
[30:06] >> 20.
[30:07] >> And it's ridiculous. The speed at which
[30:08] this happened. So, we made a chart
[30:10] showing that Micron we're showing its
[30:12] path in the S&P 500 over time. And a
[30:15] year ago, like not a year ago, it was
[30:17] the 127th
[30:19] largest stock in the S&P.
[30:21] It was a it was a less than $100 billion
[30:23] market cap just a year ago. And it's now
[30:26] number 11.
[30:27] >> 10 years ago, it was number 381.
[30:29] >> The speed the speed is is an amazing.
[30:31] So, Dennis, you have a chart showing the
[30:34] relative forward PE of of semis.
[30:36] >> Yep.
[30:37] >> And they tend to trade at a
[30:41] uh I don't know, if But, investors don't
[30:43] give them the the premium multiple.
[30:45] >> Right.
[30:45] >> So, I I had a friend of mine who credit
[30:47] to him, he's been in Micron for a while.
[30:49] He's made a lot of money. And I was
[30:51] saying like, "Hey, listen.
[30:53] I'm not like calling the top of Micron
[30:55] or anything like that. But, like
[30:56] when something goes up 5% a day,
[30:59] set some sort of exit plan just while
[31:01] you're sober. And maybe he's drunk on
[31:03] the on the gains. But, like cuz if and
[31:05] when this thing falls, it's just going
[31:06] to be disorienting for your brain. Like,
[31:07] I'm not making a short-term call. But,
[31:09] just have this conversation with
[31:10] yourself.
[31:10] >> 5% a day.
[31:11] >> Right.
[31:12] >> It'll fall 20% a week.
[31:13] >> Well, it just it just fell 30%. Like,
[31:15] after earnings. It just did. So, anyway,
[31:17] the point the point is this. He said,
[31:19] "Well, it's sold out for a year. It does
[31:21] it is it still a cyclical business?" And
[31:23] I would say, "Yes, but you know a lot
[31:25] more about this than I do."
[31:26] >> Well, I would say so the the trick with
[31:28] cyclical businesses, if they're cheap,
[31:29] right? That could be the peak in
[31:30] earnings. Right? So, that's to your
[31:32] point. Like, if this is still a cyclical
[31:33] business, then valuation doesn't doesn't
[31:37] look from a probability perspective the
[31:40] way it currently looks for
[31:41] semiconductors. Meaning that I have this
[31:43] linear relationship. The cheaper the
[31:44] stocks are right now over the last 10
[31:46] years, the more likely the stocks are to
[31:48] outperform. Right? So, I think some of
[31:50] what we're seeing right now is a
[31:51] changing business, right? We just talked
[31:53] about that in terms of earnings. They've
[31:54] never compounded like this. Now, whether
[31:56] or not like earnings is a peak, that
[31:58] part I don't know. But, what I can say
[32:00] is that the valuation compression that
[32:02] we just saw, again, that two-year stack
[32:04] in terms of the earnings growth, it's
[32:06] almost like a catch-up trade. And some
[32:08] of this valuation multiple is saying,
[32:10] "Look, I understand that there's a lot
[32:11] of fear in the market about what this
[32:12] might mean." Some of that's in the
[32:14] stocks. Right? Which seems absurd to
[32:16] your point. Like, back to your
[32:18] >> [snorts]
[32:18] >> to the point of like
[32:19] >> Yeah, there's fear in the stock. It's
[32:20] only up It's only up 8x.
[32:22] >> Exactly. So, it again, it sort of you
[32:24] have to sort of put the the case of yes,
[32:26] anything that goes up that much can also
[32:28] go down. But, when you think about
[32:30] measuring fear quantitatively and
[32:32] measuring valuation support, there's you
[32:35] know, 70% odds are not 100% odds. But,
[32:37] when you see a pattern like that, I
[32:39] think you have to be a little bit more
[32:40] open-minded that price might be
[32:41] understanding something that you don't
[32:43] understand.
[32:43] >> What's that 70% that you just mentioned?
[32:45] >> So, the odds of semiconductor perform
[32:47] outperformance over the next 12 months
[32:49] based on when your starting point is in
[32:50] that bottom quartile of valuation.
[32:52] >> you still think they're they're
[32:53] cyclical?
[32:54] >> Uh yeah, but the nature of the cycle
[32:57] itself is probably changed. So, maybe
[32:59] the cycle used to be 3 years and now
[33:01] it's 7 and we won't know until we get to
[33:03] 8 and look back and say, "Oh, that was
[33:06] the peak of the cycle." One of the
[33:07] things that distinguishes this from the
[33:09] 2000 bubble, Micron in particular,
[33:12] so I'm old enough to remember 2 years
[33:14] ago when they were comparing Nvidia to
[33:16] to Cisco. Um
[33:18] >> [laughter]
[33:18] >> and we don't talk that uh
[33:21] Nvidia Nvidia like basically has become
[33:24] Taylor Swift and Micron is Olivia
[33:26] Rodrigo and like the the young younger
[33:29] girls don't care about Taylor Swift
[33:31] anymore. Okay. So, um
[33:34] so now we're not saying we're not saying
[33:37] Nvidia Cisco, maybe we're saying Micron.
[33:39] So, people are pointing back to like the
[33:41] um the telecom fiber optic boom and how
[33:46] like they laid all this fiber and then
[33:47] nobody needed it and all those companies
[33:49] went bankrupt and then it wasn't till 5
[33:51] years later that YouTube came along and
[33:54] all that fiber that they thought was
[33:55] worthless and I I was in these stocks
[33:58] like MFNX and like I owned all of these
[34:01] things.
[34:02] Um
[34:04] I don't love that comparison or that
[34:07] analog because
[34:09] Micron's memory is not being installed
[34:12] in a data center and then collecting
[34:14] cobwebs. Like the stuff that they're
[34:16] selling is put into use immediately.
[34:19] Now, you could argue whether or not that
[34:21] will continue, but that's not a great
[34:23] comparison to Cisco and and fiber optic
[34:26] cable in in the year 2000.
[34:30] This is not CAPEX with the expectation
[34:32] that maybe somebody will need it.
[34:34] >> Right.
[34:34] >> They're literally saying we're short
[34:36] compute based on today's demand. Forget
[34:38] about what we think demand is going to
[34:40] be in 3 years.
[34:41] >> Yeah.
[34:41] >> Do you think that that point is made
[34:44] enough on on the bull side? Do people
[34:46] understand it really or
[34:48] >> I mean, I think it goes back to the like
[34:49] idiosyncratic versus, you know, systemic
[34:52] in terms of like how you add it up. So,
[34:54] yes, are there individual stocks where
[34:56] you could sort of make this comparison,
[34:57] but the problem is that in the '90s into
[34:59] that bubble, it was everybody, right?
[35:01] So, the median technology stock, their
[35:03] earnings peaked in 1996.
[35:06] >> Whoa.
[35:06] >> Right. That was the disconnect.
[35:09] >> Yeah.
[35:09] >> Right? I mean, this like could we get
[35:12] there? Sure.
[35:14] But we're a very far cry from there. The
[35:16] median tech stock is profitable.
[35:18] Obviously, the cap-weighted tech stocks
[35:19] are profitable. Operating margins are
[35:21] still increasing. Could we look back at
[35:23] some point and say this is the peak? But
[35:25] again, back to that, okay, let's pretend
[35:27] then this is the peak. What if then it's
[35:29] 1996?
[35:30] >> Mhm.
[35:31] >> Okay. Um do you think if Anthropic and
[35:34] OpenAI were public companies reporting
[35:36] financials on a quarterly basis, holding
[35:38] conference calls, and had ticker symbols
[35:40] that people could see,
[35:42] >> Mhm.
[35:42] >> [clears throat]
[35:42] >> they the visibility of where the
[35:44] spending is going and where the revenue
[35:46] is coming from
[35:48] would be would would be a better source
[35:50] of comfort to people?
[35:53] Because I think one of the issues right
[35:54] now is a lot of this CapEx is going into
[35:56] projects being paid for by Anthropic and
[36:01] OpenAI, and they don't have tickers.
[36:02] >> The circle door knob.
[36:03] >> don't talk to the public unless they
[36:05] want to promote something on on TV.
[36:07] >> Mhm.
[36:07] >> But they they're it's not a uh
[36:10] it's not the same as seeing a public
[36:12] company spending and then being like,
[36:14] okay, I get it though, they're also
[36:16] generating revenue. We're getting rumors
[36:18] of revenue about these companies.
[36:20] They're like casually mentioning their
[36:22] revenue
[36:23] at uh the Milken conference. Like, we
[36:26] don't have
[36:27] >> Right.
[36:27] >> we don't have the data at our fingertips
[36:30] and maybe that's why all the CapEx
[36:32] spending it's harder to tie it to
[36:35] uh revenue that we can actually see. You
[36:37] think that's an issue for investors? Is
[36:38] that maybe why there's so much
[36:39] suspicion?
[36:40] >> Uh yes, but I'm not sure transparency
[36:42] will solve the suspicion to your point.
[36:44] Like, I think there
[36:45] there are skeptics out there. I think
[36:47] the skeptics will probably continue and
[36:48] in some ways like I don't know, do we
[36:50] want comfort? Cuz so far it's been a
[36:53] decent investor setup. So, do we want do
[36:56] we need people to be more comfortable?
[36:58] I'm not I'm not sure the answer.
[36:59] >> That's a good question.
[37:00] >> Do we need drive Do we need that as a
[37:02] driver?
[37:03] >> Well, the people who are long right now
[37:04] don't need that. They're fine.
[37:06] >> One of the areas of the market where
[37:08] there might be too much enthusiasm and
[37:10] this is hard to say what's priced in or
[37:12] not, but it might be it might be the
[37:14] analysts. So, this is from BC Alpha
[37:18] Research. Um they grabbed this data from
[37:20] FactSet. Uh we're looking at net profit
[37:22] margin for every sector.
[37:25] And they're expected I mean, they're at
[37:27] all-time highs and they're expecting
[37:28] even more gains.
[37:30] >> Yeah.
[37:30] >> What happens if this doesn't come to
[37:33] fruition? I think you keep saying like
[37:35] the diffusion and the breadth of
[37:37] companies benefiting from this. Do you
[37:39] think that this is more likely than not
[37:40] that margins are going to keep going up
[37:41] cuz this to me is the this is it. This
[37:43] is the this is the whole kit and
[37:44] caboodle.
[37:45] >> Right. Yeah, so I would say let's look
[37:46] at the forward indicators in terms of
[37:48] what's correlated to margins and the
[37:50] biggest correlation to margins is unit
[37:52] labor costs. So, labor especially when
[37:55] you sort of compound it for
[37:56] productivity, that's you know, corporate
[37:58] America's biggest for the most part
[38:00] cost, which is not to say that there's
[38:02] not other input costs, but that's the
[38:03] main I would say that the main
[38:05] corollary. And so, when you look at unit
[38:07] labor costs over time
[38:08] >> Yeah, so uh most sectors, the vast
[38:11] majority of sectors and then when you
[38:12] aggregate it up for the market overall
[38:14] without a doubt. So, I think you have
[38:15] this unique combination of unit labor
[38:17] costs are in the bottom quartile of
[38:18] history, right? So, that is very rare
[38:21] relative to like you know you know 3%
[38:24] inflation. So it's partly because wage
[38:26] pressure has been, you know, uh
[38:28] continued, I would say, with, you know,
[38:32] in conjunction with productivity
[38:33] advancements. So that has the
[38:34] correlation to profit margin. So the
[38:36] lower unit labor costs have been, direct
[38:39] relationship, the higher corporate
[38:40] profit margins usually are.
[38:42] >> have to put token spend back into the,
[38:44] you know, the labor costs?
[38:46] >> Why?
[38:46] >> Because a lot of the
[38:48] >> That's on a cap ex.
[38:50] >> human is being spent on the robots.
[38:52] >> Already?
[38:53] >> machines.
[38:53] >> Uh not yet. I would say from a
[38:55] proportion perspective, not yet. Maybe
[38:57] that will change, but I don't think
[38:59] we're there yet.
[39:00] >> Oh, so like we're saving money by hiring
[39:02] people, but we're just reinvesting that
[39:04] money into compute?
[39:06] Like that argument?
[39:07] >> Yeah. Yeah. And so but I don't think
[39:09] that that's where the productivity is
[39:10] coming from quite yet. But I do think
[39:12] that wage growth has been restrained,
[39:13] productivity is on the uptrend, and that
[39:15] usually makes corporate America more
[39:16] profitable. Again, back to just
[39:18] relationships, right? And then you add
[39:20] in that fact, too, so you go, "Okay, so
[39:21] then these are the expectations, you
[39:23] know, they continue, but yet we're
[39:26] seeing this, you know, persistent fear
[39:27] in the equity market and this multiple
[39:29] compression, saying that some people are
[39:31] already pricing in the fact that it
[39:32] won't continue. Meaning that there's
[39:35] already the fear that there are these
[39:37] risks. So you end up in the same
[39:39] situation where the forward drivers do
[39:41] suggest that it's more likely than not
[39:43] the profit margins are higher rather
[39:45] than lower, and the market doesn't
[39:46] believe it.
[39:47] >> Let's talk about the diffusion that you
[39:49] spoke of.
[39:49] >> Yeah.
[39:50] >> Um
[39:51] I think this is one of the most unsung
[39:53] aspects of the bull market this year.
[39:56] Last year we talked about it a lot. The
[39:58] financials had a great year.
[39:59] >> Yeah.
[40:00] >> There's a lot of money to be made in
[40:01] things other than tech last year.
[40:03] >> Yeah.
[40:03] >> This year I feel like the focus has gone
[40:05] back to AI cap ex being the only game in
[40:08] town. Um but here's a chart 11.
[40:12] This is the S&P 493.
[40:14] >> Mm. Yeah.
[40:15] >> Um [clears throat]
[40:16] the earnings revisions
[40:18] >> for the first quarter
[40:19] and
[40:21] I I I feel like this is I feel like this
[40:24] is trending in the direction that you'd
[40:25] want it for the overall market.
[40:27] >> Right.
[40:27] >> So, it's like more more upside from more
[40:30] companies that are not uh Mag 7.
[40:33] >> That's correct. I think it's a unique
[40:34] setup in the sense that there's been a
[40:36] big divergence between cap weighted
[40:38] earnings growth and equal weighted
[40:40] earnings growth. And while cap weighted
[40:41] earnings growth has been, you know, fine
[40:44] and good for the last 3 years, equal
[40:46] weighted earnings growth has actually
[40:47] been contractionary. From a duration
[40:49] perspective
[40:50] >> Smaller companies have not had the same
[40:52] earnings growth.
[40:53] >> Correct. And I would say not only the
[40:54] same earnings boost, we're actually
[40:56] seeing earnings decline.
[40:58] >> Yeah.
[40:58] >> From not a magnitude perspective like we
[41:01] saw in other other recessions, but from
[41:03] a duration perspective it was as long as
[41:05] those recessions. So, that's why like
[41:06] 2022 was kind of recessionary from a
[41:09] corporate America profit perspective. It
[41:11] wasn't it was a full employment
[41:13] recession and this is a full employment
[41:14] recovery, but this is just now getting
[41:17] back to a situation where equal weighted
[41:20] earnings growth can grow and be durable.
[41:22] And from a pattern perspective, you see
[41:24] the symmetry between the duration of the
[41:27] decline and the duration of the support.
[41:30] >> was the duration of the decline for?
[41:32] >> 3 years?
[41:34] >> So, what where are we in this earnings
[41:36] recovery for the 493?
[41:38] >> Like we're 4 months.
[41:39] >> 4 months?
[41:40] >> Yeah. Yeah. I mean, I started writing
[41:42] about it in the beginning of the year
[41:43] that we're just really getting started.
[41:46] >> So, the the Mag 7 the Mag 7 are up 6.6%
[41:49] year-to-date.
[41:50] >> Yep.
[41:51] >> Uh
[41:51] >> Which is underperforming the market.
[41:52] >> X Mag
[41:53] >> Right.
[41:53] >> X Mag is up 10 and a quarter percent.
[41:56] So, I thought this is a this is really
[41:58] welcome welcome sight. Daniel, chart
[42:00] five, please.
[42:02] The top 10
[42:04] um stocks in the S&P 500 in terms of
[42:06] what's contributing to the overall gain.
[42:09] Google is number one.
[42:10] The fact that Micron is number two is so
[42:12] insane. It started the year at a hundred
[42:16] billion dollars and it's the number two
[42:18] contributor. It's added a hundred plus
[42:20] basis points to the overall index. It's
[42:23] remarkable. After that, you've got
[42:24] Nvidia, Apple, AMD, Amazon, Intel,
[42:27] Broadcom, Sandisk, and Lam Research. So,
[42:30] we're noticing a theme here, okay?
[42:31] Obviously. But, they all add up to 2.3%.
[42:34] Guess what? The index is up 10%. Pretty
[42:37] damn good.
[42:38] >> Yeah.
[42:39] Well, that's why it's interesting when
[42:40] you talk about people saying oh, the
[42:41] market's dependent on the Mag 7. The Mag
[42:43] 7 underperformed for the better part of
[42:45] the last 18 months.
[42:46] >> And they themselves are diverging from
[42:48] each other.
[42:48] >> Correct.
[42:49] >> Which I love.
[42:49] >> Correct. Which means we'll come we'll
[42:51] have to come up with another acronym or
[42:52] something.
[42:53] >> Well, we're going to have to add SpaceX
[42:54] to that to Mag 7. It's going to be Mag
[42:56] 8.
[42:57] >> Tough acronym.
[42:57] >> Okay.
[42:58] >> [laughter]
[42:58] >> Right. But, it's it's going it's
[43:00] definitely going that direction.
[43:01] >> Do you want to do this one?
[43:02] >> Which one?
[43:03] >> Margins outside tech?
[43:04] >> All right. So, this is also very
[43:06] welcome.
[43:08] Margins outside tech.
[43:09] >> Is this AI basically the question?
[43:11] >> Yeah, so it What What do you think?
[43:13] >> Why are Why are margins expanding at
[43:14] this rate outside of technology
[43:16] companies? Cuz they're the users of AI
[43:19] and they're expanding their margins?
[43:20] It's too early to bet the store.
[43:21] >> think it's too early. I mean, you're
[43:22] definitely seeing productivity
[43:24] advancements in specifically in
[43:25] software, but I don't think it's diffuse
[43:28] relative to the rest of corporate
[43:30] America. And again, I would go back to
[43:32] the If you ask me what's sort of the the
[43:35] driver behind that, I would go
[43:36] [clears throat] back to the pattern of
[43:37] unit labor costs, right? And that's sort
[43:39] of the the driver, at least the
[43:41] correlator, the tightest correlator that
[43:42] I've ever seen with corporate profit
[43:43] margins.
[43:44] >> So, I want to get your take on on this
[43:45] and and sticking with the rest of the
[43:47] market. So, small cap earnings, I forget
[43:49] what the what the overall estimate is,
[43:51] but it's like a it's like 30%. It's like
[43:53] a number that you're like wait, what?
[43:54] How? So,
[43:55] one of our guys, Chartkin Matt, compared
[43:58] the small cap earnings, the Russell
[44:00] 2000, versus the S&P 500, the expected
[44:03] earnings over the next four quarters.
[44:04] And the spread amongst the two is
[44:08] gigantic. Energy materials, I think we
[44:10] we sort of know what the story is there,
[44:12] at least in the energy side. But what's
[44:13] happening with financials? How are they
[44:15] expecting 66% earnings growth for small
[44:18] cap financials and just 7% for large
[44:21] cap? And similar things with real estate
[44:23] and discretionary, the spread is
[44:24] gigantic.
[44:25] >> Do you feel like it's the calculation in
[44:27] terms of the non-earners?
[44:28] And how you calculate that from people
[44:30] go cuz I mean at the end of the day like
[44:32] Russell 2000 what we went from we're
[44:35] close to at least 20% or more
[44:37] non-earners.
[44:38] >> cents and now they're going to earn 5
[44:39] cents.
[44:40] >> And how do you calculate
[44:41] >> Are they in? Are they out?
[44:42] >> I think I think with the 600
[44:44] directionally the same.
[44:45] >> Yeah, yeah, directionally the same, but
[44:46] I think from a magnitude
[44:48] >> So let's just say that we overstated it.
[44:49] But what do you think is driving this?
[44:51] Do you think it's
[44:52] cuz it's not the expectation of a Fed
[44:54] cut which we're going to talk about.
[44:55] >> No.
[44:55] >> Cuz that is going the opposite
[44:56] direction. So what do you think
[44:58] >> Correct.
[44:58] >> What do you think it is? Cuz you're
[44:59] right like this the the equivalent of
[45:00] small cap earnings have not broken out
[45:02] yet.
[45:03] >> Correct. No, I mean I I think it's all
[45:05] the beginning of a recovery, right? So
[45:06] and you're all saying this together.
[45:07] It's the manufacturing recovery that
[45:09] they're you know in linked linked to. So
[45:11] the same thing like when you look at
[45:13] ISM, right? ISM new orders inflected
[45:16] higher for the first time in 3 years,
[45:18] right? It's very rare that the
[45:19] manufacturing economy is in I would call
[45:21] maybe recession's overstating it, but a
[45:24] malaise for 3 years. Last time you saw
[45:25] that was like in the '80s, right? And
[45:27] you see a big corollary to smaller
[45:28] businesses and productive capacity in
[45:30] the US. So it is just starting to emerge
[45:34] to what normal growth actually looks
[45:36] like and that's where I think you get
[45:38] from a non-earner perspective to a flip
[45:40] to earner perspective. This is the
[45:41] beginning.
[45:42] Right? This is exactly where it starts.
[45:44] So it's all linked to that median
[45:46] earnings growth is finally emerging from
[45:48] what I would call a recession that's
[45:50] lasted the better part of 3 years.
[45:52] >> What do we do with inflation?
[45:54] >> In What do you mean? Buy or sell it?
[45:57] >> It's not trending in the right
[45:58] direction.
[45:59] It's changing the story of what we
[46:02] thought the Trump appointed new Fed
[46:04] chair would be able to do, would want to
[46:06] do.
[46:07] >> Mhm.
[46:07] >> They just pushed the first rate cut of
[46:09] 2026 into December
[46:12] >> Mhm.
[46:12] >> uh in terms of the probability based on
[46:14] uh trade trading.
[46:16] Uh that probably, my guess, I don't
[46:19] think we get any kind of relief on the
[46:20] inflation numbers next month, the month
[46:22] after. I'm guessing they'll push that 26
[46:25] cut
[46:26] completely off the table and maybe start
[46:28] talking more about a hike.
[46:30] Uh
[46:31] what do we do with this as investors?
[46:32] >> Yeah, so I have a lot of thoughts on
[46:34] inflation. So, the interesting part is
[46:35] as an investor, right? Do we get any
[46:37] relief?
[46:38] Do we need relief?
[46:40] >> Do we need it?
[46:40] >> equity market investor
[46:42] >> have to cool off to 2 and 1/2 or can we
[46:44] just
[46:44] >> The The sweet spot for the equity market
[46:46] is between 3 and 4. Right? Inflation.
[46:49] Yes. So, I actually have a chart of
[46:51] that. I know it's ironic.
[46:52] >> Chart 15?
[46:53] >> Yeah. I don't think you have it. It's
[46:54] back there. Yeah, yeah, yeah. Yeah,
[46:55] yeah.
[46:56] >> So, I mean, so that's one irony, right?
[46:58] Which is what you know, like equities
[46:59] act like an inflation hedge, right? The
[47:01] The times when you don't want to own
[47:03] equities are when it's top quartile
[47:04] inflation is top quartile and rising.
[47:06] That's 4 and 1/2%. We can debate whether
[47:08] or not we're going to get to 4 and 1/2%
[47:10] from a core CPI perspective. I don't
[47:11] think we will. Uh and we'll talk about
[47:13] that next. But, that's the area that you
[47:15] don't want to own equities. Anything
[47:17] sort of like, you know, in this
[47:18] inflationary dynamic, which we're a part
[47:20] of, I would call it the middle
[47:21] quartiles. It's not the driver, right?
[47:24] Earnings growth is the driver. And
[47:26] again, if earnings growth is the driver,
[47:28] equities can be a valid inflation hedge.
[47:30] So, there's an interesting pattern
[47:31] there. As it relates to overall
[47:33] inflation
[47:34] So, this is again, this is I I don't
[47:37] want to say controversial, but So, if
[47:38] you look at core CPI and you take out
[47:41] shelter, if you say, let's call shelter
[47:43] a supply shock this time around because
[47:45] that's exactly what happened, right?
[47:46] Interest rates went up, everybody was
[47:47] locked in their mortgages, so nobody
[47:48] wanted to sell, so it's acting like a
[47:50] supply shock. If you look at core CPI
[47:53] ex-shelter, do you know what it was last
[47:54] quarter or last month? 2.3%.
[47:57] >> Oh.
[47:58] >> Right.
[47:58] >> The shelter component is what's making
[48:00] it look like it's way worse than it is.
[48:02] >> Yeah.
[48:02] >> Well, people really do care about
[48:04] shelter though.
[48:04] >> No, but I understand that they should
[48:06] care. It's not about what the consumer
[48:09] feels.
[48:09] >> Yeah.
[48:10] >> This is about how the Fed should manage.
[48:12] Right, those are different.
[48:13] >> Right.
[48:13] >> Right. So, the reason why you look at
[48:15] core CPI, and we'll get into energy in a
[48:17] second, but the reason why you look at
[48:19] core CPI is because if you're the
[48:20] Federal Reserve, you don't want to
[48:21] double down on a supply shock. Meaning
[48:23] that if oil acts like a tax hike, the
[48:26] last thing you want to do is add rates
[48:28] to mitigate something that you can't
[48:30] control anyway and make it worse.
[48:32] >> Sorry about the uh gasoline prices.
[48:35] Here's higher interest rates.
[48:36] >> Correct. So, that's why
[48:38] >> no sense to me.
[48:38] >> That's why they look core CPI. And the
[48:40] interesting part is, so when people are
[48:42] worried about higher rates this time,
[48:43] and you say, "Well, okay, we can observe
[48:45] that rates are going higher." But again,
[48:47] let's assume we don't know why. So, when
[48:49] you look at oil specifically, and you
[48:52] chart it out, we have a great chart of
[48:53] this. I don't know if you have it up or
[48:54] if you have it, but when you sort of
[48:56] quartile out the oil like advances that
[48:58] you see over time, 10% 20% all the way
[49:01] up to 60%, you say, "Is there a pattern
[49:03] between what has happened to oil over 6
[49:06] months and what the Federal Reserve will
[49:07] do over the next 12 months?" There's a
[49:10] negative pattern.
[49:11] >> Meaning you get out of reacting to it.
[49:13] >> The lower the probability that the Fed
[49:15] hike. 25% is not zero, but even when oil
[49:18] is up 60, what you see is only a 25%
[49:21] chance that the Federal Reserve hikes.
[49:23] Why? Because most of the time since the
[49:25] 1980s, you don't see a pass-through to
[49:27] core inflation. And by most, I mean 48%.
[49:30] So, it's not never.
[49:31] >> you to yourself.
[49:32] >> You said many investors, and Denise, you
[49:34] write on LinkedIn weekly.
[49:36] >> Yes.
[49:36] >> Okay. Many investors see higher oil
[49:38] prices as the factor that's increasing
[49:40] the odds of a Fed hike. But when you
[49:42] examine the data, oil-driven shocks have
[49:45] historically made the Fed less likely to
[49:47] tighten, not more, functioning more like
[49:50] a tax on the consumer
[49:51] >> That's great news.
[49:52] >> than a catalyst for broad-based price
[49:54] increases. And by contrast, what clear
[49:57] pattern emerges?
[49:58] >> Yeah, growth. Growth is the clear
[50:00] pattern. And the funny thing is, like
[50:01] when you look at I wrote a lot about the
[50:03] manufacturing recovery earlier on the
[50:04] year, and durable goods orders are
[50:06] actually in the top quartile of their
[50:07] range.
[50:08] >> Chart 14, Daniel.
[50:09] >> Yeah, so that's chart 14. And then you
[50:11] do see this pattern, right, between core
[50:13] capital goods, right? So the strongest
[50:15] core capital goods, that's the quartile
[50:16] we're in. You see that relationship, you
[50:18] know, that monotonic relationship
[50:21] between the higher the growth is in
[50:22] terms of durable goods orders, the more
[50:24] likely the Fed is to hike.
[50:25] >> And which quartile are we in right now?
[50:26] >> We're in the top quartile of capital
[50:28] goods, yeah.
[50:29] >> So you think So you think they're going
[50:30] to do it?
[50:31] >> I don't know. I mean, it increases your
[50:33] odds to 65%. Um I would say that again,
[50:36] you got to go with the base case is,
[50:37] okay, so something changed in terms of
[50:39] the probabilities. Let's be open-minded
[50:41] to the probabilities. Then the question
[50:43] becomes, okay, let's say they're going
[50:44] to hike. Do I care as an equity market
[50:46] investor? And that's the unique data
[50:49] set, which is you find out really
[50:50] quickly
[50:51] >> Chart 15, Daniel.
[50:52] >> [laughter]
[50:53] >> Which is it's not about oh, we're going
[50:55] by the magnitude.
[50:56] >> important. We so I don't know if you
[50:59] know this, I am a television star.
[51:01] >> [laughter]
[51:02] >> And we spend so much time on TV talking
[51:04] in binary terms about hikes versus cuts.
[51:08] What's good, what's bad. There's very
[51:10] little discussion of magnitude. So let's
[51:12] let's talk Let's get Let's get I'll sign
[51:14] an autograph after this, but let's get
[51:16] it Let's [laughter] get into it.
[51:17] >> I think it's interesting. So if there is
[51:19] growth, you usually see in these middle
[51:21] two quintiles or quartiles of the
[51:23] Federal Reserve hiking interest rates.
[51:25] So these two quintiles are 0 to 100,
[51:28] right? So if you're hiking like 25 basis
[51:31] points and maybe 100 basis points over
[51:32] the course of four meetings over the
[51:34] course of a year, those are your market
[51:36] odds, right? And they're higher odds of
[51:38] a market advance than baseline, right?
[51:40] So baseline 75%, and you would say, if I
[51:43] knew everything about what the Fed is
[51:45] going to do, whether they're cutting or
[51:46] hiking, what's my best probabilities?
[51:50] It's the Fed hiking by just a little.
[51:51] >> A small hike and a stock and a stock
[51:54] market that is not disturbed by it.
[51:55] >> Correct, because it's a reflection of
[51:57] the now determined to it. Right.
[51:59] >> Okay.
[51:59] >> And it's more like it's indicative of
[52:01] the fact that, you know, rates confirm
[52:03] the cycle that rates or the Fed followed
[52:07] the cycle rather than potentially create
[52:09] it. And if rates are a reflection of
[52:11] growth, the market's got no problem with
[52:13] it cuz they're focused on growth.
[52:14] >> How often do new Fed uh chairpeople come
[52:16] in and hike? I know it's not been like a
[52:18] million examples, but
[52:19] >> I actually don't know.
[52:21] >> Well, it ain't going to be this It ain't
[52:22] going to be this guy, I can tell you
[52:23] right now. Um it reminds me of the O.
[52:25] Henry story, The Gift of the Magi, where
[52:29] there's a husband and wife No, no.
[52:31] There's a There's a husband and wife,
[52:32] they each want to buy each other a gift
[52:34] and surprise each other.
[52:36] >> Oh, I do know the story. Yeah, yeah,
[52:37] yeah. Yeah.
[52:38] >> And but they don't have money and
[52:40] there's a whole thing that goes on. It's
[52:41] not important. Um but in the end
[52:45] uh he buys her this beautiful hairbrush.
[52:48] I don't know if it's like ivory or
[52:49] something. She cuts off all her hair for
[52:52] the money to get him a gift.
[52:53] >> Yes.
[52:54] >> So, there's some elements of that where
[52:55] it's like, all right, oil price spike
[52:57] definitely uncomfortable for the
[52:59] consumer, for business, high gasoline,
[53:01] very real.
[53:03] And then the reaction to that is
[53:06] well, we're worried about the reaction
[53:08] to that is that is going to make its way
[53:10] into other prices in the economy, which
[53:13] I understand.
[53:14] But then the reaction is going to be
[53:16] well, we're going to raise rates.
[53:17] >> Right.
[53:18] >> Well, first of all, you ain't going to
[53:19] change the price of oil by raising
[53:20] rates. So, what are you really doing?
[53:22] You're just exacerbating the high prices
[53:25] that you were worried about in the first
[53:26] place.
[53:27] >> I think that's correct.
[53:28] >> Okay. So, but they I mean, I'm not a
[53:30] PhD. Surely they understand this.
[53:32] >> Right. I do think that they
[53:33] >> If I understand this, they must.
[53:34] >> I would say that
[53:36] it's clear in the data, right? When you
[53:38] see in history the fact that the Federal
[53:39] Reserve is less likely to hike the
[53:41] bigger the spike in oil, I think that
[53:43] they see it exactly the same way, that
[53:44] oil is like a tax hike on the consumer.
[53:47] Um, and the interesting part, again,
[53:49] since the '80s, I mean, this doesn't
[53:50] include the '70s and eight like the big
[53:52] the big inflation spike, which is
[53:54] different because of unit labor costs.
[53:55] But, if you say like what are the odds
[53:57] that it does get passed through, I would
[53:58] say less than 50/50. And I think that we
[54:01] saw this movie with tariffs, right? In
[54:03] some ways, corporate America doesn't get
[54:04] to decide what it can pass through. The
[54:06] US consumer decides what it's going to
[54:08] absorb.
[54:09] And that's, I think, what's very
[54:11] different. So, if real incomes aren't
[54:13] excessive or, you know, we're not
[54:15] getting rained down in terms of 15% GDP
[54:17] coming out of COVID or something like
[54:18] that, if you have to spend more money at
[54:20] the pump or from a tariff perspective,
[54:22] more money on washing machines, then
[54:24] your marginal propensity to consume goes
[54:26] down in other areas, and their marginal
[54:28] ability to price goes down with it. So,
[54:30] you saw, again, I think, over the last
[54:32] 12 months, corporate America like trying
[54:34] to increase prices, and then quantity
[54:36] demand fell. And so, what did they do?
[54:39] They cut prices, right? To increase
[54:41] quantity demand. So, I I think
[54:43] >> see that? Autos, like airline tickets?
[54:46] >> Yes. Yes.
[54:47] >> that in some consumer goods.
[54:48] >> Yes.
[54:49] >> Right.
[54:49] >> Yes.
[54:49] >> So, forget about Fed Fed funds rates for
[54:51] a second, and let's talk about the
[54:53] 10-year and the longer end of the curve,
[54:55] which people have been nervous about
[54:57] over the last couple of weeks.
[54:58] Do you think that's appropriately priced
[55:01] given how strong demand and growth are,
[55:04] and therefore it's not necessarily
[55:06] something to be worried about?
[55:08] >> say it's not anomalous at all. Like,
[55:09] when you look at it Yeah, when you look
[55:11] at it relative to growth. I mean, again,
[55:13] it goes back to the like would we like
[55:14] it lower from an accommodation
[55:16] perspective? Mm, not clear in terms of
[55:19] the data. Lower rates are often a
[55:21] reflection of lower growth. So, no, and
[55:24] when you sort of quartile it out, and
[55:25] you say, "Okay, where we are relative to
[55:27] where GDP is or where it would be," you
[55:29] would say there's really nothing to see
[55:30] here from a pattern perspective.
[55:32] >> was the 10-year in the '90s? It was like
[55:33] 5 6%?
[55:35] >> way.
[55:36] Exactly.
[55:36] >> All right, so there are there are the
[55:38] IPOs are coming.
[55:40] SpaceX is looking like sometime in June.
[55:43] Who knows about the the frontier models
[55:46] Open AI and and Anthropic. But, let's
[55:48] just assume that at some point.
[55:50] >> So,
[55:52] we have a chart showing the actual money
[55:55] raised. And we did not inflation adjust
[55:56] this, okay? But, in 1998 and 99 and
[56:00] 2000, which was a legitimate IPO boom.
[56:02] Obviously, the the numbers were smaller,
[56:04] okay? Not inflation adjusted.
[56:05] >> You could say mania.
[56:05] >> But, it was a legit full-blown mania.
[56:07] >> Yeah.
[56:08] >> And it's possible
[56:10] that at some point over the next year or
[56:12] whatever, we're going to have as much
[56:14] supply coming to the market from SpaceX,
[56:16] Open AI, and Anthropic.
[56:18] I mean, this is the this is a big one.
[56:20] Do you think there is enough liquidity,
[56:22] enough willing buyers? Can the market
[56:25] take on this much new equity?
[56:27] >> the people listening and not before you
[56:28] answer, for the people listening, so
[56:30] Michael's chart is like you look at
[56:33] 1998, 99, and 2000. You had 34 billion
[56:37] worth of IPOs, then 65, then 65. That's
[56:40] 164 billion in 3 years of new equity
[56:44] issuance. Um
[56:47] contrast that with this year. If we were
[56:49] to get SpaceX, Open AI, and Anthropic,
[56:51] those three deals, we think, would add
[56:54] up to something like 170 billion would
[56:57] have to be raised.
[56:58] >> look way different like I mean, the
[56:59] >> And these numbers going up every minute.
[57:00] >> Yeah. [laughter]
[57:01] >> So, so three companies versus I don't
[57:04] know how how many IPOs we think in the
[57:06] '98 to 2000 period.
[57:08] >> Hundreds.
[57:08] >> But, don't we need to rebase it in terms
[57:10] of market cap?
[57:10] >> yeah, of course, of course.
[57:11] >> But, would if we rebased it in terms of
[57:12] market cap, wouldn't that look 25% of
[57:14] that?
[57:15] >> Yeah, probably.
[57:16] >> Right.
[57:16] >> All right. But, whatever. Let's just
[57:17] just it's a lot of money. Delete that
[57:19] portion from the show.
[57:21] >> No, [laughter] but this is something
[57:22] that people are worried about.
[57:23] >> Yeah, no, I understand. You guys know
[57:25] more than me about like IPOs. And
[57:27] clearly, you can look back in history
[57:28] and say IPO booms are at least
[57:31] correlated with some potential bust in
[57:34] the sense that they usually correlate to
[57:36] euphoria in the stock market, which is
[57:38] usually around boom conditions in the
[57:40] economy, boom condition in earnings,
[57:42] it's very diffuse. So, they all tend to
[57:44] happen together, you know, bullish
[57:45] sentiment, you know, exorbitant
[57:47] earnings, and by exorbitant I mean like
[57:48] top quartile, right? All of these top
[57:50] quartile indicators. We're not there in
[57:52] any other indicator.
[57:54] >> You talk but you talk to portfolio
[57:55] managers.
[57:56] >> Mhm.
[57:57] >> Is anyone talking about what they
[58:01] the fact that they might have to sell
[58:03] things to participate in some of these
[58:07] Like there's a certain amount of money
[58:09] you have under management. All right.
[58:11] So, now you have a company that you
[58:12] already know, if you're being
[58:14] benchmarked to the S&P
[58:16] or a growth index or the Nasdaq, you
[58:18] must own. You You literally must either
[58:21] own SpaceX or it crashes and you look
[58:23] like a genius or something in the
[58:26] middle, but like you have to do
[58:27] something.
[58:27] >> It's a rebalance challenge. I mean, I
[58:29] think that we've seen this over and over
[58:30] again with the Russell value and growth
[58:32] indices.
[58:33] >> Can the market handle 80s
[58:35] Uh we had a guest on our show a couple
[58:38] days ago. His math, let's assume it's
[58:40] the the case.
[58:42] He's saying it's like 74 billion
[58:45] uh they'll raise, and then if the green
[58:48] shoe is exercised, which of course it
[58:49] will be, be like 86 billion dollars.
[58:52] >> Okay.
[58:52] >> That money has to come from somewhere,
[58:54] especially if you think they're going to
[58:55] engineer a pop. Like there it's going to
[58:58] open It's going to open up like not
[59:00] down.
[59:01] >> Mhm.
[59:01] >> You probably need like 2x that in order
[59:03] to get a a pop in the stock.
[59:06] Somebody has to sell something. That
[59:08] money doesn't just come from
[59:10] like another planet. So, like is that a
[59:12] concern in the near term for investors
[59:16] in other tech stocks? Cuz I'm assuming
[59:18] that's where the money will come from.
[59:19] >> Yeah, I mean, we'll see in the near term
[59:21] anything can happen, right? So, in the
[59:23] long term, and by long term I mean,
[59:24] again, over the course of a year, which
[59:26] is generally my time horizon, it will be
[59:29] what will matter the most will be
[59:31] earnings.
[59:32] Right? So, you will get I'm sure you'll
[59:34] get more volatility or at least
[59:37] idiosyncratic volatility, maybe not at
[59:38] the higher highest level of the market
[59:40] for a time from an absorption
[59:42] perspective, but I think that that might
[59:44] be more short-term than you think, which
[59:46] is like I said, go back to the rebounds
[59:49] that we have. Again, this is a little
[59:50] bit of a different issue, but we've seen
[59:51] rebalances like that that are sizable
[59:53] before in Russell, you know, versus
[59:55] growth in 2000 going to sort of the
[59:57] mid-cap, and all of that, yes, there are
[59:59] absorption issues over the short-term,
[60:01] but over the long-term, and again, just
[60:03] a one-year time horizon, earnings is
[60:05] going to be the driver, and that will
[60:07] ultimately be the determinant.
[60:08] >> through this we'll get through this
[60:10] level of new equity issuance because the
[60:12] earnings will bring people back in as
[60:14] buyers.
[60:15] >> Correct.
[60:15] >> This would be a good time for buybacks
[60:17] to kick back in.
[60:18] >> [laughter]
[60:18] >> Yeah, we're going to get all this equity
[60:19] issues.
[60:20] >> Sticking with like the speculative
[60:21] stuff, does does does the speculation
[60:24] worry you at all? Is it a total
[60:25] sideshow? So, like
[60:27] the meme ETF from Roundhill, is it an
[60:29] all-time high? It's a relatively newish
[60:31] ETF, like they issued it I don't know,
[60:32] in the last 12 months, I think. It came
[60:34] out in October 25. Okay. Um it's at an
[60:37] all-time high in terms of price.
[60:39] All-time high.
[60:40] >> Oh,
[60:40] >> October 25.
[60:41] >> it own?
[60:41] >> So, the but my point is like the meme
[60:44] names are working.
[60:45] >> Yeah. Uh it owns not profitable tech.
[60:46] >> Yeah, Redwire, AST Space Mobile. So, all
[60:48] right, Space, Applied Optoelectronics, I
[60:50] don't know what that is, Iridium, so a
[60:52] lot of the quantum stuff, Applied
[60:53] Digital, Rocket Lab. The the the the the
[60:56] junk is working.
[60:57] >> Mhm.
[60:58] So, yeah, I did an interesting piece on
[61:00] this for risky tech, uh and because
[61:02] there's a lot of charts making the
[61:03] rounds. If you do like towards top
[61:04] quartile beta, right, or highest beta
[61:06] stocks within S&P technology, they were
[61:08] hitting all-time highs, and like the
[61:09] inflection was very similar to what we
[61:11] saw in 2000. The interesting part about
[61:13] that is when you sort of rebase it for
[61:14] relative to the S&P 500, they've
[61:17] actually lagged broader tech.
[61:19] >> Mhm.
[61:20] >> And the funny part is and I I had this
[61:22] chart. if you look at um if you just
[61:24] look at high beta tech versus tech, it's
[61:27] been in a downtrend since the '90s.
[61:29] >> Yeah.
[61:29] >> Like you generally don't want to own
[61:31] risk, and it was it sort of oscillated
[61:33] right back to the top of the range. So
[61:36] you'd say it worked in the way that it's
[61:38] worked other cycles, and you would say
[61:40] there's nothing anomalous to see here
[61:42] relative to the rest of technology. You
[61:44] could certainly say that because it's
[61:47] rallied so much, it's fairly expensive,
[61:49] and there are better portions to own in
[61:50] tech that are not high volatile. But you
[61:53] also wouldn't say that you would sell
[61:54] technology as a sector, meaning that
[61:56] even if risky tech underperforms, you
[61:59] still see the less volatile tech
[62:01] actually outperform to the tune of 75%.
[62:04] So it doesn't look when you start to
[62:06] normalize things in terms of risky tech
[62:08] relative to tech, and you sort of look
[62:10] at it relative to other cycles, nothing
[62:12] looks particularly anomalous. And then
[62:14] if you layer on the fact that, you know,
[62:16] sort of let's just get, you know, let's
[62:17] think that the median earnings recovery
[62:19] that I was talking about is right,
[62:21] that's exactly what you should see, a
[62:22] junk rally in the beginning that you
[62:24] generally speaking don't want to chase.
[62:26] >> So I want to you first of all, you're
[62:29] amazing.
[62:30] >> [laughter]
[62:31] >> You know that.
[62:34] I want to sum up for the people that um
[62:37] are
[62:38] listening, watching, but maybe didn't
[62:40] absorb every one of these very important
[62:42] things. The number one thing
[62:45] uh for me from this conversation
[62:48] is that we could be relatively early
[62:50] in the earnings growth cycle for the
[62:52] 493.
[62:53] >> Yeah.
[62:53] >> Is that right?
[62:54] >> That's correct.
[62:55] >> So we're all assuming like we're at the
[62:56] end of something because stocks have
[62:59] been going up for years. It feels like
[63:01] uninterrupted. I know it has been
[63:02] interrupted. But this concept that all
[63:05] of a sudden margins are expanding for
[63:07] small caps, the equal weight is seeing
[63:09] faster earnings growth than the mag
[63:11] seven, the 493 is is a better earnings
[63:14] story for this year.
[63:15] I don't think the average investor
[63:18] is aware of that or understands the
[63:20] meaning of that. And you're talking
[63:23] about this sort of symmetrical where we
[63:25] had 3 years of these companies' earnings
[63:27] being under pressure.
[63:29] Um and so what if we had 3 years of
[63:32] earnings expansion, margin expansion for
[63:34] everything that's not a mag seven?
[63:36] >> Yep.
[63:37] >> That might be the most under under
[63:38] appreciated aspect of the market. The
[63:40] second Do I have all that right?
[63:41] >> Yes. Absolutely.
[63:42] >> Okay. The second big takeaway is the
[63:44] multiple compression.
[63:45] And that's sort of a a favorable setup
[63:48] so long as it's not coming as a result
[63:50] of earnings falling.
[63:51] >> Correct.
[63:52] >> And the stock market falling faster.
[63:54] That's not what's going on.
[63:55] >> Correct.
[63:56] >> What's going on is people almost don't
[63:57] believe the growth can last. So we're
[63:59] seeing, okay, that's not a negative.
[64:01] >> more skepticism there is, the more you
[64:03] can climb the wall of worry.
[64:04] >> Yes. And then the third big point that I
[64:05] took from this is
[64:07] you don't really see the Fed as being a
[64:09] major issue in the second half of this
[64:11] year.
[64:11] >> Yeah.
[64:12] >> Did I miss anything?
[64:12] >> No, you summarized very well.
[64:14] >> good at this.
[64:15] >> Yeah.
[64:15] >> Professional podcast host.
[64:17] >> [laughter]
[64:17] >> You did too.
[64:18] >> I know.
[64:19] >> Certified.
[64:20] >> That's why I'm here.
[64:21] >> Jeff, fun?
[64:22] >> I did. I always have fun.
[64:23] >> your favorite part about living in
[64:25] What's your favorite thing about living
[64:27] in Boston?
[64:28] >> Uh I
[64:28] >> Is Boston nice in the summer?
[64:30] >> No.
[64:30] >> Okay.
[64:31] >> Not to me. So, I would say the fall. The
[64:34] fall is my favorite.
[64:35] >> What do you So,
[64:36] besides like you go to Duncan and like
[64:38] Matt Damon's standing there, like what
[64:39] else do you like about What's like the
[64:41] best Boston
[64:43] life thing? Uh
[64:45] >> The seafood.
[64:45] >> We cuz when we went up to see you,
[64:47] >> Yeah.
[64:48] >> we loved it. Like what's that
[64:49] neighborhood that we stayed in?
[64:51] >> The Oh, we we stayed Where did we stay?
[64:52] By right by your offices?
[64:54] >> called?
[64:55] >> Uh the
[64:56] uh Latter? Oh, you're in the Seaport.
[64:58] Oh, that's a fancy area.
[65:00] >> It's all like new buildings. Beautiful.
[65:02] >> to be parking lots.
[65:03] >> Okay. So, the seafood. So, so say more.
[65:05] >> I think, yeah. No, the seafood and I I
[65:07] would say the seafood um the seafood
[65:09] purveyors. I'd say the restaurants. Like
[65:11] I think Boston
[65:12] >> You don't strike me a lobster roll
[65:13] person though.
[65:14] >> No, I'm not a lobster roll person. Okay,
[65:15] are you? Why don't I strike you as a
[65:17] lobster roll person?
[65:18] >> Uh
[65:18] >> What do lobster roll people look like?
[65:19] >> Yeah, we just met. I love I love the the
[65:22] the uh
[65:23] pistachio cannolis at the North End.
[65:25] >> Oh, yeah. No, absolutely. Mike's Pastry.
[65:27] Yeah, yeah.
[65:28] >> What's the
[65:28] >> The Italian food's great. Yeah.
[65:30] >> what's the best What's the best seafood
[65:32] dinner in Boston?
[65:34] >> Oh, I In Boston, no. I have I would have
[65:36] to say my husband's uh cooking. I have
[65:38] to say. Yeah, yeah.
[65:40] >> good to him.
[65:40] >> Good answer.
[65:42] >> [laughter]
[65:42] >> All right.
[65:43] Uh we loved having you here. Uh
[65:45] >> Thank you so much.
[65:46] >> I want to let people know that you are
[65:48] um doing research for Fidelity. A lot of
[65:50] the stuff that you do makes it out into
[65:52] the public eye. Tell people where they
[65:54] can find more Denise Chisholm.
[65:56] >> Yeah, you can find it on LinkedIn. So I
[65:58] do share charts of the week and you can
[65:59] subscribe to the newsletter. That way it
[66:01] comes right into your email box as
[66:03] opposed to sort of filtering it through.
[66:04] I also write a monthly white paper. I
[66:07] also do my own not like you all do, but
[66:09] on podcast uh called Market Insights for
[66:12] Fidelity. They let me talk.
[66:14] >> Okay.
[66:14] >> me talk. But it's just me talking.
[66:16] >> situation.
[66:17] >> It's [laughter] a hostage situation.
[66:19] >> But it's good though. It's It's
[66:20] >> video. So just me talking. So for those
[66:23] who don't consume my research from a um
[66:25] not everybody likes to read. So for
[66:27] people who like to listen. Uh and I also
[66:29] do a quarterly webcast for clients um
[66:31] that is the quarterly uh sector and
[66:34] investment research update.
[66:35] >> So Fidelity clients can get access to
[66:37] that. Okay. Well, we think you're
[66:38] magnificent.
[66:39] >> Thank you.
[66:39] >> Uh you can come on our podcast anytime
[66:41] you want. You can do video with us.
[66:43] Thank you so much. Guys, follow Denise
[66:45] Chisholm on LinkedIn.
[66:47] And check with your Fidelity rep for why
[66:50] you're not getting her research. It's
[66:51] very good.
[66:53] All right. Uh we had an awesome time on
[66:54] the show this week. We did uh
[66:57] we did it all. Uh right? All right.
[66:59] Guys, thank you so much for listening.
[67:01] Thank you for watching.
[67:02] We'll see you soon.
[67:05] >> Oh.
[67:22] Oh.