GitHub Cuts Claude Copilot Costs via 94% Prompt Caching Target
Claude
A 10x cost leverage on cached tokens means context compaction often backfires financially, forcing teams to prioritize prompt stability and hybrid advisor-executor model routing.
## Background
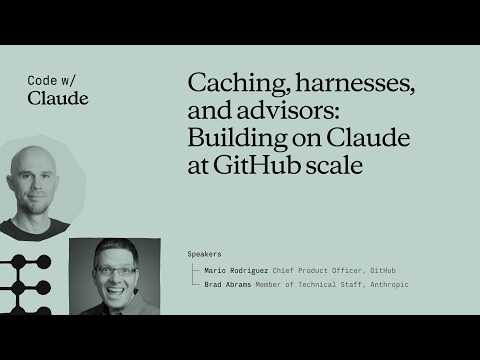
Published on May 6, 2026, on YouTube by the Claude channel, this video features GitHub Chief Product Officer Mario Rodriguez and Anthropic's Brad Abrams. The description outlines how GitHub's Copilot team deploys Claude to millions of developers across various interfaces, detailing how they drive quality up and costs down using strategies like prompt caching, rigorous evaluations, and the new Advisor framework.
## TL;DR
The presentation details the engineering patterns and optimization strategies GitHub uses to scale Claude across its Copilot platform while maintaining cost efficiency and developer flow. GitHub aims for a 94% to 96% prompt cache hit rate by maintaining static system prefixes and stabilizing multimodal cache affinity. To balance elite intelligence with low latency, they introduce architectural patterns like the 'Advisor strategy'—where Claude Haiku executes tasks and calls Claude Opus for complex reasoning—and the 'Rubber Duck' critic model for pivotal code review checkpoints. Finally, the team emphasizes evaluating new models through a methodical onboarding pipeline that prioritizes code 'survival rate' over simple acceptance metrics.
## Atmosphere & style
The presentation is energetic, collaborative, and deeply technical, carrying the vibrant and 'a little bit messy' spirit of a true developer-first conference. Mario Rodriguez delivers the insights with an enthusiastic, pragmatic candor, establishing an authentic peer-to-peer connection with the audience through hard-learned engineering lessons and real-world scale metrics. The dynamic shifts to an engaging, lighter tone when Brad Abrams joins the stage, mixing lighthearted banter about demanding product feedback with compelling live demonstrations that ground their high-level architectural strategies in concrete, tangible breakthroughs.
## Key takeaways
- [00:00](https://www.youtube.com/watch?v=y5TmF_6o6xk&t=0s) GitHub's core pillars for developer products focus on keeping developers in flow, gaining velocity, maximizing existing resources, and scaling with efficiency and trust.
- [00:00](https://www.youtube.com/watch?v=y5TmF_6o6xk&t=0s) Prompt caching is vital for GitHub's financial viability at scale, where a mere 1% improvement in caching efficiency yields millions of dollars in savings.
- [05:00](https://www.youtube.com/watch?v=y5TmF_6o6xk&t=300s) GitHub aims for a target cache hit rate between 94% and 96%, viewing anything around 70% as an engineering bug in prompt assembly or model calling.
- [05:00](https://www.youtube.com/watch?v=y5TmF_6o6xk&t=300s) Cached input tokens cost only 10% of standard input tokens, making frequent cache invalidation highly expensive.
- [05:00](https://www.youtube.com/watch?v=y5TmF_6o6xk&t=300s) To maintain high cache hit rates, engineering teams must keep dynamic content out of the prefix, avoid dynamic tool loading, and maintain cache affinity in multimodal environments.
- [10:00](https://www.youtube.com/watch?v=y5TmF_6o6xk&t=600s) The long context window myth is debunked by the fact that smaller context windows require aggressive compaction, generating output tokens that are 5x more expensive than input tokens and ruining cache efficiency.
- [10:00](https://www.youtube.com/watch?v=y5TmF_6o6xk&t=600s) The advisor strategy routes complex reasoning to a senior model (Claude Opus) to pass a hint back to a junior model (Claude Haiku), delivering high intelligence at lower costs and latency.
- [15:00](https://www.youtube.com/watch?v=y5TmF_6o6xk&t=900s) The 'Rubber Duck' critic model inserts Opus-driven critiques at crucial touchpoints: post-planning, post-implementation, and pre-test execution.
- [20:00](https://www.youtube.com/watch?v=y5TmF_6o6xk&t=1200s) Onboarding new models involves integrating with the Copilot API (CAPI) and cycling through intense offline and online (dogfooding) benchmark evaluations.
- [22:15](https://www.youtube.com/watch?v=y5TmF_6o6xk&t=1335s) Tuning a manageable number of specialized tool packages by surface area is preferred over having hundreds of tools, which causes model confusion.
- [22:15](https://www.youtube.com/watch?v=y5TmF_6o6xk&t=1335s) Product success should be measured by code 'survival rate' (whether accepted code actually remains in the codebase) rather than simple acceptance or activity metrics.
## Detailed walkthrough
### [00:00](https://www.youtube.com/watch?v=y5TmF_6o6xk&t=0s) Keeping Developers in Flow and the Power of Prompt Caching
Mario Rodriguez, representing GitHub, opens his talk by expressing his excitement to be back at "Code with Cloud." He notes that he loves developer conferences because they are "a little bit messy," "vibrant," and crucially, "dev first, not agent first." Rodriguez grounds GitHub's product decisions in a mission-driven vision to empower developers and advance human progress. When speaking with customers, he focuses on a core set of desired outcomes: keeping developers in flow, helping teams gain velocity, achieving more with existing resources, and scaling these efforts with efficiency and trust.
Operating at a massive scale—handling billions, and over time, trillions of messages—requires constant adaptation. Rodriguez notes that best practices change almost weekly, but he highlights three key pillars of their current approach: prompt caching, collaborating with Anthropic on "advisor" and "critic" capabilities, and managing model routing and defaults when new models drop.
Focusing first on prompt caching, Rodriguez explains that it is an absolute necessity for their financial viability: "Without that, you know, we're not dead, but oh my God. Like the amount of money that we would spend compared to what we do it incredible." He compares it to high-frequency trading, where a mere 1% increase in efficiency translates directly into millions of dollars saved.
- **GitHub's Core Pillars:** Flow, velocity, scale, efficiency, and trust.
- **Scale of Operations:** Billions of messages handled regularly, scaling toward trillions over longer horizons.
- **The 1% Rule:** A 1% improvement in caching efficiency yields millions of dollars in savings.
[05:00](https://www.youtube.com/watch?v=y5TmF_6o6xk&t=300s) Benchmarking, Cache Hit Ratios, and Avoiding Dynamic Prefixes
Rodriguez highlights a dashboard recently released by Anthropic that tracks cache hit ratios and messages sent to the Messages API, emphasizing that "without data is really, really hard to make decisions." He then shares a look at one of GitHub's internal dashboards, which compares performance deltas between models—specifically looking at Opus 4.6 versus Opus 4.7. When a new model drops, GitHub runs it through benchmarks (such as Terminal Benchmark 2 and their own internal suites) to evaluate performance before shipping it and monitoring the data over a 30-day optimization window.
To run their service at scale, GitHub must maintain a cache hit rate above 94% to 96%. Operating at 70% is so inefficient for their scale that it usually signals a bug in how they are calling the model or assembling the prompt. Because input tokens under prompt caching cost only 10% of the standard rate (a 10x cost difference), constantly invalidating the cache is incredibly expensive.
Rodriguez shares three hard-learned engineering lessons to keep cache hit rates high:
1. **No dynamic content in the prefix:** The system prompt must remain as static as possible. GitHub previously made the mistake of putting UUIDs in the system prompt, which constantly invalidated the entire cache. The prompt hierarchy should strictly flow from system prompt (most stable), to tools, to the conversation history, and finally to the last message.
2. **Avoid dynamic tool loading:** Changing the tools prefix dynamically will invalidate the entire subsequent conversation. Teams must implement rigorous regression tests to ensure experimentation with new skills and tools doesn't break caching.
3. **Maintain cache affinity in multimodal environments:** In a complex developer workflow, a user might call Opus, switch to a GPT model, call an open-source model, and then return to Opus. GitHub performs extensive engineering on their multimodal harness to guarantee that the cache affinity remains intact when the user loops back to a previously used model.
- **Target Cache Hit Rate:** 94% to 96% (anything around 70% is treated as a bug).
- **Cost Leverage:** Cached input tokens are 10x cheaper than uncached input tokens.
- **The Prompt Hierarchy:** System Prompt $\rightarrow$ Tools $\rightarrow$ Conversation $\rightarrow$ Last Message.
- **Surfaces Monitored:** VS Code, Copilot CLI, Cloud Coding Agent, IntelliJ, and Mobile.
[10:00](https://www.youtube.com/watch?v=y5TmF_6o6xk&t=600s) Debunking the Long Context Myth and Introducing the Advisor Model
Rodriguez addresses a common myth among customers: the idea that utilizing a longer context window is inherently more expensive. "The answer to us is no," he says. He explains a simulated test where they compared a smaller context window to a larger one using the same model. With the smaller window, the system had to perform three times more compaction (summarizing and condensing the message history). Because compaction requires generating output tokens to summarize the context, and output tokens are five times more expensive than input tokens, the smaller context window actually drove costs through the roof while significantly invalidating the cache.
Once prompt caching is optimized, the next challenge is routing the right level of intelligence to the user at the right time. To discuss this, Rodriguez invites Brad Adams from Anthropic onto the stage. Adams jokes about the feedback he gets from the Copilot team: "One of the pieces of feedback we got from the Copilot team is they really wanted Opus intelligence but it at haiku level prices. That sounds like a good deal, right?"
To solve this, Anthropic and GitHub developed the "advisor strategy," inspired by software engineering teams where a senior mentor guides a junior developer. In this setup, the junior model (Claude Haiku) acts as the "executor" that handles standard tasks. When Haiku encounters a highly complex problem that is beyond its capabilities, it calls a tool named "the advisor" (Claude Opus). Opus performs the heavy reasoning, passes a hint back to Haiku, and Haiku finishes the execution. This hybrid approach delivers near-Opus level intelligence at a fraction of the cost and latency.
- **Compaction Cost Multiplier:** Output tokens are 5x more expensive than input tokens, meaning aggressive context compaction often costs more than utilizing a larger context window.
- **The Advisor Strategy:** Haiku (Executor) handles the bulk of the work and calls Opus (Advisor) only when deep reasoning is required.
[15:00](https://www.youtube.com/watch?v=y5TmF_6o6xk&t=900s) Live Demo of the Advisor and the "Rubber Duck" Critic
Adams and Rodriguez transition to a live demo comparing two side-by-side instances of GitHub Copilot solving a complex brain teaser. On the left is standard Copilot running only Haiku; on the right is Copilot running Haiku paired with the new Opus Advisor tool. When the query is run, the standalone Haiku instance on the left spins its wheels, trying multiple incorrect paths like an eager but stuck junior engineer. On the right, Haiku quickly calls the Opus Advisor, which returns a precise hint. Armed with this context, the right-side instance successfully completes the task almost immediately, while the left side continues to struggle. Rodriguez notes that this capability will soon be released in the GitHub Copilot CLI.
Rodriguez then introduces a second algorithmic pattern they use to route intelligence: the "Rubber Duck" model. While the advisor model helps guide execution, the Rubber Duck acts as a critic by inserting critiques at pivotal moments.
In a video demonstration, Rodriguez shows a developer implementing a feature. Before writing code, the system pauses to request a critique from Opus (versions 4.6 and 4.5). The critic reviews the plan, the developer adjusts the approach based on the critique, and only then does the system proceed to execution. GitHub inserts this critique step in three core areas:
1. **After drafting a plan:** Catching errors during the planning phase yields the highest efficiency gains.
2. **After a complex implementation:** This acts as a "pre-code review," saving expensive tokens before a formal human code review.
3. **After writing tests but before running them:** In environments where running a CI test suite takes a long time, pre-checking the tests with a critic keeps developers in their flow state.
- **Rubber Duck Status:** Currently available as an experimental feature.
- **Key Critique Touchpoints:** Post-planning, post-implementation, and pre-test execution.
[20:00](https://www.youtube.com/watch?v=y5TmF_6o6xk&t=1200s) The Model Onboarding Process and the CAPI Pipeline
When a partner like Anthropic releases a new model, onboarding it into GitHub Copilot is a highly methodical process that has been refined over two and a half years. The journey begins by integrating the model into "CAPI"—the Copilot API. Once an endpoint is established, the team focuses heavily on optimizing the system prompts, tool interfaces, and context management within their multi-modal harness. While they rarely need to tweak the core agent loop anymore, they spend significant effort on context compaction and maximizing cache hit rates.
To evaluate the model, the team runs offline benchmarks alongside extensive internal "dogfooding" (online benchmarks) with Microsoft and GitHub developers. The findings are compiled into highly detailed documents and shared with Anthropic. This initiates a collaborative feedback loop to adjust the API or fine-tune specific model checkpoints before the final release.
- **The Multi-Modal Harness:** System prompts are updated in close partnership with Anthropic to ensure the model family behaves correctly.
- **Offline vs. Online Evals:** While offline benchmarks establish a baseline, they do not reflect the "tense reality" of real-world usage. The team relies heavily on online experiments and A/B testing, which can take days or weeks to fully tune.
- **Weekly Reporting:** Performance data is reported weekly to Anthropic and internal teams to ensure the right model is optimized at the right time.
[22:15](https://www.youtube.com/watch?v=y5TmF_6o6xk&t=1335s) Optimizing the Harness and Measuring Outcomes Over Activity
Optimizing the Copilot harness involves a four-step loop: building the prompt and context, calling the model, executing the tool, and appending the results back into the loop. The engineering team spends the majority of their time on prompt construction and tool execution. Having hundreds of tools is actually counterproductive because it introduces model confusion; instead, they tune specific tool packages for exact scenarios.
When measuring the success of these optimizations, the team emphasizes measuring actual outcomes rather than mere activity. For example, while a code acceptance rate is a decent metric, "survival rate"—whether the accepted code actually remains in the codebase or gets deleted shortly after—is a much more critical measure of real-world value.
- **Tool Management:** Tuning is done by surface area to prevent tool confusion and ensure correct permission checks during execution.
- **Survival Rate vs. Acceptance Rate:** "If you ended up accepting it, and then you ended up deleting it after, well, that actually did not accomplish the outcome overall."
- **Product Philosophy:** In the era of AI, product managers must avoid optimizing for isolated metrics that might inadvertently tank the overall user experience.
[25:00](https://www.youtube.com/watch?v=y5TmF_6o6xk&t=1500s) Conclusion and Key Takeaways
The session wraps up with a summary of the core strategies discussed: implementing prompt caching for speed and cost efficiency, utilizing the "advisor strategy" to critique plans across different model families, and continuously improving the harness through rigorous online measurement. The speaker thanks the audience, expressing excitement about the future of developer tools and hoping the audience walks away with actionable insights.
## Notable quotes
> [00:00](https://www.youtube.com/watch?v=y5TmF_6o6xk&t=0s) a little bit messy," "vibrant," and crucially, "dev first, not agent first. — Mario Rodriguez
> [00:00](https://www.youtube.com/watch?v=y5TmF_6o6xk&t=0s) Without that, you know, we're not dead, but oh my God. Like the amount of money that we would spend compared to what we do it incredible. — Mario Rodriguez
> [05:00](https://www.youtube.com/watch?v=y5TmF_6o6xk&t=300s) without data is really, really hard to make decisions — Mario Rodriguez
> [10:00](https://www.youtube.com/watch?v=y5TmF_6o6xk&t=600s) One of the pieces of feedback we got from the Copilot team is they really wanted Opus intelligence but it at haiku level prices. That sounds like a good deal, right? — Brad Adams
> [22:15](https://www.youtube.com/watch?v=y5TmF_6o6xk&t=1335s) If you ended up accepting it, and then you ended up deleting it after, well, that actually did not accomplish the outcome overall. — Mario Rodriguez
## Mentioned
GitHub, Copilot, Claude, Anthropic, Mario Rodriguez, Brad Adams, Opus 4.6, Opus 4.7, Terminal Benchmark 2, VS Code, Copilot CLI, Cloud Coding Agent, IntelliJ, Mobile, Claude Haiku, Claude Opus, Opus 4.5, CAPI, Microsoft
Operating developer AI tools at massive scale requires balancing cost and intelligence through strict prompt-caching discipline, tiered model routing, and measuring real-world code retention over simple usage activity, according to GitHub's Mario Rodriguez and Anthropic's Brad Adams.
Prompt Caching Discipline and Hit Targets (5:00)
Operating Copilot across billions of messages makes prompt caching economically vital, with Rodriguez noting that a 1% gain in caching efficiency translates to millions of dollars in savings. GitHub targets a 94% to 96% cache hit rate; rates near 70% are treated as configuration bugs. Because cached input tokens cost 10% of the standard rate, invalidating the cache multiplies input costs tenfold across surfaces like VS Code, Copilot CLI, IntelliJ, and mobile.
To maintain high hit rates, GitHub enforces strict engineering rules: system prompts must eliminate dynamic content such as UUIDs, tool configurations must avoid dynamic loading to prevent invalidating conversation history, and prompt structures must follow a strict hierarchy from system prompt to tools, conversation history, and the final message. Additionally, GitHub's multimodal harness preserves cache affinity when developers switch between different model families, such as Opus, GPT, or open-source alternatives, and return to an earlier model.
Context Compaction Pitfalls and Context Costs (10:00)
Rodriguez refutes the assumption that larger context windows are inherently more expensive than smaller ones. In simulated tests comparing context allocations on the same model, smaller context windows required three times more compaction through message summarization.
Because summarizing generates output tokens—which cost five times more than input tokens—aggressive compaction drove overall costs higher while repeatedly invalidating prompt caches. Consequently, managing longer raw context windows can prove more cost-effective than continuous summarization cycles.
Hybrid Routing with Advisors and Critics (15:00)
To combine high-end reasoning with lower operational costs, Anthropic and GitHub developed an "advisor strategy." Claude Haiku acts as the primary executor handling standard tasks; when it encounters a complex barrier, it calls Claude Opus as an advisory tool. Opus returns targeted hints, allowing Haiku to complete execution with lower latency and cost than running Opus exclusively. Rodriguez notes this pattern will be incorporated into the GitHub Copilot CLI.
Complementing this execution pattern, GitHub uses an experimental "Rubber Duck" critic model to inject Opus reviews at three touchpoints: after drafting a plan, after complex code generation as a pre-review before human evaluation, and before running long-duration test suites. Rodriguez reports that catching errors during initial planning yields the largest efficiency gains.
Evaluating Deployments and Code Survival Rates (22:15)
Onboarding new models into the Copilot API (CAPI) involves tuning prompt templates, tool interfaces, and context compaction before running offline benchmarks and internal Microsoft and GitHub dogfooding. Rodriguez cautions against tool proliferation, noting that offering hundreds of tools causes model confusion; GitHub instead scopes specific tool packages to particular scenarios.
To measure operational success, GitHub prioritizes outcomes over raw activity. Rather than relying solely on code acceptance rates, teams track the "survival rate"—measuring whether accepted code remains in the codebase or is deleted shortly after. Rodriguez emphasizes that optimizing for isolated acceptance metrics risks masking poor overall user experiences.
Rodriguez emphasizes that managing AI developer tools at scale requires aligning infrastructure with developer flow and verified code survival rather than superficial activity metrics, cautioning that rapid weekly shifts in model capabilities demand continuous harness tuning and empirical validation.
[0:00] Mario Rodriguez: a little bit messy," "vibrant," and crucially, "dev first, not agent first.
[0:00] Mario Rodriguez: Without that, you know, we're not dead, but oh my God. Like the amount of money that we would spend compared to what we do it incredible.
[5:00] Mario Rodriguez: without data is really, really hard to make decisions
[10:00] Brad Adams: One of the pieces of feedback we got from the Copilot team is they really wanted Opus intelligence but it at haiku level prices. That sounds like a good deal, right?
[22:15] Mario Rodriguez: If you ended up accepting it, and then you ended up deleting it after, well, that actually did not accomplish the outcome overall.
Original transcript
[0:00] Thank you. One, one, one. of GitHub, Mario Rodriguez. Hello, hello everyone. It great to be back at Code with Cloud I love developer conferences You know they a little bit messy They vibrant They still dev first not agent first And this is where we're to have fun. We're here to have fun and to learn together. Now, you're here because you want to learn more about the platform. And I'm here to kind of share with you some of the top things that we end up doing to running Copilot and all of our inference on top of this platform. Now, I want to get started with the why. Like, at GitHub, we're very mission-driven. You know, our vision is to kind of empower developers to provide the best tools out there to advance human progress. But when I talk to customers overall, I'm telling them something that they want to achieve. They want to achieve a set of outcomes. And for them, they want to keep their people in flow. They want to keep developers in flow. They want their teams to gain velocity. They got teams to actually achieve more with the people that they have. And they want to do this at scale. And to be able to do it at scale, you have to have efficiency and you also have to have trust And I start with this because almost every single product decision that I make kind of is grounded on these pillars Even when we actually talk about the platform and integrating with our cloud platform I want to make sure that I keep developers in flow. I want to make sure that teams gain that velocity. And I want to make sure that the companies can do that with intelligence and trust. Now, as I think about it forward, And I was thinking really hard, okay, like what do I want to say here? And if I was sitting there, what I would like to understand is, okay, how do you operate, you know, we do billions and billions, probably over a big enough time sense, trillions of messages against the platform. So I wanted to kind of give you the best practices, or maybe not even best practices, because things change so often, almost on a weekly basis. But kind of like the key learnings, the things that are at the bottom of almost all the decisions that we make to be able to integrate with the platform and achieve that skill and that efficiency that is necessary. So I'm going to divide it into three things. Number one is prompt caching. Without that, you know, we're not dead, but oh my God. Like the amount of money that we would spend compared to what we do it incredible right So just 1 efficiency on this means a lot to us It kind of like high frequency trading Just 1% efficiency means millions overall. So I just want to spend a little bit more on how we're doing that. The second thing is we're collaborating with Anthropic on capabilities to make sure that our customers are using the right inference, the right amount of intelligence at the right time. And then one of those is this advisor model. And we have two ways of looking at it, both through an advisor and a critic. So Brad and I will share a little bit more about that too. And then the third one is, okay, every time a new model drops, and if you're integrating with the platform, you know that this happens constantly, and you get a call at 5 a.m. on a Saturday, and it's like, hey, we're launching on Tuesday. So how do we actually go through that the right way? How do we make decisions like what is the default model to keep developers in flow? And how do we make the decisions to actually route to the right intelligence at the right time overall? So I'll start with this. And this is a dashboard. This is not our dashboard. But if you are on top of the platform, I believe Anthropic released this last week, we've got a little
[5:00] The preview of it and what allows you to understand is how you're doing, you know, like your cache hit ratios, how many messages you're sending against messages API, right? And I think this is great. This is the first step because without data is really, really hard to make decisions. Really, really hard. So if you haven't checked it out, please do so. Now, the one that I want to spend a little bit more time on, it's ours. And this is just one look. This is not the entirety of all of our dashboards that we have. But it's one where we take a look at deltas between models. In this case, I want you to look mainly at the left-hand side. That's Opus 4.6. And then on the right is 4.7. And then the next column is the delta between them. So when a new model drops, and sometimes we get it in EAP, we go ahead and run a set of benchmarks against it. So think about terminal benchmark 2. And then one of the suite, we have our own ones as well. And then we try to decide, OK, how is the model performing? And then we ship it, and then we pay attention to that data again. And then after a period probably of 30 days we probably done or maybe sometimes even sooner we done with all of the optimizations for that model Now you can see over here kind of the median cash tokens and at the end, the cash rate. For us to operate the service at scale, we need to run above 94, usually 94, 95, 96%. If we operate at 70%, that means usually that we have a bug, believe it or not. Like we're doing something not right, And then we need to change the approach on how we're calling the model, how we're assembling the prompt, how we're doing the end-to-end to keep that developer in flow. So we pay attention a lot to that. The same thing, if I want to actually change the cache rate from, I'm sorry, change the default model from 4.6 to 4.7, I need to understand what's the cache rate difference and what it actually means to me. Again, we make billions and billions of calls overall. So just 1% in that. in this case is 1.3%, means a lot to us. Now, you also have to take into account that from an input perspective, your cash rate is only 10% of the cost, right? So it's a 10x difference in there. So you're constantly invalidating that cash. That is not a very good thing overall because you going to be paying 10x more And then we kind of go across it In this case we did a baseline against 4 on it and then also on Haikyuu. Now, imagine it stays like this for a second, and there's a bunch of red, as you can see in this screen, overall. Then we have a decision to make. We have a decision to make to try to figure out how to get all of those reds into green. And it's not luck. It's a lot of hard work. And I want to make sure you understand that. It's a lot of hard work to get it. You know, maybe from 50% to 70% is not, because you're just kind of easy hanging through it. But from 70% to 80%, from 80% to 90% and 90% and above, there's a lot of hard work that goes into this and engineering. And there's three things that we'll take a look at. Number one is we make sure that there's no, and these are lessons learned. Like, we have made these mistakes before, and that's why I wanted to share it with you. We put no dynamic content in the prefix, right? Like, you need to keep that prefix as static as possible. And as an example, at one moment, we had UUIDs in the actual system prompt. And then we're getting constantly reset. And then that was invalidating the entirety of the cash rate. So remember system then there tools then there the conversation and then there the last message that you sending That kind of the hierarchy So you want to keep that system prompt as stable as humanly possible, no dynamic content on it. Then goes tools. We made a lot of mistakes in tools at times. If you're actually loading tools dynamically and you're changing that tools prefix, then all of a sudden everything, the entire conversation, gets invalidated again. So you have to do work, and you have to make sure you have a lot of regression tests, because you're going to be experimenting a lot with what? Skills and tools. Overall, in your end-to-end, you have to have regression tests to make sure that you're not affecting your tools. And then the third thing, then, overall, is that we need to have that cache affinity. And let me tell you, it's really hard when you're doing a multimodal hardness. So take, for example, Copilot. The customer can be calling, let's say, Opus, then calling a GPT model, and then going to an OSS model, and then coming back into Opus again. And then through all of that, I have to make sure that the next Opus call, that last one that happened, actually has the right cache affinity too. So we do a lot of work when it comes to our multi-modal hardness to make sure that that is guaranteed.
[10:00] So the next slide. So here's an example on something that we ran, and also to debunk and miss. So one of the key things that I heard many times, actually when I go to customers and they ask me about integrating with the platform is, hey, does long context mean that it's more expensive? And the answer to us is no. And this is a quick test that we ended up running. So there's a smaller context window, and you could see in there that my average compaction went up three times compared to the largest context window. This was something that we simulated. We kept the same model with the same context window. We just ended up doing more compaction on it and filling it at a rate. Now, the key thing over here, if you remember the math of how many input and output tokens ends up happening, is 5x, right? So for ops, it would be $5, $25 as an example. And in that case, whenever you do compaction, you get 4,000 tokens of output because you have to summarize the message, et cetera, et cetera. So whenever that happens, then you end up usually paying more because you end up doing a lot more compaction which means that your output tokens go through the roof and then your cash rate also gets a little bit more invalidated because of that too Well significantly invalidated because of that too So longer context windows does not mean you're spending more. In fact, what you have to understand is how compaction is being done. And depending on the scenario, you want to manage that for the user appropriately. So at a high level then, instrument cash risk rate have a dashboard that actually shows it to you invest the time to do it they're already shipping one for you so at the very least use that one but go and invest in deltas go and invest in pre the model launch and then post the model launch as well now no other efficiency matters until you see that one again like you want to be driving that from 50 70 90s overall and it will take a lot of hard work a lot of engineering time and then you want to measure per surface we have VS Code, which is one of the dashboards that we show you there. But we also have the Cobalo CLI. We also have our coding agent in the cloud. We also have IntelliJ, and we have Mobile, too. So it's a lot of surfaces that you're going to have to go and understand, either share the harness across them or then tweak individually So you want to have a very good kind of sense of we shipped something we regressed or not We shipped something we improved or not Now, another thing that I was telling you about is, OK, if you've got prompt caching already done, what about making sure that the right intelligence hits the user at the right time? And for that, Anthropic and us have been partnering on this advisor model. And what I want to do is bring Brad Adams from the Anthropik team to talk more about it. Go ahead. Brad. Thank you, Mario. Oh. Thank you, Mario, for being here. It's so great to have a partner like GitHub Copilot. The Copilot team gives such great feedback. We give them very little time to evaluate models before we launch, and they give great, insightful feedback. and it's true on our API features as well. In fact, if you're using the Claude platform, a lot of what you're seeing is thanks to the things Mario and his team are doing on Copilot. And it's actually one of those pieces of feedback that I want to talk about today. One of the pieces of feedback we got from the Copilot team is they really wanted Opus intelligence intelligence but it at haiku level prices that sounds like a good deal right opus intelligence so I don get to write the deals but what I do get to do is build fun API features so I want to talk about the advisor strategy and really the insight on the advisor strategy comes from software development teams We all know if you take a junior engineer and you give them a mentor who's a senior engineer, that junior engineer gets a lot better. Because the senior engineer looks over their shoulders, they review code, they look at design docs together. The senior engineer can make the junior engineer a lot more productive without taking too much time from the senior engineer. And it turns out the same thing is true for models. You can take a junior model like Haiku, who we're listing here as the executor, and give it access to Opus, and you can very conservatively use those Opus tokens. So in this beautiful diagram that Claude created for me, what you see is the executor, Haiku, is able to identify every shape as it comes in, no problem, except for one little weird shape.
[15:00] shape. That weird shape, it's beyond what Haiku can do. So Haiku has a tool it calls the advisor, it calls Opus. Opus then, because it's a bigger model, it does more reasoning and it knows that. And what we see from this in our evals is that we get close to Opus level intelligence at much lower prices because we're being very conservative about the tokens that advisor actually sends. And because of the price difference between the two, it works out really well. And what I'm excited about is an integration that we work with with the Copilot team. So let's switch over to the demo machine. Yeah, let's switch over to the demo machine. And what you're seeing is GitHub Copilot. On the left-hand side, it's just GitHub Copilot with Haiku. and on the right hand side you're seeing GitHub Copilot with Haiku plus the new advisor tool hooked up. So I going to hit enter here to give this time to run and there a little kind of brain teaser problem here that it has to solve It has to give it the exact same problem And we see Haiku has taken off whereas on the right side is Consulting Advisor So it going a little bit slowly. So I'm keeping my fingers crossed here that Haiku will, Opus will come back. And so on the left-hand side, Haiku is just spinning away, trying a bunch of things, just like you would see a junior engineer who's very eager, trying lots of things, but hasn't found it yet. On the right side, the Opus Advisor just returned. And because it's Opus, it actually knows this bit of data. And so it's able to bring that back into context. And now we're done with Opus. And everything's still in Haiku. But because it got that little bit of hint, the right-hand side has finished here. So we see the right-hand side finished. the left is still trying to figure out which way is up here. So just that little bit of hint from Opus, very small cost, very small latency hit makes Haiku so much more powerful. So this is an experiment we doing in the GitHub Copilot CLI that we release soon and looking forward to you playing with it Thank you and welcome back Mario Thank you, thank you. I love some Opus Intelligence and Haiku prices. That's kind of what we've got to do. Okay, so what we show you is an advisor model. There's another algorithm that you could actually employ as well as you're tinkering more how to get the right call to the right intelligence. And we call, you know, we're GitHub. We're a little bit weird on some of the things. We call it rubber duck. And what rubber duck is really all about, and here's a demo I'm going to show you in a second, it's really about inserting a critique at the right moments in time. So I have a feature. That feature, you know, it had an issue. And over here, I'm implementing it at the moment. And what I want to highlight, and it's going to come really soon, is the model now is asking for a critique. And you can see how it's asking for a critique from 4.6 and 4.5 opus. Then it receives that critique, and then it's able to actually change the plan prior to implementation, and then continue with that implementation the right way. And then we get that feature, and we deploy it. So that very very quick But really what I wanted to highlight is a different model It a different model that acts less as an advisor and more as a critique on hey, here's what I think you should do. And we insert this in three core places. One of them is after drafting a plan. We have a lot of our users that do a plan first, and then after drafting that plan, they go into execution. We have another one after a complex implementation. So think about it. I just finished all of this. Go and critique. It's kind of like a pre-code review to a degree. And we do it sometimes there because it ends up saving tokens then to wait all the way into an official code review as well. And then the other one is after writing test but before running them. And in certain places where your CI suite with test takes a significant amount of time, then you can see how that at the end gets you to that flow faster. and it keeps that developer in flow. So those are the three places that we're doing it right now. And from my end, what I really have seen work well is kind of at the plan phase. A lot of these systems are getting really, really good at planning. And then if you catch it there, then you end up with the most gains post as well. Now, Robert Dog is already an experimental.
[20:00] So if you download the Copalo CLI and you enable that experiments, you're going to see it there. And you could invoke it whenever you want. So you could just say, hey, create a plan on this and consult with Robert Doug. And then you get a quick critique across model families as well. Now, let's continue moving. The third thing that we wanted to talk about is, okay, how do we, at scale, take new models? Like, what is the process that we do? You know, at the very beginning, it was messy for us. But over the last kind of two and a half years, we've done a lot of work to make sure we're very methodical about how we take this model. So you can see Anthropic has a model to try. We onboard that model into what we call CAPI, which is our Copilot API. And then we have an endpoint. And then from that endpoint, three things really need to happen. Number one, as you all know, you have to go ahead and work in the harness and work in your prompt. So for us, we have a multi-modal harness, right? So it's not just one model family. So we have to go over there and make sure that we update the system prompts. We partnered very, very closely with Anthropic on that. We have to then make sure the tool interfaces are right and optimized We then have to and we don do this anymore as much but we have to tweak the agent loop a little bit And then a lot more work goes into context management into compaction, into making sure that we're hitting the right cash hit rates overall. Then from there, we do two things. We run offline benchmarks. And then we also do internal duck-fruiting. Think of that as online benchmarks overall. So a lot of the Microsoft developers use it, a lot of GitHub developers use it. And we have a set of other users that we kind of partner very closely with as well to give us feedback. So we have that offline, and then we have that internal dog feeding. Then from there, we share findings with Anthropic. And this is a presentation. You know, before we used to write a document. Now we write a document and kind of expand it in detail, where we're like, this is everything that we're seeing. And then we go on a loop with them on changes that we need either at the API or even changes on some of those models as well on the checkpoints that we end up getting. And then from there, we kind of do another loop all the way until the release of the model. Now, it's very important two things. Like, yes, we do offline. And offline gives you an indication But I would say it not going to be a tense reality You learn a lot more from your online evals overall and the online experiments after launch than really the offline. Offline just kind of sets a base, and if that base is consistent, you kind of know what to expect out there. And it gives you a pretty good indication of what to expect. But all of the details do not get done through offline. So it takes us usually days or sometimes even weeks to tune everything of that model out through those online experiments. We do a lot of A-B testing, and we're very methodical about that. And we do weekly reporting that we report up to Anthropic and also across the entirety of the teams that we have to make sure that we are tuning up the right model at the right time. So when it comes to optimizing the hardness for us, there are kind of four things. One is there's the build prompt and context. There's calling the model, executing the tool, and then appending the results and pull back and look back. And what I was saying here, the places where I spend the most time with the team is usually in the execute tool and that build prompt and context. Tools are very important to us. The more tools you have then the more confusion ends up happening the more you have to tune So hundreds and hundreds of tools is not a good thing So you want to make sure you tuning by surface and you tuning for the exact scenarios with the right tools in that package So we spend a lot of time in there and optimizing that model. And then the check permissions and then run, we end up, again, in that execution of the tool, you have to do the right things to pass the right context on it and then to read the right results overall. So whenever we want to introduce a new tool, as an example, we spend a lot of time making sure that we're optimizing the hardness both at the model level and at the tool execution level. So what does this mean at a high level? There's two things. You have to go in and have both published benchmark, internal benchmark, but more importantly, dog food with A and B, and make sure that you have online evals set up. And make sure you could trust them with stat 6 as well. Then the second thing is you want to measure outcomes, not activity. When I talked about the tools, like, as an example, acceptance rate on a code line, that's OK. Survival rate is actually an even better metric overall, because if you ended up accepting it, and then you ended up deleting it after, well, that actually did not accomplish the outcome overall. So even though I could have an amazing acceptance rate, if the survival rate,
[25:00] ends up being very low, that means that we did not do the right work. So it's very important if you're in product, and product really changes in the era of AI, that you're optimizing for the outcomes and not just the individual rows. Like I said, you end up then optimizing for a metric that then tanks the measurement of your entire product. So then with that, again, we walk through prompt caching, the advisor strategy, and then we talk a little bit about measurement and how we improve the hardness. And then for us, I just want to leave you and say thank you. Really excited again to be with you. Hopefully you learned a couple of things today. Outro Music