Brynjolfsson Says 5% of Users Drive 95% of Enterprise AI Value
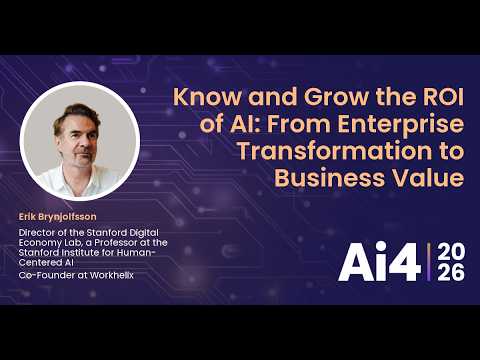
Ai4
Enterprise productivity gains stall on direct software purchases unless firms deploy nine times that capital into redesigning workflows around top-performing power users.
AI-assisted summary of Know and Grow the ROI of AI: From Enterprise Transformation to Business Value With Workhelix — original source. Check the original for full context.
Source published:
Detailed notes
## Background Published on YouTube by Ai4 on August 15, 2026, this keynote features Erik Brynjolfsson—Director of the Stanford Digital Economy Lab and Co-Founder at Workhelix—addressing how enterprise leaders can move beyond model adoption to capture measurable business value. The presentation draws on findings from the Stanford Enterprise AI Playbook and deployment case studies to outline frameworks for task-level AI evaluation, causal KPI tracking, and navigating the productivity J-curve.
## TL;DR Erik Brynjolfsson explains that while AI capabilities have crossed human-level benchmarks, enterprise ROI lags due to the classic productivity J-curve and the requirement for nine dollars of complementary intangible investment—in process redesign and skills—for every dollar spent on tech. To bridge this gap, enterprises must adopt a granular task-based methodology that maps distinct workplace activities to AI applicability rather than treating occupations as monoliths. Data across Fortune 500 deployments, such as NASDAQ, reveals that AI usage follows a strict power law where just 5% of users generate roughly 95% of the total value. Organizations can achieve compounding productivity growth by identifying these hidden power users, turning their advanced workflows and prompts into company-wide playbooks, and pursuing top-line labor augmentation over simple headcount reduction.
## Atmosphere & style The session delivers the crisp, data-driven authority of a premier academic lecture blended with an actionable executive briefing. Brynjolfsson presents with composed clarity, demystifying enterprise anxiety through vivid physical analogies like boiling water thresholds and hidden investment icebergs. The mood is pragmatic yet encouraging, systematically shifting the room from frustration over stalled pilots to strategic optimism grounded in empirical measurement.
## Key takeaways - [00:04](https://www.youtube.com/watch?v=57obkqdD2RM&t=4s) A significant 'capabilities overhang' exists as AI model performance rapidly crosses human baselines while broader macroeconomic and enterprise returns continue to lag. - [01:43](https://www.youtube.com/watch?v=57obkqdD2RM&t=103s) Every $1 spent on direct technology investments requires approximately $9 in complementary intangible assets, including workforce retraining, process redesign, and new product development. - [03:53](https://www.youtube.com/watch?v=57obkqdD2RM&t=233s) Deploying general-purpose technologies inevitably triggers a productivity J-curve, causing measured productivity to stagnate or dip during upfront restructuring before compounding into a harvest phase. - [03:53](https://www.youtube.com/watch?v=57obkqdD2RM&t=233s) Analysis of 51 enterprise implementations revealed that organizational obstacles—such as change management, process adaptation, and measurement—accounted for 77% of deployment challenges rather than technical limitations. - [06:16](https://www.youtube.com/watch?v=57obkqdD2RM&t=376s) Evaluating AI's business impact requires a task-based approach, decomposing monolithic jobs into discrete atomic activities and weighting their AI exposure by economic value. - [08:04](https://www.youtube.com/watch?v=57obkqdD2RM&t=484s) Most corporate activity sits in the 'opportunity zone,' where high-value enterprise tasks remain severely underutilized by AI models and require deliberate workflow migration. - [09:38](https://www.youtube.com/watch?v=57obkqdD2RM&t=578s) Enterprise AI adoption follows an extreme power-law distribution, exemplified at NASDAQ where just 5% of users generated approximately 95% of total business value. - [11:32](https://www.youtube.com/watch?v=57obkqdD2RM&t=692s) Systematically identifying top performers through telemetry data and codifying their prompts into enterprise-wide templates can effectively double overall workforce productivity. - [13:16](https://www.youtube.com/watch?v=57obkqdD2RM&t=796s) The greatest enterprise ROI stems from labor augmentation and end-to-end business process reconfiguration focused on top-line revenue growth rather than narrow headcount reduction. - [15:44](https://www.youtube.com/watch?v=57obkqdD2RM&t=944s) Crude executive metrics like 'token maxing' and generic mandates fail to drive adoption compared to providing workers with proven, department-specific peer prompts mapped to granular tasks. - [18:29](https://www.youtube.com/watch?v=57obkqdD2RM&t=1109s) The power-law distribution of AI value creation is consistent across all industry sectors, meaning the primary variance and upside reside inside individual organizations rather than between industries.
## Detailed walkthrough ### [00:04](https://www.youtube.com/watch?v=57obkqdD2RM&t=4s) The Capabilities Overhang and the Boiling Water Threshold
Erik Brynjolfsson introduces himself by clarifying the pronunciation of his Icelandic surname and reflecting on how rapidly executive mindsets have shifted. Just two years prior, boardrooms were consistently asking him whether artificial intelligence actually worked. Today, that skepticism has vanished completely. The question dominating leadership discussions has transitioned to: "Where's the ROI? How do we get value from it?" Brynjolfsson notes that despite the technology's undeniable promise, a massive "capabilities overhang" persists. Models are advancing at a breakneck pace, yet the broader macroeconomy has barely registered the impact, leaving many individual enterprises feeling understandably disappointed.
To demonstrate the speed of technical progress, Brynjolfsson points to the Stanford AI Index Report—an annual, freely available 520-page document packed with benchmark data. Across virtually every core category, model performance curves are rocketing up and to the right. To make the charts more intuitive, he asked his team to include a dotted reference line representing human performance on the exact same benchmark examinations. Benchmark after benchmark shows models crossing above human-level capability. Brynjolfsson compares this moment to water reaching the boiling point: just as water suddenly shifts from a liquid to a gas at a specific temperature threshold, cognitive tasks across industries are undergoing a phase change from human execution to machine capability. The problem, however, is that this technical inflection has failed to translate into proportional economic returns.
- The Stanford AI Index Report tracks global AI capabilities across 520 pages of empirical benchmarks. - Model performance on standardized cognitive and task evaluations is crossing the human baseline across an expanding set of domains. - The core challenge facing executive leadership is converting technical capabilities into measurable bottom-line value.
---
[01:43](https://www.youtube.com/watch?v=57obkqdD2RM&t=103s) The ROI Gap and the 9-to-1 Intangible Asset Iceberg
The disconnect between surging model capability and lagging business value forms what Brynjolfsson terms the "ROI gap" or "chasm." Enterprise leadership watches technical benchmarks climb, licenses get deployed, and tool usage numbers expand, but the aggregate activity often amounts to low-value busywork. Drawing on a conversation with a writer from *The New Yorker*, Brynjolfsson illustrates how generative AI frequently ends up weaponized for low-value tasks like generating deluge volumes of email spam. Alongside the unchecked proliferation of "shadow AI," these patterns can actively degrade organizational productivity rather than unlock it. Crossing this chasm requires rigorous measurement, anchored in the classic management maxim that "you can't manage what you don't measure."
```mermaid flowchart LR accTitle: The Tangible vs Intangible Enterprise Investment Iceberg subgraph Visible["Visible Assets (10%)"] direction TB T["$1 Tech Investment<br/>Hardware & Software"] end subgraph Intangible["Intangible Assets (90%)"] direction TB HC["Human Capital & Skills"] BPR["Business Process Redesign"] NPD["New Products & Services"] end T -->|"Requires 9x Complementary Capital"| Intangible ```
Bridging this gap demands looking far beyond the technical stack to the rest of the organization. Referencing foundational research conducted with Lorin Hitt and subsequent colleagues, Brynjolfsson emphasizes that the classic "iceberg" analogy is not mere poetry—it is an empirical ratio. For every single dollar spent on tangible information technology investments, an organization must invest roughly nine dollars in complementary intangible assets: retraining human capital, radically redesigning business processes, and developing new products and services. While CEOs and CTOs easily spot technology line items because they pay hard dollars for software and hardware they can physically "knock on with your knuckles," the intangible investments are almost an order of magnitude larger. Trillions of dollars in intangible assets drive the United States economy yet remain completely absent from national economic accounts and corporate balance sheets.
- Empirical research demonstrates an approximate 9:1 ratio of intangible organizational investment needed for every $1 of direct technology expenditure. - Trillions of dollars in organizational capital, human skills, and redesigned workflows remain unrecorded on traditional corporate financial statements. - Without proper measurement and workflow alignment, enterprise AI deployments easily degenerate into shadow AI and spam generation.
---
[03:53](https://www.youtube.com/watch?v=57obkqdD2RM&t=233s) Escaping the Productivity J-Curve and the Enterprise AI Playbook
Because AI is a foundational general-purpose technology—what economists call a "GPT," rather than merely a Generative Pre-trained Transformer—its economic rollout adheres to a classic productivity J-curve. When transformative technologies first enter a firm, the organization must devote immense effort to restructuring workflows, hiring consultants, and consuming valuable worker and management hours on internal reorganizations. During this phase, expenses rise while immediate output remains flat, causing measured productivity to stagnate or even decline. Only later, as the complementary intangible assets mature and compound, does the curve hook upward into a harvest phase. Brynjolfsson argues that most modern enterprises are currently sitting right at the bottom inflection point of this J-curve, having incurred upfront integration costs without yet realizing the harvest.
```mermaid flowchart TD accTitle: The Enterprise AI Productivity J-Curve subgraph Dip["Initial Investment Dip"] direction TB I["Deploy AI & GPTs"] --> C["Incur Costs: Consultants,<br/>Management & Worker Time"] C --> P["Measured Productivity<br/>Flattens or Declines"] end subgraph Rise["The Harvest Phase"] direction TB M["Systematic Task Measurement<br/>& Process Redesign"] --> H["Compounding Value Creation"] H --> S["Steep Productivity Growth"] end P -->|"Workhelix Mission:<br/>Shorten & Shallow the Dip"| M ```
The mission of Workhelix, the company Brynjolfsson co-founded, is to shorten the duration of the J-curve, shallow the investment trough, and accelerate the upward slope. To identify how leading companies achieve this, Brynjolfsson and his Stanford colleagues developed the *Enterprise AI Playbook*, analyzing 51 successful enterprise implementations. While public discourse often obsesses over failed deployments, this research isolated what successful projects shared in common. The analysis revealed that in 77% of cases, technical hurdles were not the limiting factor; the make-or-break determinants were organizational barriers surrounding people, process adaptation, and, above all, empirical measurement.
- General-purpose technologies reliably induce a productivity J-curve characterized by short-term performance dips followed by delayed, compounding growth. - Stanford's *Enterprise AI Playbook* evaluated 51 real-world enterprise deployments to isolate the core drivers of implementation success. - Organizational dynamics—spanning change management, workflow redesign, and causal performance tracking—accounted for 77% of deployment challenges over technical issues.
---
[06:16](https://www.youtube.com/watch?v=57obkqdD2RM&t=376s) The Task-Based Approach: Deconstructing Occupations
To manage organizational transformation systematically, Brynjolfsson advocates for the "task-based approach," an analytical framework he originally pioneered alongside Tom Mitchell in the journal *Science* and later expanded with his former student and Workhelix co-founder Daniel Rock in the landmark paper *GPTs are GPTs* (co-authored with researchers from OpenAI). Attempting to evaluate AI's impact across an entire enterprise or monolithic job title invariably stalls out because broad job descriptions obscure the underlying mechanics of day-to-day operations. Instead, every profession must be recognized as an aggregated bundle of distinct tasks.
When an occupation is disassembled into its granular components, analytical traction becomes straightforward. A radiologist's job breaks down into 26 distinct tasks; an economist performs over 20 distinct activities; similar decompositions apply to software engineers and journalists. Once mapped, each task can be empirically evaluated for its exposure to artificial intelligence on a low, medium, or high scale. While large language models excel at drafting analytical memos, they offer virtually zero utility for physical duties like lifting boxes. By scoring each task's exposure, weighting it by the economic value generated by that specific task, and aggregating those scores back up through occupations and business units, leadership gains unprecedented visibility into where true automation and augmentation opportunities reside.
- Jobs are operationalized as bundles of discrete tasks (e.g., 26 tasks for a radiologist, 20+ for an economist). - AI exposure scoring evaluates the susceptibility of individual tasks to model assistance (e.g., high for memo drafting, zero for lifting heavy boxes). - Weighting task-level AI exposure by economic value allows organizations to roll granular data back up to the enterprise level.
---
[08:04](https://www.youtube.com/watch?v=57obkqdD2RM&t=484s) The Conversation vs. Value Matrix and Opportunity Zones
Translating the task-based framework into practical enterprise software reveals clear patterns in how employees interact with AI tools. Workhelix maps enterprise activity along a two-dimensional grid: the vertical axis measures adoption volume—specifically, the number of user conversations with AI systems—while the horizontal axis reflects the objective task value derived from the task-based methodology. Plotting enterprise usage across these axes exposes three distinct zones that dictate where intervention is needed.
| Matrix Zone | Location on Matrix | Characteristics & Enterprise Reality | |:--- |:--- |:--- | | **Upper-Left Zone** | High conversation volume, low task value | Largely empty in healthy deployments; represents wasteful, low-value interactions if populated. | | **The Sweet Spot** | 45-degree diagonal line | Balanced zone where conversation frequency is directly proportional to the business value of the underlying task. | | **The Opportunity Zone** | Lower-right quadrant (low conversation volume, high task value) | The dominant quadrant for most companies; contains high-value business tasks where AI usage remains severely underutilized. |
Brynjolfsson explains that the primary objective for an enterprise is to migrate workflows out of the lower-right opportunity zone and push them vertically up toward the 45-degree diagonal. In nearly every corporate environment Workhelix inspects, vast reservoirs of high-value tasks show minimal model interaction because workers have not yet incorporated AI into their core workflows. The purpose of Workhelix's diagnostic tooling is to pinpoint these stranded opportunities and provide an analytical roadmap for driving adoption precisely where leverage is greatest.
---
[09:38](https://www.youtube.com/watch?v=57obkqdD2RM&t=578s) The Power Law of AI Usage and the NASDAQ Case Study
When analyzing user behavior within enterprises, a striking empirical regularity appears without exception: enterprise AI adoption follows a classic, heavily skewed power law. In every single company examined, a tiny vanguard of power users on the extreme tail extracts extraordinary returns, while the vast majority of employees sit in a long tail, deriving negligible benefit. In typical Fortune 500 organizations, the median worker captures only 1% to 3% of the potential value available through AI systems.
A dramatic illustration of this dynamic emerged from Workhelix's engagement with NASDAQ. Evaluating user interactions with AI agents revealed that roughly 5% of the user base was responsible for generating approximately 95% of total business value. While many executives view such extreme skew as an implementation failure, Brynjolfsson frames it as a massive, low-hanging economic opportunity. Increasing bottom-line value does not require discovering uninvented capabilities; it simply requires moving workers along the distribution curve so that long-tail users begin emulating the behaviors of top-quintile power users. While casual users limit their prompts to drafting slightly more eloquent emails, advanced users deploy models to architect comprehensive corporate marketing strategies, generate robust production code, and orchestrate automated workflows.
- Enterprise AI usage mirrors a strict power-law distribution across all organizations studied. - At typical Fortune 500 companies, the average employee captures only 1% to 3% of the technology's addressable value. - At NASDAQ, an internal audit demonstrated that just 5% of users generated roughly 95% of the total value produced by enterprise AI agents. - Shifting users from low-leverage tasks (polishing email prose) to high-leverage workflows (strategic planning, code generation) represents the fastest path to expanding AI return on investment.
[11:32](https://www.youtube.com/watch?v=57obkqdD2RM&t=692s) Creating a Learning Organization: Identifying Power Users and Scaling Prompts
Lifting the broader workforce up to match the performance of top-tier adopters—represented visually by the green uplift area on the chart—has a profound impact: that seemingly modest sliver of improvement can effectively double a company's total productivity. Crucially, this is not a one-time exercise. Enterprise AI transformation requires a dynamic, continuous cycle where organizations systematically assess what their highest-performing users are doing, distill those practices into structured templates, and distribute them across the rest of the company. Making this work hinges on measurement and visibility.
As the underlying models evolve, use cases and top performers continuously shift. The power users of two years ago are often not the power users of today or next year. Furthermore, high performers are frequently introverted employees who may not vocalize their breakthroughs, but organizational data objectively highlights who they are. Once these individuals are pinpointed, companies can examine their workflows to isolate highly effective prompts across coding, marketing strategy, or customer service. Turning these techniques into standardized templates transforms the enterprise into a continuously improving learning organization.
```mermaid flowchart TD accTitle: Power User Playbook Scaling Loop accDescription: Workflow showing how top-performer practices are identified through data and distributed across an enterprise.
subgraph Identify ["1. Observe & Identify"] A["Telemetry & Observability Data"] --> B["Identify Hidden Power Users"] end
subgraph Extract ["2. Codify & Template"] B --> C["Extract High-Value Prompts & Workflows"] C --> D["Build Department Playbooks & Templates"] end
subgraph Distribute ["3. Scale & Learn"] D --> E["Distribute to Broader Workforce"] E --> F["Achieve Productivity Uplift"] F -.->|"Continuous Model Evolution"| A end ```
[13:16](https://www.youtube.com/watch?v=57obkqdD2RM&t=796s) The Playbook for Action: Task-Level Analysis, Process Redesign, and Top-Line Augmentation
To implement these gains immediately, enterprise leaders must connect AI capabilities directly to concrete business value starting the next morning. This begins with a comprehensive scan of all occupational roles across the organization, deconstructing each job into its constituent, atomic tasks—a methodology detailed in Erik Brynjolfsson's published research in *Science* and operationalized through Workhelix across generative AI, agentic AI, and predictive AI. Once tasks are mapped, progress must be monitored using causal inference, observable KPIs, and rigorous measurement rather than guesswork.
However, task-level optimization is merely the initial phase. True transformation demands a complete reconfiguration of overarching business processes. Because AI automates certain legacy components while opening up novel capabilities, job descriptions must fundamentally change. Rather than treating AI primarily as a headcount-cutting mechanism, forward-looking organizations focus on labor augmentation to expand top-line growth. Brynjolfsson recounts advising a senior executive who was fixated purely on reducing headcount, demonstrating that the far greater ROI lay in carefully measuring and orchestrating how AI can complement human workers to create new lines of value.
- **Actionable Steps for Enterprise Value:** - Map every organizational occupation down to its granular, atomic tasks. - Evaluate task applicability across generative, agentic, and predictive AI. - Track real business impact through causal inference and clear KPIs. - Redesign end-to-end processes and job scopes instead of merely automating isolated legacy steps. - Prioritize labor augmentation and top-line revenue expansion over pure headcount reduction.
[15:44](https://www.youtube.com/watch?v=57obkqdD2RM&t=944s) Q&A: Moving Beyond 'Token Maxing' to Concrete, Task-Level Adoption
During the Q&A session, an attendee from Amazon's internal evangelism team asked how to drive deeper adoption across an organization when evangelists encounter diminishing returns within their limited span of influence. Brynjolfsson praised Amazon’s progress while addressing a widespread executive mistake: issuing generic, top-down memos commanding employees to "use AI more" or instituting crude metrics like "token maxing" (counting raw token consumption). While well-intentioned, broad executive exhortations fail to move the dial because they lack tangible direction.
Real adoption requires getting deep into the operational weeds of specific departments. Workhelix evaluates roughly 25,000 distinct enterprise tasks to pinpoint exactly which activities should incorporate AI and which should not. When a developer, HR manager, or marketer is handed specific, proven prompts from high-performing peers delivering 2x, 3x, or 10x performance gains, adoption naturally accelerates because workers are equipped with an actionable guidebook. Because AI capabilities change so rapidly—looking substantially different in the summer of 2026 compared to late 2025—companies must employ tools that continuously update task suitability and monitor ongoing ROI.
| Traditional Top-Down Push | Task-Based Precision Playbook | |:--- |:--- | | Generic CEO memos urging teams to "use AI more" | Granular task mapping across ~25,000 distinct business tasks | | "Token maxing" (measuring raw prompt/token volume) | Causal inference and business-outcome KPI tracking | | Vague expectations leading to worker confusion | Sharing proven peer prompts that demonstrate 2x–10x gains | | Static, one-and-done training initiatives | Continuous updating to match rapidly evolving model capabilities |
[18:29](https://www.youtube.com/watch?v=57obkqdD2RM&t=1109s) Q&A: Overcoming Middle-Management Inertia and Cross-Industry Power Laws
Responding to an audience question regarding organizational pushback, Brynjolfsson validated a common corporate dynamic: enthusiastic boards and CEOs eagerly greenlight AI initiatives, while middle management remains skeptical and hesitant, hoping the trend will "blow over" like past tech fads. This resistance stems from the natural inertia of successful enterprises, whose established processes were intentionally designed for stability and replication. Overcoming this friction requires CEOs to provide concrete, instrumented metrics that prove feasibility and remove the ambiguity surrounding AI integration.
A subsequent question explored whether the heavy skew in AI adoption—such as the power-law distribution observed at Nasdaq, where 5% of power users drive 99% of generated value—varies across sectors like manufacturing versus finance. Brynjolfsson explained that this qualitative power-law pattern is surprisingly consistent across all industries; the meaningful variance is observed *inside* companies rather than *between* them. While curve steepness may differ, the universal presence of this skewed distribution represents enormous low-hanging fruit, offering a repeatable formula for enterprises to systematically capture trapped ROI over the next five or more years.
## Notable quotes > [00:04](https://www.youtube.com/watch?v=57obkqdD2RM&t=4s) Where's the ROI? How do we get value from it? — Erik Brynjolfsson
> [00:04](https://www.youtube.com/watch?v=57obkqdD2RM&t=4s) capabilities overhang — Erik Brynjolfsson
> [01:43](https://www.youtube.com/watch?v=57obkqdD2RM&t=103s) you can't manage what you don't measure. — Erik Brynjolfsson
> [01:43](https://www.youtube.com/watch?v=57obkqdD2RM&t=103s) knock on with your knuckles — Erik Brynjolfsson
> [03:53](https://www.youtube.com/watch?v=57obkqdD2RM&t=233s) Enterprise AI Playbook — Erik Brynjolfsson
> [06:16](https://www.youtube.com/watch?v=57obkqdD2RM&t=376s) task-based approach — Erik Brynjolfsson
> [06:16](https://www.youtube.com/watch?v=57obkqdD2RM&t=376s) GPTs are GPTs — Erik Brynjolfsson
> [08:04](https://www.youtube.com/watch?v=57obkqdD2RM&t=484s) Opportunity Zone — Erik Brynjolfsson
> [15:44](https://www.youtube.com/watch?v=57obkqdD2RM&t=944s) use AI more — Erik Brynjolfsson
> [15:44](https://www.youtube.com/watch?v=57obkqdD2RM&t=944s) token maxing — Erik Brynjolfsson
> [18:29](https://www.youtube.com/watch?v=57obkqdD2RM&t=1109s) blow over — Erik Brynjolfsson
## Mentioned Erik Brynjolfsson, Stanford Digital Economy Lab, Stanford Institute for Human-Centered AI, Workhelix, Ai4, Stanford AI Index Report, The New Yorker, Lorin Hitt, Tom Mitchell, Daniel Rock, OpenAI, Science, GPTs are GPTs, Enterprise AI Playbook, NASDAQ, Amazon
## Video description Erik Brynjolfsson - Director of the Stanford Digital Economy Lab, a Professor at the Stanford Institute for Human-Centered AI, Co-Founder at Workhelix
AI is advancing rapidly, but the central question for enterprise leaders is no longer whether it works—it is how to convert capability into measurable business value. This talk will show why AI transformation requires more than model adoption, drawing on evidence from Canaries in the Coal Mine on how AI is already reshaping work and from the Stanford Enterprise AI Playbook’s lessons from 51 enterprise deployments.
The talk will explain how to identify high-value opportunities at the task and process level, measure ROI with credible KPIs and causal inference, and move from scattered pilots to scaled productivity and revenue growth. It will also highlight why complementary investments—in skills, workflows, and organizational redesign—are essential to escaping the productivity J-curve.
Attendees will leave with a practical framework for knowing where AI is creating value today and growing that value across the enterprise.
[Source](https://www.youtube.com/watch?v=57obkqdD2RM)