Meta Adds $450 Billion on Muse Launch as AI Workloads Pivot to CPUs
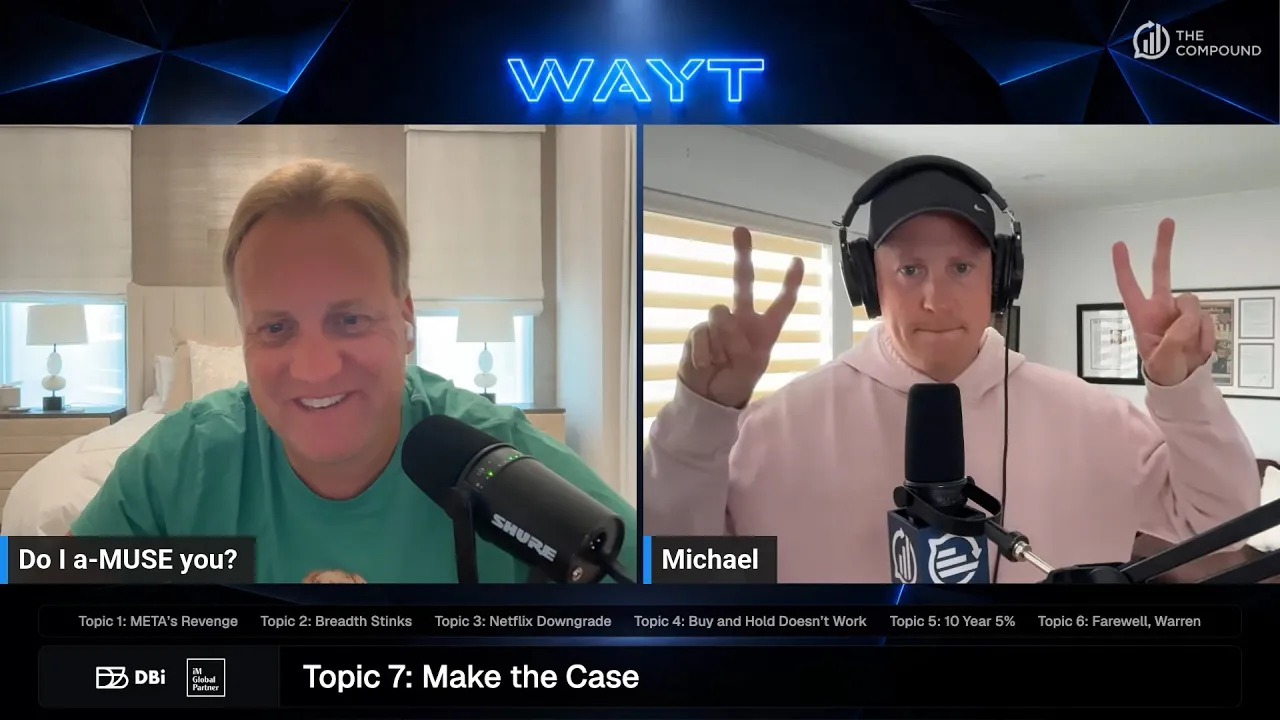
The Compound
Meta's rapid valuation surge demonstrates that controlling agentic workflow execution across massive consumer distribution networks creates immediate commercial value where standalone language models face monetization limits.
AI-assisted summary of Josh’s Worst Call This Year | WAYT? — original source. Check the original for full context.
Source published:
Key ideas
- Meta launched its agentic AI assistant, Muse, sparking a 28% month-to-date rally and adding over $400 billion in market capitalization within three weeks. (3:25)
- Muse's unique architectural reliance on virtual machines, tool calls, and on-device inference ignited a rally in CPU and edge chipmakers like AMD, Intel, Arm, and Qualcomm over traditional GPU suppliers. (15:35)
- Market breadth near record highs remains historically narrow, though only 4% of S&P 500 components are currently down 30% or more, far below late-1990s bubble conditions. (20:00)
- With the 10-year Treasury yield hitting 5%, hosts make the case for locking in generationally high, guaranteed income rather than overthinking equity risk. (50:00)
Detailed notes
## Background Published on YouTube by The Compound on September 22, 2026, this episode of What Are Your Thoughts features Josh Brown and Michael Batnick breaking down the week's major financial and market developments. According to the video description, the hosts discuss Meta's massive rally following the launch of its Muse AI assistant, historically weak market breadth near record highs, Netflix's drawdown and analyst debates, the flaws of single-stock buy-and-hold strategies, the appeal of 5% Treasury yields, Warren Buffett's legacy, ARKK, and Snowflake.
## TL;DR Josh and Michael analyze Meta's historic market capitalization surge following the release of its agentic AI assistant Muse, which catalyzed an unexpected rally in CPU and edge-computing semiconductor stocks rather than GPU leaders. The hosts examine underlying market breadth divergences at all-time highs before Josh dissects his self-proclaimed worst call of the year in Netflix, debating its creative content slump and YouTube competition against resilient subscriber metrics. They explore research from Trivariate demonstrating why long-term buy-and-hold fails for individual equities, contrasting retail habits with Warren Buffett's disciplined portfolio management. The discussion concludes with the tactical case for locking in 5% yields on the 10-year Treasury, a bull-versus-bear debate on Cathie Wood's ARKK Innovation ETF, and a technical post-mortem of Snowflake's multi-year base breakout.
## Atmosphere & style The broadcast carries the fast-paced, irreverent energy of a morning trading desk, blending rigorous technical chart reading with blunt, self-deprecating banter. Josh and Michael play off their long-standing camaraderie, openly ribbing each other over sports misery and humiliating stock trades, such as Michael calling Josh a 'dumbass' for stubbornly averaging down on Netflix while Josh humorously claims an 'honorary idiot trophy.' The conversation seamlessly oscillates between cathartic confessions of investing psychology and sharp macro analysis, creating an accessible, behind-the-curtain environment where sophisticated financial metrics sit comfortably alongside discussions of ticker symbol karma and pop culture.
## Bulletin - [03:25](https://www.youtube.com/watch?v=XIopv2pr4r8&t=205s) Meta launched its agentic AI assistant, Muse, sparking a 28% month-to-date rally and adding over $400 billion in market capitalization within three weeks. - [15:35](https://www.youtube.com/watch?v=XIopv2pr4r8&t=935s) Muse's unique architectural reliance on virtual machines, tool calls, and on-device inference ignited a rally in CPU and edge chipmakers like AMD, Intel, Arm, and Qualcomm over traditional GPU suppliers. - [20:00](https://www.youtube.com/watch?v=XIopv2pr4r8&t=1200s) Market breadth near record highs remains historically narrow, though only 4% of S&P 500 components are currently down 30% or more, far below late-1990s bubble conditions. - [50:00](https://www.youtube.com/watch?v=XIopv2pr4r8&t=3000s) With the 10-year Treasury yield hitting 5%, hosts make the case for locking in generationally high, guaranteed income rather than overthinking equity risk.
## Key takeaways - [03:25](https://www.youtube.com/watch?v=XIopv2pr4r8&t=205s) Meta's launch of Muse catalyzed a massive valuation re-rating, pushing the stock from $578 toward $750 and adding the equivalent market cap of Costco, P&G, or Netflix in three weeks. - [10:00](https://www.youtube.com/watch?v=XIopv2pr4r8&t=600s) Mark Zuckerberg's strategy focuses on owning the ubiquitous agentic AI assistant rather than competing solely on generic text LLMs. - [13:30](https://www.youtube.com/watch?v=XIopv2pr4r8&t=810s) Muse achieved 902,000 downloads in its first six days, reaching the #1 free app spot on iOS and Google Play for adults 18+. - [15:35](https://www.youtube.com/watch?v=XIopv2pr4r8&t=935s) Muse's use of dedicated virtual machines and dynamic browser sessions created a surge in demand for server CPUs and mobile silicon, propelling AMD past a $1 trillion market cap. - [20:00](https://www.youtube.com/watch?v=XIopv2pr4r8&t=1200s) S&P 500 breadth readings are historically thin, but modern divergence is muted compared to 1999, when 14% of stocks collapsed over 30% during retail liquidations. - [25:35](https://www.youtube.com/watch?v=XIopv2pr4r8&t=1535s) The entire cap-weighted index momentum is currently dominated by just three synchronizing mega-caps: Apple, Nvidia, and Meta. - [25:35](https://www.youtube.com/watch?v=XIopv2pr4r8&t=1535s) Nvidia trades at an optically compressed valuation of roughly 16 times forward earnings, pricing it at a discount to the broader S&P 500. - [27:15](https://www.youtube.com/watch?v=XIopv2pr4r8&t=1635s) Josh Brown identifies holding Netflix through its technical breakdown and Warner Bros. acquisition rumors as his worst trade of the year. - [34:10](https://www.youtube.com/watch?v=XIopv2pr4r8&t=2050s) Wall Street bears on Netflix point to falling daily viewing hours (down to 1.6 hours per subscriber) and secular living-room screen time losses to YouTube. - [41:22](https://www.youtube.com/watch?v=XIopv2pr4r8&t=2482s) Trivariate Research reveals that buy-and-hold fails for most single stocks: only 23% of top 500 U.S. equities beat the S&P 500 over a 10-year horizon. - [45:00](https://www.youtube.com/watch?v=XIopv2pr4r8&t=2700s) Warren Buffett's actual investment record contradicts passive buy-and-hold orthodoxy; Berkshire has actively cut losing positions early while holding only a tiny fraction of names forever. - [50:00](https://www.youtube.com/watch?v=XIopv2pr4r8&t=3000s) Locking in a 5% 10-year Treasury yield offers compelling risk-adjusted asymmetry, delivering guaranteed principal and coupon cushion compared to equity downside. - [55:00](https://www.youtube.com/watch?v=XIopv2pr4r8&t=3300s) Fidelity reports a record 769,000 401(k) millionaire accounts, alongside data showing approximately 20% of American households now hold millionaire status. - [56:36](https://www.youtube.com/watch?v=XIopv2pr4r8&t=3396s) Warren Buffett's compounding record is so extraordinary that Berkshire Hathaway would still beat the S&P 500 since 1965 even after an immediate 99% drawdown. - [58:18](https://www.youtube.com/watch?v=XIopv2pr4r8&t=3498s) A contrarian bull case for Cathie Wood's ARKK is debated against Josh's criticism that Wood's tendency to trim winners and average down on losers damages cycle returns. - [01:02:14](https://www.youtube.com/watch?v=XIopv2pr4r8&t=3734s) Josh breaks down his breakout trading framework using Snowflake (SNOW), emphasizing buying tight consolidations at new highs with strict exit rules rather than bottom-fishing.
## Detailed walkthrough ### [00:00](https://www.youtube.com/watch?v=XIopv2pr4r8&t=0s) Show Banter, Football Woes, and DBMF Sponsorship
After a three-week hiatus—owing to Future Proof one week and a back injury the week before that brought on guest appearances by Sharkey, Matt, and Sean—Josh Brown and Michael Batnick reunite for *What Are Your Thoughts*. Because Josh has an upcoming appearance at the University of Miami later in the day, the episode is pre-taped on a Tuesday morning rather than broadcast fully live, though the hosts treat it with the exact same live energy. Before getting into macro and markets, sports misery takes center stage: Michael is reeling from seeing a brutal knee injury on Monday Night Football, while Josh is completely disgusted after watching Jameis Winston play quarterback, prompting him to text his Giants friends that he might tune out football entirely for the next few weeks and jump straight into celebrating the Knicks.
The hosts reset the mission of the show for new viewers: covering the biggest market stories, stocks, bonds, the macroeconomy, venture capital, and technology. Michael reads the sponsorship for DBMF, the world’s largest managed futures ETF (with $4.16 billion in AUM as of July 31), highlighting its dynamic long/short trend-following approach that provides uncorrelated diversification across asset classes. Josh quips about the sloth featured on screen, recalling his childhood obsession with reading animal books at the library, before pivoting straight to a massive corporate beast: Meta.
[03:25](https://www.youtube.com/watch?v=XIopv2pr4r8&t=205s) Meta's Revenge: The Muse Launch and Historic Market Cap Surge
Meta ignited a ferocious rally across big tech after launching **Muse** on September 8th, rolling it instantly into WhatsApp, Instagram, and Facebook, and backing the rollout with high-profile advertising during NFL broadcasts. Josh frames the release of Muse as Meta’s most pivotal milestone since introducing Reels to counter TikTok. Coming into September, Meta was trading around $578 per share; three weeks later, it rocketed into the $740–$750 range. That $163-per-share leap represents a 28% gain month-to-date, tacking on between $400 billion and $450 billion in market capitalization—the largest single-month value creation event in Meta's corporate history.
To put that sheer magnitude into context, Josh notes that the market cap Meta added in just three weeks is equivalent to an entire Costco ($430 billion), Procter & Gamble ($400 billion), Johnson & Johnson ($400 billion), Home Depot, or Netflix ($375–$380 billion). Looking at an 18-month chart, Meta had previously been languishing in a grinding downtrend of lower highs and lower lows, dogged by persistent investor skepticism over soaring AI CapEx spending, lack of near-term ROI, and fears of a "Metaverse Part 2." Over the summer, Meta and Tesla sat at the bottom of the Magnificent Seven leaderboard, only for Meta to flip almost overnight to the group's frontrunner.
```mermaid flowchart TD accTitle: Meta Market Cap Surge Following Muse Launch accDescr: Flow diagram showing Meta's transformation from market laggard to adding over $400B in market cap after launching Muse.
subgraph SummerSlump["Summer Sentiment (Pre-Muse)"] A["Stock at $578 (16-17x Forward P/E)"] B["CapEx Scrutiny: 'Metaverse Part 2' fears"] C["Bottom-tier performer alongside Tesla"] end
subgraph Catalyst["Catalyst: September 8 Launch"] D["Launch of Muse"] E["Instant distribution: WhatsApp, IG, Facebook"] F["Massive NFL ad push"] end
subgraph HistoricSurge["Three-Week Re-Rating"] G["Share price surges to ~$740 - $750 (+28% MTD)"] H["+$400B to +$450B added to Market Cap"] I["Equivalent to adding an entire Costco, P&G, or Netflix"] end
SummerSlump --> Catalyst Catalyst --> HistoricSurge ```
- **Price action**: Rallied from $578 to ~$740–$750 per share (+$163/share, +28% MTD). - **Scale of added value**: Meta’s three-week market cap gain (~$400B–$450B) rivals the total value of Costco ($430B), Procter & Gamble ($400B), J&J ($400B), and Netflix ($375B–$380B). - **Product integration**: Muse was pushed instantly across Meta's multi-billion-user surface area (WhatsApp, Instagram, Facebook).
[06:05](https://www.youtube.com/watch?v=XIopv2pr4r8&t=365s) Valuation Re-Rating, Wide AI Outcomes, and Betting Against Zuck
Michael reflects on what this turnaround says about the broader AI landscape. Over the summer, Meta was trading at an ultra-depressed 16 to 17 times forward earnings. Despite that optical value pitch, the chart looked technically broken, and investors were actively throwing in the towel because the spending seemed reckless and directionless. The violent snapback—pushing a $1.4 trillion company straight toward a $2 trillion valuation in three weeks—proves just how wide the range of outcomes remains for the entire AI infrastructure and consumer application trade. Once Muse dropped, it rocketed straight to the top of the App Store charts, opening the door to tens of billions in potential new revenue that had been priced at zero.
Josh emphasizes that Wall Street analysts are aggressively hiking both earnings estimates and valuation multiples. One analyst jumped from a 20x to a 25x price-to-earnings forecast—a 20% expansion in the multiple alone—because Meta possesses an unmatched ability to monetize consumer attention and user-facing features better than any company on earth. The conversation turns to the perennial mistake the broader market makes: repeatedly writing off Mark Zuckerberg. From the early IPO days when critics insisted Meta was a desktop relic incapable of adapting to mobile, to scoffing at the $1 billion Instagram buyout, to declaring him finished during the Metaverse spending troughs, the consensus invariably concludes that Zuckerberg is in trouble, only for him to completely obliterate expectations every single time.
[10:00](https://www.youtube.com/watch?v=XIopv2pr4r8&t=600s) The Land Grab for Agentic AI: Meta's Muse vs. The Competition
The stock market shows no loyalty and never gives a company the benefit of the doubt. It is an unforgiving arena where past achievements count for nothing compared to what a business is delivering right now and what investors expect next. Six months earlier, Meta appeared completely cornered, heading in the wrong direction while investors questioned their capital allocation. With the release of their new agentic AI assistant, Muse, the narrative has flipped on a dime, pulling everyone right back into the boat. This rapid shift highlights the precarious spot of venture-backed competitors like Instinct, which recently raised $350 million at a $2.5 billion valuation in August. Those private investors must be sweating, especially with OpenAI poised to launch its own personal assistant in the fourth quarter with an instant test audience of one billion people.
Personal assistant software operates with virtually nonexistent switching costs. Integrating with a user's tech stack or reading Gmail is a commodity rather than a durable moat. Meta’s massive balance sheet allows it to pour billions into development and buy mainstream awareness beyond its own walled garden. Seeing Meta purchase high-profile commercial spots during *Monday Night Football* demonstrates that leadership is treating this as an all-in consumer product rollout rather than a soft feature test tucked inside an app feed. Meanwhile, commercial rivalries are already surfacing: Amazon reportedly cut off Muse integrations, contrasting with Meta's launch partnership with Spotify. Even if that exclusion temporarily raises eyebrows, an eventual distribution pact with Amazon could just as easily fuel the next leg up for the stock.
The battle is a quintessential commercial land grab, reminiscent of the Tom Cruise and Nicole Kidman film *Far and Away*, where 19th-century Irish immigrants sprint into the frontier to physically stake their claim on open territory before anyone else can touch it. Mark Zuckerberg has recognized that he does not need to win the generic large language model (LLM) or ChatGPT text-prompting war. Instead, the ultimate prize is owning the ubiquitous agentic AI assistant—an autonomous entity that handles actual tasks, executes actions, and orchestrates workflows across a user's digital life.
```mermaid flowchart TD accTitle: Agentic AI Land Grab Architecture accDescr: Diagram illustrating the competition between Meta, OpenAI, and startups in the agentic AI market.
subgraph Frontier["The Agentic AI Frontier"] direction TB Meta["Meta (Muse)<br/>• Heavy TV Ad Blitz<br/>• Spotify Partner"] OAI["OpenAI Assistant<br/>• Q4 Launch<br/>• 1B Built-in Users"] Startups["Instinct & Startups<br/>• $2.5B Valuation<br/>• Zero Switching Costs"] end
subgraph Outcome["The Ultimate Prize"] Agent["Autonomous Task Execution<br/>(Beyond Chat/LLM Search)"] end
Meta --> Agent OAI --> Agent Startups --> Agent ```
---
[13:30](https://www.youtube.com/watch?v=XIopv2pr4r8&t=810s) App Store Dominance and Wall Street's Reversal
Consumer adoption for Muse exploded out of the gate. Within twenty-four hours of release, it climbed to the number one free app on both the Apple iOS App Store and Google Play among downloads for adults aged 18 and older. In its first six days, the app clocked 902,000 downloads—a performance that dwarfs the lackluster debut of the earlier standalone Meta AI app, which managed just 773 downloads over a comparable span. Analysts anticipate downloads will surge past 10 million in short order.
Wall Street responded with immediate enthusiasm. Mark Mahaney’s research team at Evercore ISI issued a glowing report declaring Muse an undeniable hit and concrete proof of successful product innovation. The note framed the launch as tangible justification that Meta’s estimated $200 billion cumulative AI investment cycle was not squandered capital. Evercore highlighted that this usage inflection point unlocks lucrative downstream monetization channels, spanning direct advertising, recurring premium subscriptions, and transaction-based revenue-sharing models. While consumer apps can sometimes flare up virally and burn out just as swiftly, the initial engagement signals a durable shift in Meta's platform utility.
- **Muse initial downloads:** 902,000 in its first six days. - **Predecessor benchmark:** Meta AI app managed only 773 downloads at debut. - **Demographic rank:** #1 free app across iOS and Google Play (for ages 18+). - **Capex justification:** Evercore ISI cited the debut as proof that Meta's $200 billion AI investment is generating actual return on innovation.
---
[15:35](https://www.youtube.com/watch?v=XIopv2pr4r8&t=935s) The Architecture Shift: Why Muse Sparked a Massive CPU Rally
The rollout of Muse triggered an unexpected divergence in semiconductor equities, sparking an aggressive rally across central processing unit (CPU) and edge-device chipmakers rather than the usual graphics processing unit (GPU) leaders. Advanced Micro Devices (AMD) rocketed higher, Arm Holdings jumped 17%, Qualcomm climbed 9%, and Intel surged roughly 15%.
The catalyst lies in Muse’s underlying infrastructure, which deviates significantly from traditional GPU-dominated data center architectures:
```mermaid flowchart LR accTitle: Muse Technical Architecture Flow accDescr: Flowchart contrasting GPU data center compute with Muse's user-level VM and on-device CPU processing.
subgraph UserSession["Client & Session Layer"] User["User Prompt"] --> VM["Dedicated Secure VM<br/>(One Per User)"] end
subgraph TaskHandling["CPU-Heavy Execution"] VM --> Tools["Tool Calls & Sandboxing"] VM --> Web["Live Browser Sessions"] end
subgraph EdgeCompute["Hardware Workloads"] Tools --> Edge["On-Device Inference<br/>(Qualcomm / Arm)"] Web --> CPUs["Server CPUs<br/>(AMD / Intel)"] end ```
Rather than feeding every query into an Nvidia GPU matrix, Muse spins up a dedicated, secure virtual machine (VM) for every individual user. This virtual environment manages live browser sessions, sandbox execution, and dynamic "tool calls"—operational steps where the agent summons external applications to execute concrete jobs. These workloads lean heavily on traditional server CPUs. Simultaneously, Qualcomm and Arm Holdings are reaping the benefits of on-device inference, designing mobile silicon capable of processing agentic workloads locally on smartphones without bouncing data back and forth to an AI mega-data-center.
As a direct result of this shift, AMD officially crossed into the $1 trillion market capitalization club, pushing its valuation to nearly double that of Intel ($615 billion).
---
[17:35](https://www.youtube.com/watch?v=XIopv2pr4r8&t=1055s) Meta's Monster Breakout and the Path to $1,000
Meta's stock breakout has all the hallmarks of a secular advance with strong momentum into year-end. Despite the stock already leaping 165 points and trading near $750, the sheer psychological difficulty of chasing it here is precisely why it likely heads higher toward $1,000 next year. While a period of intermediate consolidation would be natural, the breakout represents a fundamental reappraisal of the business.
For months, bearish commentary claimed Meta suffered from runaway capital expenditures without real return on investment (ROI). In reality, AI infrastructure had already quietly yielded tens of billions in incremental revenue through algorithmic recommendation improvements across Reels, even if critics overlooked it. Skeptics were demanding that Zuckerberg pivot toward renting out excess compute to salvage margins. Muse effectively silences those complaints by delivering consumer utility and setting up massive transactional opportunities. The banter wraps on an ironic, self-deprecating note about the folly of active market timing: acknowledging the absurdity of trading in and out of the stock over the past two months and walking away with an "honorary idiot trophy" just as the company enters an epic run, before turning attention to weakening breadth across the broader stock market.
[20:00](https://www.youtube.com/watch?v=XIopv2pr4r8&t=1200s) Market Breadth at Record Highs: Bullish Washout vs. Historical Divergence
The major indexes are sitting right near all-time highs following a sharp rally over the prior few sessions. Michael opens with a tip of the cap to Fundstrat's Tom Lee, who boldly called for the bull market to kick off at precisely 2:15 PM on the day of the Federal Reserve interest rate decision—missing the turning point by just one day, as the market surged at that exact time the following afternoon. Yet despite the headline index strength, very few underlying stocks are actually participating in the climb. While Michael points out that this kind of narrow market has been a recurring theme over the past decade—often resolving as a "bullish washout" where beaten-down stocks eventually catch up to the index—he acknowledges that the current breadth readings are objectively poor.
To illustrate the severity of the divergence, Michael cites market technician Jason Goepfert, who noted that the market has not seen breadth this weak with the S&P 500 knocking on new highs in nearly a century, pointing to 1973 and 1999 as the only remotely comparable setups. However, Ryan Detrick offered a counterpoint, highlighting that breadth peaked alongside price this time around, unlike major market tops where breadth typically rolls over well in advance. Michael looks into the actual carnage under the surface: with the S&P 500 up 14% year to date, only 4% of the index's constituent stocks are down 30% or more. Both hosts admit they expected that figure to be closer to 10%, showing that today's environment is far tamer than true historical tops.
- **1998 Divergence:** S&P 500 gained 29%, while 10% of individual index components plummeted 30% or more. - **1999 Divergence:** S&P 500 gained 21%, while a staggering 14% of the index collapsed 30% or more. - **Current Setup:** S&P 500 up 14% year to date, with only 4% of stocks down 30% or more.
```mermaid flowchart TD accTitle: Market Breadth Divergence Comparison accDescr: Comparison of severe breadth divergence in 1998 and 1999 against the more contained breadth environment today.
subgraph Late90s ["Late 1990s Tech Bubble"] A["1998: S&P +29%"] --> B["10% of stocks down 30%+"] C["1999: S&P +21%"] --> D["14% of stocks down 30%+"] E["Mass retail & steel bankruptcies"] end
subgraph Today ["Current Market Setup"] F["S&P 500: +14% YTD"] --> G["Only 4% of stocks down 30%+"] H["Breadth peaked alongside price"] end ```
[22:45](https://www.youtube.com/watch?v=XIopv2pr4r8&t=1365s) The 1999 Retailer Collapse and the Bad Karma of Sears' Old Ticker
Josh Brown contextualizes why 14% of stocks were falling off a cliff during the 1999 rally, explaining that it was driven by a specific structural shift: traditional brick-and-mortar retailers, which made up a massive portion of the index at the time, were getting systematically liquidated. Long-NASDAQ, short-retail was the defining pair trade of that era, long before the retail ETF (XRT) existed. Traders were forced to handpick individual tickers to short into oblivion—names like Sears (a blue-chip Dow component), Linens 'n Things, RadioShack, Borders Group (BGP), Pier 1 Imports, Goody's Family Clothing, and Guitar Center—alongside a wave of bankruptcies across heavily weighted domestic steel producers. Having only 4% of stocks down 30% today is routine by comparison, matching the low drag seen in recent bull market years.
The mention of Sears prompts Josh into an animated diatribe about ticker symbols and cybersecurity firm SentinelOne. Sears famously traded under the single-letter ticker "S" before shifting to "SHLD" following the Sears Holdings merger. When SentinelOne went public, it scooped up the abandoned "S" symbol—a move Josh viewed as a fatal omen when profiling the stock for CNBC alongside Sean. Even though SentinelOne was breaking out technically, Josh refused to touch it purely because of the inherited ticker: "You don't take the Sears ticker symbol. What are you, fucking high? Like literally the worst judgment imaginable." He insists there is undeniable market karma embedded in corporate symbols: "Ticker symbols are magic. They're like ancient runes. They're like hieroglyphs. Don't fuck around with that."
[25:35](https://www.youtube.com/watch?v=XIopv2pr4r8&t=1535s) Mega-Cap Concentration and Nvidia at 16 Times Forward Earnings
Examining the chart of cap-weighted versus equal-weighted performance reveals a ferocious upside rip for the mega-caps relative to the broader market. Josh and Michael trace this entire counter-move directly to three names: Apple, Nvidia, and Meta all synchronizing their momentum at the exact same moment. While Amazon has traded largely sideways for four years and Alphabet has hovered near highs, Apple and Nvidia stormed right back toward record territory, accompanied by Meta's unexpected surge. Together, the market capitalization of these three behemoths alone commands an astonishing $10 trillion to $12 trillion, dictating the direction of the entire cap-weighted index.
Turning to the broader artificial intelligence narrative, Michael points out a striking valuation disconnect. If Nvidia represents the ultimate personification of the AI trade, it is remarkable that the stock trades at just 16 times forward earnings, effectively pricing it at a discount to the broader S&P 500 index. Josh confirms that this valuation compression extends across the entire semiconductor space, with the sector trading at a 10% to 20% discount to the market, as seen in names like Broadcom. Wall Street remains deeply skeptical about whether peak chip earnings can be sustained, but Josh and Michael view that pervasive doubt as a bullish cushion: if these companies continue printing and guiding toward record quarters a year from now, they will not stay priced at 16 times forward earnings for long.
[27:15](https://www.youtube.com/watch?v=XIopv2pr4r8&t=1635s) Josh's Worst Call of the Year: The Netflix Downfall and the Warner Bros. Mistake
The conversation shifts abruptly to personal accountability as Josh confesses to what he considers his undisputed worst stock call of the year: Netflix. While Michael chimes in that he owns the stock as well, Josh owns the mistake completely. He normally adheres to strict stop-losses when trades turn against him, but with Netflix he violated his own rules, continually averaging down while stubbornly refusing to accept reality. He laments being visibly wrong everywhere—on CNBC television, in his written columns, and across multiple episodes of The Compound.
Looking at the three-year chart, Netflix enjoyed a tremendous bull run throughout 2024 and the opening half of 2025 before driving off a cliff. Josh identifies the exact catalyst that broke the thesis: the company's decision to wade into the Warner Bros. Discovery acquisition rumors and corporate mess. While Josh initially tried to rationalize the move—giving management the benefit of the doubt as a $400 billion titan capable of executing bold strategic shifts—the market took one look at Warner Bros.' massive debt burden and contentious labor issues and hit the sell button. Josh concedes that the bears were completely justified: taking on $30 billion in acquired debt made no strategic sense for Netflix, and failing to recognize that misstep early cost him dearly as the stock unraveled.
[30:00](https://www.youtube.com/watch?v=XIopv2pr4r8&t=1800s) Regret, Gap Fills, and the Death Cross
Michael and Josh dissect their ill-fated trades in Netflix, analyzing the stock chart to pinpoint precisely where both of them failed to pull the trigger and sell. Michael gives himself minor credit for buying near the lows in February and selling on the subsequent rip, but berates himself for trying to get "too cute" when the stock filled the gap around May: he bought back in, only to watch it break down, leaving him down 19% on the position. Looking at the chart, Michael suggests the correct exit was May or July 2026 around $80, where the stock filled the gap, moved sideways, and then broke down.
Josh, however, rewinds the tape much further. He initiated his position at $100 back in the summer of 2025 (well off the all-time high in the $130s). To him, the true exit signal wasn't the failed gap fill, but rather the textbook technical breakdown known as the "death cross" in the first week of December. While acknowledging that moving average crossovers are an imprecise shorthand rather than an exact science, Josh notes that a 50-day moving average crossing below a 200-day moving average clearly signals that short-term negative momentum has overwhelmed the long-term trend and sellers have taken control of psychology. From that December breakdown into March, the stock felt like it fell every single day. Hearing that Josh sat through the entire descent, Michael laughs, calling him a "dumbass," to which Josh responds: "I added. I fucking added to it."
```mermaid flowchart TD accTitle: Netflix Technical Breakdown and Trade Timeline accDescr: Flowchart tracing Josh and Michael's trade entries, the technical breakdown, and the current dilemma. subgraph Entries ["Entry Points"] A["Summer '25: Josh buys at $100"] B["Feb '26: Michael buys lows, sells rip"] C["May '26: Michael buys gap fill"] end
subgraph Technicals ["Technical Breakdown"] D["Dec '25: 50-Day crosses below 200-Day<br>(Death Cross at 'Bucktown')"] E["Dec '25 - Mar '26: Persistent slide"] F["Josh adds on post-earnings gap down<br>(Avg price: $81)"] end
subgraph Status ["Current Standing"] G["Stock drops to ~$73<br>(Down 47% from highs)"] H["Michael: Down 19%<br>Josh: 'It owes me'"] end
A --> D D --> E B --> C E --> F C --> G F --> G G --> H ```
[32:45](https://www.youtube.com/watch?v=XIopv2pr4r8&t=1965s) "It Owes Me": The Psychology of Holding a Loser
Despite knowing conventional trading wisdom dictates it is never too late to sell, Josh refuses to dump his shares at current levels, arguing that the ideal selling window has long passed. Josh lowered his average cost basis to $81 by aggressively buying the post-earnings gap down. With the stock floating around $73—and having traded at $80 just two days prior—Josh's position is relatively cushioned compared to Michael's, but Josh freely admits he has abandoned disciplined risk management in favor of pride and stubbornness.
"The old bald man knows when to break the rules," Josh jokes, openly conceding that he is breaking every investment principle on and off the books. Rather than merely hoping to break even and escape unscathed, Josh insists that after enduring the drawdown, "It owes me," and he refuses to exit without turning a profit. His fundamental rationale relies on Netflix's push into live events, such as NFL broadcasts, which have the potential to drive massive influxes of sticky subscribers who do not churn out once onboarded.
- **Josh's cost basis:** Averaged down to $81 after buying the post-earnings gap down. - **Michael's performance:** Sitting on an unrealized loss of 19%. - **Current share price:** Hovering around $73, down from $80 just two sessions earlier.
[34:10](https://www.youtube.com/watch?v=XIopv2pr4r8&t=2050s) The Bear Case: Content Slump vs. The YouTube Juggernaut
Josh walks through the Wall Street bear thesis, presenting two drastically different arguments from two major research desks that both reach pessimistic conclusions. The Street-low target comes from Wells Fargo, who slashed their target to $57 on September 18th—implying more than 25% downside. Wells Fargo's analyst cut forward earnings estimates for 2027 and 2028 and reduced their valuation multiple from 21x forward earnings to 15x. The core of their argument is an engagement and content problem: subscriber viewing dropped to 1.6 hours per day in the first half (down 8% from 2023 levels, adjusted for password sharing and geography), viewing hours for Netflix's top 100 original titles fell, and Netflix's share of total US TV viewing slipped below 8%. Wells Fargo argues that despite spending $20 billion annually on content, Netflix lacks cultural watercooler hits. Josh agrees with the sentiment, contrasting the absence of a new *Stranger Things*, *Bridgerton*, or *Ozark* with Paramount's buzzy lineup like *Special Ops: Lioness* and *Landman*.
| Analyst Firm | Price Target | Core Thesis / Mechanism | Key Metrics & Data Cited | |:--- |:--- |:--- |:--- | | **Wells Fargo** | $57 (Cut from higher) | **Engagement & Content Crisis:** Inability to generate blockbuster original hits despite spending $20B; engagement weakening. | Multiple cut from 21x to 15x forward; viewing down 8% to 1.6 hrs/sub/day; top 100 originals hours down; US TV share <8%. | | **HSBC** | $76 (Cut today) | **Market Share Threat from YouTube:** Ad-supported, ubiquitously distributed video dominating living rooms and TVs with no answer from Netflix. | Structural screen-time loss to YouTube; viewed as an unbeatable "Darth Vader" threat rather than a cyclical hit-driven slump. |
On the other side of the bear camp, HSBC cut their price target to $76, ignoring original programming altogether and framing Netflix's dilemma as an existential market share war against YouTube. HSBC contends YouTube has aggressively captured living room screen time on connected TVs, operating as a free, ad-supported powerhouse that Netflix has no structural defense against. When Josh asks Michael whether the creative slump or the YouTube juggernaut represents the bigger existential threat, Michael asserts that the YouTube threat is already well understood and priced into the stock. Michael argues that the lack of breakout scripted hits is the more pressing issue, though it is also the one Netflix can realistically remedy with fresh creative talent—even if top-tier showrunners like Taylor Sheridan have already struck mega-deals elsewhere, such as Universal and NBC/Peacock.
[37:35](https://www.youtube.com/watch?v=XIopv2pr4r8&t=2255s) The Bull Case and Surviving 70% Drawdowns
Balancing the debate, Josh turns to the Wall Street bull case, led by Evercore ISI, who doubled down on their bullish stance by raising their price target from $100 to $110. Evercore's thesis highlights robust underlying engagement metrics and expanding international reach:
- **Subscriber penetration:** US penetration reached a multi-year high of 63%, while Japanese penetration hit a record 22%. - **Churn reduction:** Cancellation intentions improved across both the US and Japanese markets. - **Live programming momentum:** Viewership for live events surged to 60% of users in September, up from 42% in March. - **Sports impact:** In Japan, 45% of surveyed new subscribers cited the World Baseball Classic promotion as their primary reason for joining. - **Short-form engagement:** Netflix Clips adoption reached 46% among surveyed users in Japan and 38% in the United States.
While Josh remains skeptical that Netflix can casually float up to $110 without a dramatic catalyst or massive sentiment shift, Michael draws a parallel to Meta's past turnaround. Just as investors repeatedly learned never to count out Mark Zuckerberg, Michael contends Netflix has earned a similar degree of respect and resilience. The stock is currently sitting at a 47% drawdown from its highs, and while Michael emphasizes that he has no interest in riding an investment all the way down to a 70% loss—a fate Netflix has experienced multiple times throughout its corporate history—he believes writing off the streaming pioneer amid its current slump would be a mistake.
[40:00](https://www.youtube.com/watch?v=XIopv2pr4r8&t=2400s) Netflix: Buybacks, Leadership Questions, and Needing Another Hit
The debate around Netflix centers on whether the streaming giant can replicate its previous recoveries. The company has maintained an aggressive capital return program, buying back $4.7 billion worth of stock in the second quarter alone with $25 billion remaining under its buyback authorization. With earnings projected to grow at double digits for the foreseeable future, the bull argument appears structurally sound. However, a significant wrinkle sets the current moment apart from the brutal 2022 drawdown—when the stock was cut in half before rebounding on the launch of the ad-supported tier and the crackdown on password sharing.
The critical difference is leadership. Reed Hastings is no longer CEO, and the company is being led by co-CEOs Ted Sarandos and Greg Peters. While neither executive is new to Netflix—both have spent decades at the firm—the concern is that they are fundamentally creative content executives rather than business engineers. Facing a business and distribution challenge rather than purely a programming issue, Netflix finds itself in a spot where it urgently needs to deliver another massive pop-culture hit to reignite investor enthusiasm.
- **Q2 2023 Share Repurchases**: $4.7 billion. - **Outstanding Repurchase Authorization**: $25 billion. - **Key Leadership Shift**: Co-CEOs Ted Sarandos and Greg Peters leading instead of founder Reed Hastings.
---
[41:22](https://www.youtube.com/watch?v=XIopv2pr4r8&t=2482s) Why Buy-and-Hold Fails for Individual Stocks
Turning to market research, Michael highlights a report by Adam Parker and Trivariate Research titled *"Buy and Hold Doesn’t Work."* Unlike dense, 90-plus-page white papers that languish unread in browser tabs for weeks—such as Michael Mauboussin’s classic study on public-to-private equity—Trivariate delivers concise, digestible research. Their latest data lays bare the brutal reality of single-stock selection: over long horizons, picking individual stocks to beat the benchmark is remarkably futile.
```mermaid flowchart TD accTitle: Holding Period vs Outperformance Odds accDescr: Chart showing declining odds of beating the S&P 500 as holding periods lengthen from one year down to ten years.
subgraph TimeHorizons["Holding Period vs S&P 500 Outperformance"] A["1-Year Horizon: Higher Hit Rate<br/>(Market overreactions can be exploited)"] B["3-Year Horizon: 28% Beat Rate<br/>(Mean loser lags index by ~62-80%)"] C["10-Year Horizon: 23% Beat Rate<br/>(Long-term drift & structural decay dominate)"] A --> B B --> C end ```
According to Trivariate, the odds of outperforming the broader market over time have collapsed. Across the top 500 U.S. stocks, only 23% held over a 10-year period beat the S&P 500. Shortening the window to three years raises the hit rate to just 28%. When looking across the broader top 2,000 stocks, the downward slope from the upper-left to the lower-right remains identical.
The real danger lies in the asymmetry of the downside: missing the rare mega-winners while holding lagging stocks inflicts irrecoverable damage. Stocks bought three years ago that lagged the index fell behind by an average of 62%, with the mean underperformer trailing the index by nearly 80%. Interestingly, investors have a far higher probability of outperforming over a 12-month period than over 3 or 10 years. Over a one-year timeframe, an investor can credibly identify an overextended bear case or short-term mispricing. Over a full decade, however, the market rarely misprices a business—fundamentals, competition, and macroeconomic dynamics shift too drastically for long-term forecasting.
- **10-Year Holding Period**: Only 23% of top 500 stocks beat the S&P 500. - **3-Year Holding Period**: 28% hit rate against the index. - **Cost of Underperformance**: Lagging stocks over a three-year span trailed the index by an average of 62%, with the mean loser lagging by roughly 80%.
---
[45:00](https://www.youtube.com/watch?v=XIopv2pr4r8&t=2700s) The Buffett Buy-and-Hold Myth and the Importance of Universe Selection
Josh offers a counter-perspective on the pervasive myth of long-term buy-and-hold investing, which retail investors almost universally anchor to Berkshire Hathaway. Warren Buffett is frequently lionized as a passive buy-and-hold machine, yet Berkshire's quarterly 13F filings reveal constant portfolio adjustments. Out of the roughly 800 individual equities Berkshire has held throughout its history, only around eight were held truly "forever." Buffett’s true genius is letting the market validate a winner over time, while showing zero hesitation to cut losing positions within the first year or two before they inflict terminal damage.
```mermaid flowchart LR accTitle: Buffett Style vs Flawed Retail Stock Selection accDescr: Comparing Warren Buffett's winner-retention model against the retail approach of trading random media chatter.
subgraph BuffettMethod["The Buffett / Momentum Rule"] direction TB B1["Test thesis over 1-2 years"] --> B2{"Is it a winner?"} B2 -- Yes --> B3["Hold indefinitely; cost basis protects capital"] B2 -- No --> B4["Cut quickly; avoid holding losers to zero"] end
subgraph RetailMethod["Flawed Retail Approach"] direction TB R1["Watch CNBC / TV banter"] --> R2["Buy hyped ticker cold"] R2 --> R3["Hold declining stock into severe underperformance"] end ```
The underlying issue for most individual investors is poor universe selection. Rather than filtering for strength, people approach the market haphazardly—turning on CNBC's *Fast Money* or listening to ticker chatter at a bar and assuming that because a stock is in the news, it is worth owning. Josh emphasizes the philosophy behind their *Best Stocks in the Market* screen: if you want to trade, restrict your starting universe to the ~200 companies whose stocks are already demonstrating high relative strength, growing earnings, and institutional accumulation (e.g., Dell Technologies and Eli Lilly, whereas Netflix has been absent from the list). Josh evokes the advice of their late friend, technician John Boorman:
> "If you want to buy a stock because it will go up, start with a stock that's already going up."
This concentration of capital into existing leaders explains the creation of multi-trillion-dollar market-cap giants, as liquidity drains away from the hundreds of index components that consistently fail to perform.
---
[49:55](https://www.youtube.com/watch?v=XIopv2pr4r8&t=2995s) A Pivot to Fixed Income: 5% on the 10-Year Treasury
The conversation transitions sharply from equities to the bond market. With the 10-year Treasury yield pressing into the 5% zone, Michael asks Josh point-blank whether investors should stop overthinking the technical charts and simply lock in these generationally high yields.
[50:00](https://www.youtube.com/watch?v=XIopv2pr4r8&t=3000s) Locking in 5% on the 10-Year Treasury
The conversation turns to the 10-year Treasury yield hitting 5%, a level Michael Batnick views as an extraordinary opportunity rather than something to fear. Recalling that the last time yields reached these heights at the end of 2023 it was a "no-brainer," he points out that investors didn't see 5% again for nearly two and a half years. Michael admits he hasn't owned bonds basically ever, but argues that locking in a 5% real return represents simple, prudent asset allocation. If yields continue rising to 5.8% or 6%, he isn't bothered: investors don't need to pick the exact top in yields, and missing an extra leg up is merely missed opportunity, not a catastrophic loss.
Josh Brown reinforces the asymmetry between equities and Treasuries. If an investor buys a 10-year Treasury intending to hold it to maturity, day-to-day yield fluctuations are irrelevant—the principal and the 5% coupon are guaranteed. Even if yields move from 5% to 6%, Michael notes the total return might dip by roughly 3.5%, but the 5% yield cushion blunts the blow. In contrast, an equity investment can go to zero. If yields collapse back to 4% due to an economic slowdown or recession, bondholders capture significant price appreciation on top of their yield. Josh emphasizes that investors retain complete flexibility: they can collect their $5,000 annual coupon on a $100,000 bond and reinvest it into higher-yielding paper, or they can ladder their purchases—buying $50,000 at 5% and another $50,000 at 5.5% if yields push higher.
```mermaid flowchart TD accTitle: Treasury Yield Asymmetry at 5 Percent accDescr: Diagram illustrating the payoff dynamics and strategy options for buying a 10-year Treasury at a 5 percent yield.
subgraph Core["Initial Position"] A["Buy 10-Yr Treasury at 5% Yield"] end
subgraph YieldMoves["Yield Trajectory Scenarios"] B["Yields Rise to 6%"] C["Yields Fall to 4%"] end
subgraph Outcomes["Investor Outcomes"] D["Minor Total Return Dip (~3.5%)<br/>Cushioned by 5% Coupon"] E["Significant Capital Appreciation<br/>+ Safe Flight-to-Quality Asset"] end
subgraph Tactical["Active Strategies"] F["Reinvest $5,000 Coupon into Higher Yields"] G["Ladder Fixed Income Purchases (e.g., 50k at 5%, 50k at 5.5%)"] end
A --> B A --> C B --> D C --> E D -.-> F D -.-> G ```
Reviewing the Treasury yield curve, Josh observes that it looks completely normal, with the 10-year sitting at the "juiciest part of the curve." For anyone holding excess cash over a ten-year horizon who cannot tolerate principal loss, it offers a vastly superior setup compared to past years. Looking at historical multi-decade charts, Josh pushes back against the media's framing of 5% as "no man's land." For most of recorded financial history, rates hovered near or above 5%; the zero-interest-rate environment between 2010 and 2020 was the true aberration.
- CBOE data via *Daily Chartbook* shows the three-month rolling correlation between the U.S. 10-year yield and WTI crude oil reached 65%—exceeding correlation spikes seen during the depths of COVID-19 and the 2011 Arab Spring. - Josh notes that long-term Treasury yields are determined less by the Federal Reserve (which controls the overnight rate) and more by macroeconomic and geopolitical wildcards, such as Middle East conflict and crude transit through the Strait of Hormuz.
---
[55:00](https://www.youtube.com/watch?v=XIopv2pr4r8&t=3300s) The 401(k) Millionaire Milestone
Josh counters the gloom surrounding higher rates by sharing fresh data on American wealth accumulation from Fidelity. The number of 401(k) millionaires on Fidelity's platform surged 19% from the first quarter to reach a record 769,000 accounts. Michael initially scoffs, expecting the figure to be well into the millions, but Josh clarifies that this represents account holders at a single firm with seven figures strictly within their retirement plans—accounting for 3% of Fidelity's 25.8 million 401(k) accounts.
Broadening out to aggregate wealth across the country, Josh notes that roughly one-fifth (20%) of all American households now qualify as millionaire households. Despite the constant drumbeat of negative headlines, both hosts marvel that virtually no one celebrates this staggering milestone of household wealth creation.
---
[56:36](https://www.youtube.com/watch?v=XIopv2pr4r8&t=3396s) Farewell to Warren: Buffett's Unbelievable Compounding Legacy
The hosts pause to pay tribute to Warren Buffett after Sean ("chart kid") puts together a comprehensive graphic commemorating his tenure as he steps down as chairman of Berkshire Hathaway, handing the reins over to his son, Howard Buffett. Michael jokingly reassures the audience that Buffett didn't pass away, but notes that after decades at the helm, the historical record of capital allocation is unmatched.
Sean's chart chronicles Berkshire's signature milestones: acquiring See's Candies in 1972, initiating a stake in Coca-Cola in 1988, and building an enormous position in Apple starting in 2016. Across nearly every starting vintage, Berkshire Hathaway's annualized returns proved to be massive winners. Michael shares his favorite "face-melting" compounding statistic—originally highlighted by Meb Faber: even if Berkshire Hathaway stock were to suffer an immediate 99% drawdown, it would still have outperformed the S&P 500 index since Buffett took over management in 1965.
---
[58:18](https://www.youtube.com/watch?v=XIopv2pr4r8&t=3498s) Make the Case: Cathie Wood and the ARKK Setup
Transitioning to the "Make the Case" segment, Michael warns viewers with a laugh that he might jinx the broad equity rally because he is about to pitch Cathie Wood's flagship ARK Innovation ETF (ARKK). Josh reacts with playful disbelief, warning him: "You never go full ARK."
Michael builds his thesis on extreme contrarian sentiment. The American Association of Individual Investors (AAII) sentiment survey shows the fewest bulls in a full year, alongside the largest weekly spike in bears in a year and a half, driving the bull-bear spread to its lowest mark since May 2025. Given such pervasive pessimism, Michael argues that it wouldn't take much upward momentum for animal spirits to rush back in. Showing ARKK's chart pushing against its purple moving average line, he asks whether anyone would genuinely want to bet on it failing right at this breakout level.
Josh raises a fundamental counterargument: technical analysis is difficult to apply cleanly to an actively managed ETF. Unlike an index tracking a static basket of equities, Cathie Wood trades frequently and can reshape the portfolio overnight. While Michael grants the skepticism inherent to active turnover, he maintains that the underlying pond in which she fishes—hyper-growth and disruptive tech—remains consistent, making the risk/reward compelling into negative sentiment.
[01:00:00](https://www.youtube.com/watch?v=XIopv2pr4r8&t=3600s) The ARK Invest Challenge: Innovation vs. Portfolio Management
The discussion centers on Cathie Wood’s ARK Invest and whether a massive breakout is looming for her flagship strategy. Looking at a chart of ARK’s top holdings—highlighting names like Tesla, SpaceX, Tempus AI, Circle, Coinbase, and CRISPR—the case is made that these core positions represent pure innovation, crypto, and genomics. Although nearly all of these names remain in long-term downtrends and trade drastically below their all-time highs, several have mounted serious runs. If meaningful risk-on appetite rotates back into the broader market, ARK stands to benefit enormously, potentially breaking out of its base—even if there is lingering risk of a double top.
```mermaid flowchart TD accTitle: The ARK Investment Debate accDescr: Diagram contrasting the bull thesis of risk-on innovation breakout with Josh's bear thesis on Cathie Wood's portfolio turnover.
subgraph Bull["Bull Case: Innovation Basket"] A["Core Holdings: Tesla, SpaceX, Tempus AI, Coinbase, CRISPR"] --> B["Beaten-Down Valuations & Strong Momentum"] B --> C["Risk-On Market Breadth Sparks Major Breakout"] end
subgraph Bear["Josh's Challenge: Portfolio Execution"] D["Social Media Criticism & High Conviction"] --> E["Trims Winners & Averages Down on Losers"] E --> F["Portfolio Turnover Erodes Shareholder Returns"] end ```
Josh applauds the boldness of the pitch but steps in to take the opposing side of the trade, issuing a formal challenge. His skepticism lies not in whether disruptive tech can rally, but in Cathie Wood's specific portfolio management style. Historically, Wood tends to trim her winners to repeatedly average down on her worst-performing losers—frequently treating social media criticism as a contrarian signal to double down. While noting his genuine personal affection for Wood, Josh remarks that "she has more guts than is actually good for a person to have," which often hurts ARK shareholders over full cycles. The two agree to lock in a head-to-head bet: taking a snapshot of ARK's portfolio today and revisiting it in the future to grade both the absolute price performance and the turnover decisions made along the way.
- **ARK's Featured Holdings:** Tesla and SpaceX occupy the top spots alongside positions in Tempus AI, Circle, Coinbase, and CRISPR Therapeutics. - **The Core Debate:** Can an aggressive risk-on recovery outpace the drag created by selling winning momentum stocks to buy falling knives? - **The Challenge Terms:** Compare today's portfolio snapshot with future performance to determine whether macro momentum or portfolio turnover dictates the outcome.
---
[01:02:14](https://www.youtube.com/watch?v=XIopv2pr4r8&t=3734s) Mystery Chart: Unpacking the Snowflake Breakout
The segment shifts to the recurring "Mystery Chart" game. The host presents a full inception-to-date chart of a company that came public in 2021 and was previously pitched on *Make the Case* earlier in the year. The chart reflects a massive, elongated U-shaped recovery that is just now returning to even ground relative to its debut. Initial guesses miss the mark, with suggestions like Airbnb and Affirm both shot down. To break the stalemate, an unconventional clue is offered: the ticker symbol features prominently in a controversial, oft-debated classic holiday tune ("Baby, It's Cold Outside" / "Let It Snow").
The mystery stock is revealed to be Snowflake (ticker: SNOW). Walking through the technical setup around late July, Josh explains his philosophy behind buying near the highs. After hitting a peak in June, the stock spent an entire month consolidating before charging right back toward that resistance level. While momentum indicators like the RSI were drifting into overbought territory, market enthusiasm was palpable. Josh admits he rarely succeeds when attempting to bottom-fish deep-value names; instead, his playbook relies on buying strength at the top of a range after missing the initial move, backed by a strict exit strategy to manage downside risk.
- **The Mystery Asset:** Snowflake (NYSE: SNOW), displaying a dramatic multi-year round-trip from its late-2020/2021 post-IPO levels. - **Technical Entry Setup:** Initiated near July 29th following a one-month consolidation near local highs with elevated RSI levels. - **Trading Philosophy:** Buying high-momentum consolidation breakouts with defined stop-losses rather than trying to catch falling knives in bruised value names.
---
[01:05:00](https://www.youtube.com/watch?v=XIopv2pr4r8&t=3900s) Outro and Show Wrap-Up
Reflecting on the psychological difficulty of trading, both hosts acknowledge the persistent temptation to stray from one's playbook and buy heavily beaten-down names despite knowing better. Wrapping up the broadcast, they extend their thanks to the community tuning in across YouTube, Spotify, and Apple Podcasts, encouraging listeners to leave ratings and reviews to support the network. They preview the upcoming programming slate across The Compound network, including the next day's episode of *Animal Spirits*, followed by *Ask The Compound*, and rounding out the week with a fresh installment of *The Compound and Friends*.
## Notable quotes > [22:45](https://www.youtube.com/watch?v=XIopv2pr4r8&t=1365s) You don't take the Sears ticker symbol. What are you, fucking high? Like literally the worst judgment imaginable. — Josh Brown
> [22:45](https://www.youtube.com/watch?v=XIopv2pr4r8&t=1365s) Ticker symbols are magic. They're like ancient runes. They're like hieroglyphs. Don't fuck around with that. — Josh Brown
> [30:00](https://www.youtube.com/watch?v=XIopv2pr4r8&t=1800s) I added. I fucking added to it. — Josh Brown
> [32:45](https://www.youtube.com/watch?v=XIopv2pr4r8&t=1965s) The old bald man knows when to break the rules. — Josh Brown
> [32:45](https://www.youtube.com/watch?v=XIopv2pr4r8&t=1965s) It owes me. — Josh Brown
> [45:00](https://www.youtube.com/watch?v=XIopv2pr4r8&t=2700s) If you want to buy a stock because it will go up, start with a stock that's already going up. — John Boorman (quoted by Josh Brown)
> [58:18](https://www.youtube.com/watch?v=XIopv2pr4r8&t=3498s) You never go full ARK. — Josh Brown
> [01:00:00](https://www.youtube.com/watch?v=XIopv2pr4r8&t=3600s) she has more guts than is actually good for a person to have — Josh Brown
## Mentioned Josh Brown, Michael Batnick, Sharkey, Matt, Sean, University of Miami, Jameis Winston, New York Giants, New York Knicks, DBMF, Meta, Muse, WhatsApp, Instagram, Facebook, Reels, TikTok, Costco, Procter & Gamble, Johnson & Johnson, Home Depot, Netflix, Tesla, Mark Zuckerberg, Instinct, OpenAI, Amazon, Spotify, Far and Away, Tom Cruise, Nicole Kidman, Apple iOS App Store, Google Play, Mark Mahaney, Evercore ISI, Advanced Micro Devices (AMD), Arm Holdings, Qualcomm, Intel, Nvidia, Tom Lee, Federal Reserve, Jason Goepfert, Ryan Detrick, S&P 500, XRT, Sears, Linens 'n Things, RadioShack, Borders Group, Pier 1 Imports, Goody's Family Clothing, Guitar Center, SentinelOne, CNBC, Broadcom, Alphabet, Warner Bros. Discovery, Wells Fargo, HSBC, YouTube, Stranger Things, Bridgerton, Ozark, Paramount, Special Ops: Lioness, Landman, Taylor Sheridan, Universal, NBC, Peacock, World Baseball Classic, Ted Sarandos, Greg Peters, Reed Hastings, Adam Parker, Trivariate Research, Michael Mauboussin, Berkshire Hathaway, Warren Buffett, Fast Money, Dell Technologies, Eli Lilly, John Boorman, Fidelity, Howard Buffett, See's Candies, Coca-Cola, Meb Faber, Cathie Wood, ARK Innovation ETF (ARKK), American Association of Individual Investors (AAII), SpaceX, Tempus AI, Circle, Coinbase, CRISPR Therapeutics, Airbnb, Affirm, Snowflake, Animal Spirits, Ask The Compound, The Compound and Friends
## Video description On this episode of What Are Your Thoughts, Josh Brown and Michael Batnick discuss: Meta’s massive rally following the launch of Muse and what it could mean for the AI trade and chip stocks. They also break down weak market breadth near all-time highs, debate Netflix’s brutal drawdown and the bull and bear cases for the stock, look at why buy-and-hold is so difficult for individual stocks, make the case for locking in 5% Treasury yields, Warren Buffett’s legacy, ARKK, Snowflake, and much more.
This episode is sponsored by DBMF, the world’s largest managed futures ETF. Discover why DBMF’s liquid, uncorrelated, managed futures strategy could be what your Alts allocation is missing at: www.dbmf.com/WAYT
►00:00 - Start ►03:25 - META’s Revenge ►19:50 - Breadth Stinks ►27:55 - Netflix Downgrade ►41:22 - Buy and Hold Doesn’t Work ►49:55 - 10 Year 5% ►56:36 - Farewell, Warren ►58:18 - Make the Case ►01:02:14 - Mystery Chart
👕 Check out The Compound shop: https://www.idontshop.com
🎙️Listen to our podcasts: TCAF: https://podcasts.thecompoundnews.com/show/TCAF/ Animal Spirits: https://podcasts.thecompoundnews.com/show/animalspirits/ Ask The Compound: https://podcasts.thecompoundnews.com/show/ATC/
The Compound Newsletter: https://www.thecompoundnews.com/subscribe
Linkedin: https://www.linkedin.com/company/the-compound-media/ Instagram: https://instagram.com/thecompoundnews Twitter: https://twitter.com/thecompoundnews Tik Tok: https://www.tiktok.com/@thecompoundnews
Investing involves the risk of loss. This podcast is for informational purposes only and should not be or regarded as personalized investment advice or relied upon for investment decisions. Josh Brown and Michael Batnick are employees of Ritholtz Wealth Management and may maintain positions in the securities discussed in this video. All opinions expressed by them are solely their own opinion and do not reflect the opinion of Ritholtz Wealth Management. See our disclosures here: https://ritholtzwealth.com/podcast-youtube-disclosures/
The Compound Media, Incorporated, an affiliate of Ritholtz Wealth Management, receives payment from various entities for advertisements in affiliated podcasts, blogs and emails. Inclusion of such advertisements does not constitute or imply endorsement, sponsorship or recommendation thereof, or any affiliation therewith, by the Content Creator or by Ritholtz Wealth Management or any of its employees. For additional advertisement disclaimers see here https://ritholtzwealth.com/advertising-disclaimers.
#thecompound #investing #stockmarket #stocks
[Source](https://www.youtube.com/watch?v=XIopv2pr4r8)