Nvidia Surge Conceals Breadth Decay as VIX Ignores Macro Stress
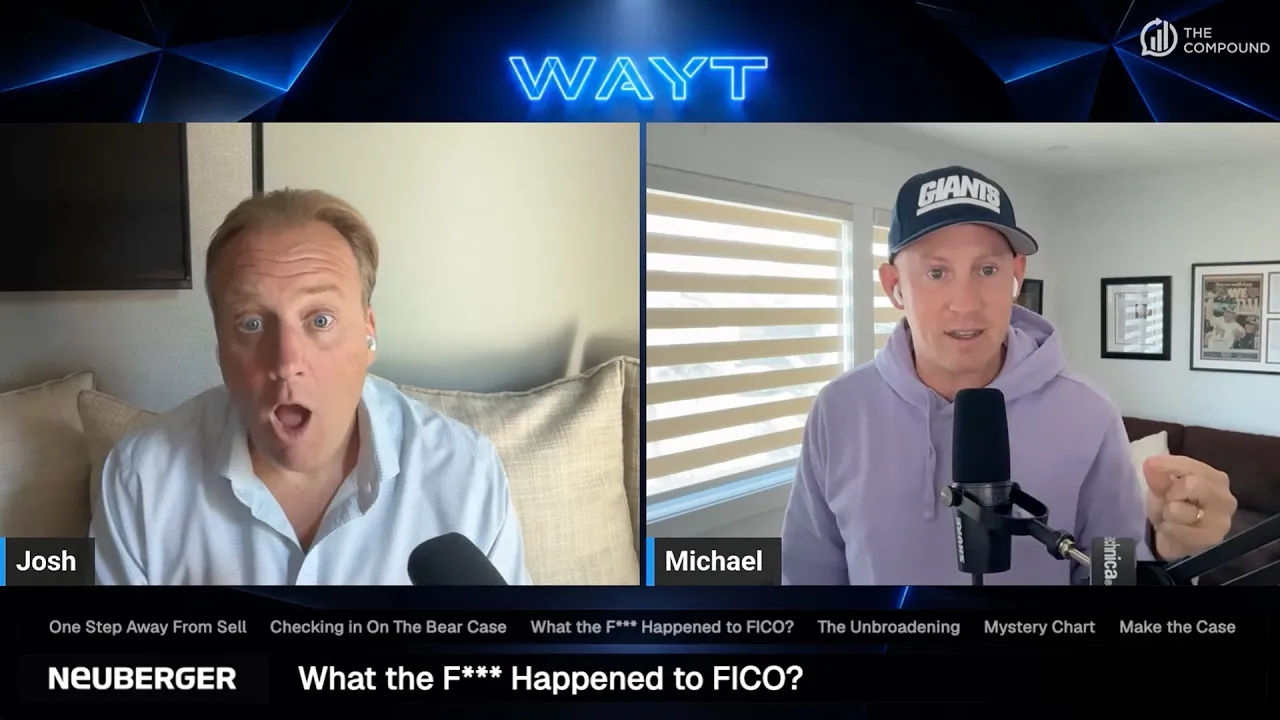
The Compound
Mega-cap tech cash flows and buybacks are artificially suppressing equity volatility and masking deep drawdowns across the broader market, leaving stocks exposed to an impending volatility shock.
AI-assisted summary of One Step Away From Sell | WAYT? — original source. Check the original for full context.
Source published:
Key ideas
- Bank of America's Sell Side Indicator reached within 30 basis points of triggering an official contrarian 'Sell' signal, even as the AAII retail bull-bear spread sat depressed at -25 percentage points. (3:55)
- Fair Isaac Corporation (FICO) collapsed 60% to 70% from its late 2024 peak after aggressive price hikes prompted the FHFA to repeal its exclusive scoring mandate, enabling rapid adoption of VantageScore. (30:00)
- Beneath calm headline index levels, market breadth has deteriorated significantly, with 29% of the Russell 3000 down at least 30% since June 1st. (43:08)
- Domestic oil refiners Valero, Marathon Petroleum, and Phillips 66 have doubled year-to-date, heavily decoupling from the broader energy sector due to soaring refining margins and lack of domestic refinery additions since the 1970s. (56:13)
Detailed notes
## Background This episode of What Are Your Thoughts was published by The Compound on YouTube on October 6, 2026. According to the show description, hosts Josh Brown and Michael Batnick explore whether the stock market is becoming overly bullish, evaluate subdued VIX levels amid deteriorating market breadth, examine Michael Burry's latest macro warning, and analyze FICO's sudden collapse alongside mega-cap tech concentration.
## TL;DR Josh Brown and Michael Batnick dissect a bifurcated equity market characterized by dormant index-level volatility, narrowing breadth, and mega-cap tech resilience contrasting with severe drawdowns across software and cyclical industries. They critically assess Michael Burry's persistent bearish stance, dismantling arguments around GPU depreciation and corporate debt issuance bottlenecks. The hosts detail the dramatic unraveling of Fair Isaac Corporation's (FICO) scoring monopoly following regulatory pushback and rapid adoption of VantageScore by mortgage lenders. Finally, they debate the re-emergence of speculative momentum in Cathie Wood's ARK funds, whether mega-caps qualify as modern defensive assets, and the extraordinary outperformance of independent energy refiners.
## Atmosphere & style The broadcast carries an energetic, rapid-fire banter grounded in Wall Street veteran camaraderie, seamlessly blending humorous barbs with quantitative market diagnostics. It feels like listening to two seasoned wealth managers debating in real time—pairing chart-driven skepticism with sharp counterarguments over market dogma. The dynamic balances Josh's animated, contrarian warnings of an impending October volatility shock against Michael's analytical pushback, creating a punchy, candid, and intellectually rigorous financial discussion.
## Bulletin - [03:55](https://www.youtube.com/watch?v=IYqPOO7a0T4&t=235s) Bank of America's Sell Side Indicator reached within 30 basis points of triggering an official contrarian 'Sell' signal, even as the AAII retail bull-bear spread sat depressed at -25 percentage points. - [30:00](https://www.youtube.com/watch?v=IYqPOO7a0T4&t=1800s) Fair Isaac Corporation (FICO) collapsed 60% to 70% from its late 2024 peak after aggressive price hikes prompted the FHFA to repeal its exclusive scoring mandate, enabling rapid adoption of VantageScore. - [43:08](https://www.youtube.com/watch?v=IYqPOO7a0T4&t=2588s) Beneath calm headline index levels, market breadth has deteriorated significantly, with 29% of the Russell 3000 down at least 30% since June 1st. - [56:13](https://www.youtube.com/watch?v=IYqPOO7a0T4&t=3373s) Domestic oil refiners Valero, Marathon Petroleum, and Phillips 66 have doubled year-to-date, heavily decoupling from the broader energy sector due to soaring refining margins and lack of domestic refinery additions since the 1970s.
## Key takeaways - [03:55](https://www.youtube.com/watch?v=IYqPOO7a0T4&t=235s) The equity market exhibits an unusual combination of 'no fear' and 'tons of doubt,' with the VIX hovering near 16 while valuation multiples contract despite record earnings. - [10:00](https://www.youtube.com/watch?v=IYqPOO7a0T4&t=600s) Wall Street strategists are trapped in bullish allocations because repeatedly lowering equity targets has caused them to get 'Mike Wilsoned' as corporate earnings outpace price gains. - [12:35](https://www.youtube.com/watch?v=IYqPOO7a0T4&t=755s) A sharp volatility disconnect persists across asset classes: equity volatility remains flatlined while JPMorgan FX volatility and BofA MOVE bond volatility remain elevated. - [20:00](https://www.youtube.com/watch?v=IYqPOO7a0T4&t=1200s) Michael Burry's persistent bearishness is shaped by the psychological vindication of his 2008 Big Short bet, leading him to continually shift rationales for an impending crash. - [23:05](https://www.youtube.com/watch?v=IYqPOO7a0T4&t=1385s) The bear thesis centered on rapid GPU obsolescence and aggressive depreciation write-downs is disproven by strong secondary rental pricing for older chips like the Nvidia H100. - [25:35](https://www.youtube.com/watch?v=IYqPOO7a0T4&t=1535s) Fixed-income debt markets show massive appetite for corporate paper, with Paramount attracting roughly $150 billion in orders and bond investors relying on equity momentum to validate AI debt. - [30:00](https://www.youtube.com/watch?v=IYqPOO7a0T4&t=1800s) Between 1990 and 2024, FICO was the single best-performing stock among continuous S&P 500 members, compounding at roughly 20% annualized prior to its recent collapse. - [33:15](https://www.youtube.com/watch?v=IYqPOO7a0T4&t=1995s) Mortgage lenders rapidly adopted VantageScore following FHFA regulatory relief, with Rocket Mortgage jumping from 0% to 41% usage and saving borrowers an average of $1,600 in closing costs. - [36:30](https://www.youtube.com/watch?v=IYqPOO7a0T4&t=2190s) FICO's sudden downfall illustrates 'stroke-of-the-pen risk,' where an entrenched monopoly is rapidly undermined by administrative or regulatory changes rather than slow antitrust litigation. - [38:50](https://www.youtube.com/watch?v=IYqPOO7a0T4&t=2330s) Nvidia's market capitalization approaching $6 trillion makes it larger than the entire Consumer Discretionary and Industrials sectors combined, forcing institutional managers into structural underweights. - [43:08](https://www.youtube.com/watch?v=IYqPOO7a0T4&t=2588s) Severe underlying drawdowns plague cyclical industries, with 40% of automotive stocks and 47% of software and services companies sitting in drawdowns of 30% or worse. - [45:00](https://www.youtube.com/watch?v=IYqPOO7a0T4&t=2700s) Duality Research indicates that the S&P 493 lagging mega-cap tech has historically resolved with the broader market catching up, whereas tech underperformance during a 'broadening' is the true macro warning sign. - [50:00](https://www.youtube.com/watch?v=IYqPOO7a0T4&t=3000s) Weakness in high-end consumer barometers like American Express, TJX Companies, and Walmart signals cracks in discretionary spending that bank earnings will need to validate. - [52:02](https://www.youtube.com/watch?v=IYqPOO7a0T4&t=3122s) Technical breakouts in an equal-weighted basket of seven ARK ETFs suggest that speculative risk capital is rotating out of defensive sectors and back into high-beta growth themes. - [54:02](https://www.youtube.com/watch?v=IYqPOO7a0T4&t=3242s) Josh and Michael debate whether mega-cap tech has replaced traditional defensive sectors like utilities and consumer staples as the market's new balance-sheet safe haven. - [56:13](https://www.youtube.com/watch?v=IYqPOO7a0T4&t=3373s) Valero, Marathon Petroleum, and Phillips 66 enjoy an effective domestic refining oligopoly due to zero major U.S. refinery builds since the 1970s, driving massive alpha versus the broader XLE index.
## Detailed walkthrough ### [00:00](https://www.youtube.com/watch?v=IYqPOO7a0T4&t=0s) Show Intro, Neuberger Sponsorship, and Bench Depth at The Compound
Josh Brown welcomes viewers to *What Are Your Thoughts*, joking right out of the gate with Michael Batnick about his evolving aesthetic. Michael ribs Josh that he is "slowly morphing into Fabio before our very eyes," to which Josh retorts that he is merely assuming his final form and only lacks a suntan, which he plans to fix on an upcoming trip to Boca Raton. After greeting the live audience on YouTube, Michael delivers the episode's sponsor spot for the Neuberger Short Duration Income ETF (ticker: NBSD). The ad highlights the risks of remaining parked in cash or ultra-short paper while central bank policies diverge and economic growth shifts, suggesting investors look slightly further out on the yield curve for yield advantage without excessive duration risk.
Following the sponsorship read, Michael reflects warmly on the prior week's episode, noting how much *nachas* (pride) he felt watching Chart Kid step up as guest host while Michael was traveling at cruising altitude at 30,000 feet. Seeing the live comments shower Chart Kid with praise demonstrated the bench depth at The Compound. Josh emphasizes how difficult it can be to produce a weekly show while both of them work full-time as wealth management executives at Ritholtz Wealth Management; having talented colleagues like Sean and Chart Kid who could easily anchor their own shows makes keeping the broadcast consistent far easier when regular hosts are away.
- **Sponsor Profile:** Neuberger Short Duration Income ETF (ticker: NBSD), focused on efficient income across rates and credit at the front end of the curve with an investment-grade risk profile. - **Roster Depth:** Michael and Josh credit in-house talents Sean and Chart Kid for keeping the broadcast running seamlessly while maintaining executive responsibilities.
---
[03:55](https://www.youtube.com/watch?v=IYqPOO7a0T4&t=235s) "One Step Away From Sell": No Fear, Tons of Doubt, and Savita Subramanian’s Indicator
Turning to the markets, Michael poses the core question of the episode: is the stock market truly "one step away from sell"? Josh answers by looking at the post-Great Financial Crisis regime, arguing that for nearly 18 years, the genuine message of the market to skeptics has simply been: "I dare you to sell. I dare you. Do it. Watch what happens." Even amidst persistent macroeconomic concerns, the market has not experienced so much as a 5% pullback from all-time highs. Josh points back to a thesis Michael raised earlier: the market exhibits virtually "no fear" (with the VIX sitting subdued around 16), yet it harbors "tons of doubt." This doubt is visible in valuation multiples contracting even as companies report record earnings, deliver upside surprises, and hike forward guidance. With the broader market up roughly 14% on the year while earnings growth has outpaced price gains, Josh frames 2026 as defined by an absence of panic paired with deep skepticism.
The discussion shifts to Bank of America head of US equity and quantitative strategy Savita Subramanian's latest research note featuring the BofA Sell Side Indicator (SSI). The SSI is a contrarian sentiment tool tracking the average recommended equity allocation by Wall Street strategists in a standard balanced fund. In September, the indicator climbed to within just 30 basis points of triggering an official "Sell" signal on its narrowing historical bands. While historically a powerful contrarian gauge during major market turning points, Josh notes the indicator's message conflicts with retail surveys: the AAII (American Association of Individual Investors) bull-bear spread dropped to -25 percentage points in mid-September—roughly 1.5 standard deviations below its 10-year average—revealing lingering bearishness among retail investors. Though strategist optimism is approaching cautionary thresholds, the conflicting signals make it noisy rather than an outright red light on the bull market.
```mermaid flowchart TD accTitle: Sell Side Indicator Contrarian Framework accDescr: Diagram contrasting Wall Street sell-side bullishness nearing a sell threshold with retail skepticism and strong earnings.
subgraph Sentiment["Market Sentiment Divergence"] A["BofA Sell Side Indicator (SSI)<br/>Strategist Equity Allocation"] -->|"30 bps away"| B["Approaching Extreme Bullishness<br/>('Sell' Signal Threshold)"] C["AAII Retail Survey<br/>Bull-Bear Spread (-25 pts)"] -->|"1.5 Std Dev Below Avg"| D["Lingering Bearishness / Skepticism"] end
subgraph Fundamentals["Market Reality"] E["Record Corporate Earnings &<br/>Raised Forward Guidance"] F["VIX at 16<br/>(No Fear, Contracting Multiples)"] end
Sentiment --> G["Contrarian Dilemma:<br/>Crowded Street vs. Resilient Fundamentals"] Fundamentals --> G ```
- **Market Resilience:** The market has not recorded even a 5% pullback from record highs despite persistent macro headwinds. - **Valuation Dynamic:** The S&P 500 is up roughly 14% on the year, but multiples have contracted because corporate earnings growth has expanded faster than equity prices. - **BofA Sell Side Indicator (SSI):** Wall Street strategists' recommended equity allocation rose in September, landing just 0.30% (30 bps) away from triggering an official contrarian sell warning. - **AAII Retail Divergence:** The AAII bull-bear spread bottomed around -25 percentage points in mid-September, sitting 1.5 standard deviations below its 10-year mean before slightly ticking up.
[10:00](https://www.youtube.com/watch?v=IYqPOO7a0T4&t=600s) ETF Outflows, Bearish Sentiment, and the Fear of Getting "Mike Wilsoned"
The conversation begins by contrasting hard market flows with prevailing investor sentiment. Michael Batnick notes that equity ETF inflows have cooled dramatically—a concrete data point rather than a mere feeling. At the same time, survey data like the AAII bull/bear index has been decidedly skewed toward the bears. Yet despite this, the market does not actually feel like it is gripped by extreme bullishness. Instead, Josh Brown observes that there is simply an utter absence of fear: there is no frantic race to buy put options or load up on portfolio hedges.
```mermaid flowchart TD accTitle: Strategist Allocation Dilemma accDescr: Chart showing why Wall Street strategists refuse to flip bearish despite risks. subgraph MarketReality["Market Backdrop"] A["Rising Interest Rates"] B["36% Nasdaq Earnings Growth"] C["S&P 500 at Record Highs"] end subgraph StrategistRisk["Strategist Dilemma"] D["Cut Exposure / Lower Targets"] E["'Get Mike Wilsoned' & Look Foolish"] end subgraph Outcome["Resulting Posture"] F["Hold Bullish Allocations"] G["VIX Remains Anchored at 16"] end A & B & C --> D D --> E E --> F F --> G ```
Josh points out that Wall Street asset allocators are deeply fatigued from being repeatedly rug-pulled. Every time strategists turn negative, trim equity exposure, or lower year-end S&P 500 price targets, they end up looking foolish a month later when the market rallies to new highs. Addressing Bank of America strategist Savita Subramanian's models, Josh argues there is an unstated asterisk in the data: professional strategists simply cannot afford to get "Mike Wilsoned" if they want to keep their jobs. With the index hitting all-time highs, the market actively dares allocators to flip bearish. Even though interest rates appear to climb almost daily, the VIX sits placidly around 16, powered by extraordinary fundamentals such as 36% earnings growth in the Nasdaq. For street strategists whose career models rely primarily on earnings trends, turning bearish under these conditions is nearly impossible.
- Equity ETF inflows have dried up sharply even as retail sentiment surveys (AAII) lean bearish. - The Cboe Volatility Index (VIX) remains pinned near 16 despite relentless upward pressure on Treasury yields. - Wall Street strategists prioritize earnings growth above all other allocation inputs, preventing them from lowering equity exposure.
---
[12:35](https://www.youtube.com/watch?v=IYqPOO7a0T4&t=755s) The Comatose Stock Market vs. Macro Volatility: Renaissance Macro's Warning
Josh highlights analysis from Renaissance Macro Research (RenMac) founder Jeff DeGraff, who pointed out that the VIX index won't budge and described the flatline as ominous. Looking at the cross-asset landscape, stock volatility is effectively asleep while other asset classes are experiencing substantial turbulence. A comparative look at the numbers shows: - The **VIX Index** has flatlined since March, hovering around 16.39. - The **JPMorgan Global FX Volatility Index** reflects significantly elevated currency volatility. - The **Bank of America MOVE Index** highlights turbulent bond yield volatility.
Michael questions whether the headline VIX is even the right gauge in modern market structure given historic index concentration. He wonders if an implied volatility index tracking the "S&P 493" (excluding the mega-cap tech giants) would tell a radically different story. While niche volatility measures exist—such as Nick Colas tracking implied volatility across the Russell 2000, Nasdaq, and semiconductor indices—Josh argues the headline VIX still reflects reality because mega-caps act as an index-wide tranquilizer. Apple is in a fresh product cycle making record highs, Nvidia has logged back-to-back all-time highs, Microsoft has stabilized, and Meta has resumed rally mode. Because these colossal companies mathematically dominate the cap-weighted S&P 500, their stability keeps the entire volatility complex pacified.
---
[15:00](https://www.youtube.com/watch?v=IYqPOO7a0T4&t=900s) The RenMac Market Cycle Clock and the Threat of an October Shock
The hosts next examine RenMac's Market Cycle Clock, a macro model tracking the interplay of economic growth and inflation. Bad things historically occur whenever the clock enters the top-right quadrant alongside a tightening Federal Reserve: - **1987:** On October 1, 1987, the cycle clock sat in the exact same upper-right quadrant right before the Black Monday market crash. - **2018:** With a newly appointed Fed chair hiking interest rates, the clock occupied the upper-right quadrant, producing two separate severe drawdowns in the S&P 500 within a single calendar year—one drop of 17% beginning in February, followed by a 21% plunge in the fourth quarter.
While the Fed currently appears on pause through early October, Neil Dutta notes that the central bank's bias remains tilted toward tightening rather than easing. Josh jokes about the funniest potential market outcome: investors could spend weeks agonizing over Fed policy, growth, and inflation, suffer a brief October flush, only for third-quarter earnings season to deliver blowout reports across the board and send the entire market ripping into year-end.
Michael argues that markets rarely crash over risks that are already widely publicized; a 10-year yield crossing 5.3% or lingering inflation is already factored into market consciousness. A genuine pullback would require an unexpected shock that nobody is currently pricing in—such as the 10-year yield suddenly blowing out to 6.0%, a major financial institution like Bank of America or Wells Fargo revealing catastrophic bond portfolio losses during the first week of earnings season, or tech giants aggressively slashing capital expenditure on frontier AI models. External geopolitical shocks represent another live threat, such as successful Houthi missile strikes on oil infrastructure broadening the Middle Eastern conflict far beyond the Strait of Hormuz theater.
Despite these clear and present dangers staring investors in the face, the equity market continues to look right past them. When Michael presses Josh on why he refuses to turn bearish, Josh insists that the tape itself is telling him to stay bullish. Michael then pivots the conversation to the bear case, introducing a fresh warning tweeted that morning by Michael Burry.
[20:00](https://www.youtube.com/watch?v=IYqPOO7a0T4&t=1200s) Michael Burry's Bear Case and the Psychology of "The Big Short"
Michael Batnick opens by reviewing a recent warning from Michael Burry, who asserted that the stock market is "quite obviously in its first stage of grief: denial," echoing the market crashes of 2000 and 2008 and predicting that this denial stage lasts six to nine months. Josh Brown jokes that it sounds like the opening line of a 2002 *TheStreet.com* column. The pair question Burry's audience, wondering who he is trying to reach—"the last five people following him that have money left?"
Josh rejects the idea that Burry acts in bad faith, giving him the most generous interpretation possible. Burry is not an evil supervillain trying to trick market participants; he genuinely believes what he says and bears the psychological scars of having once been 100% right when the entire world insisted he was wrong. However, Josh observes a common affliction among market veterans whose greatest professional milestone was being vindicated while everyone else failed: they were essentially carried off the floor of the New York Stock Exchange like national champions. In Burry’s case, that experience was supercharged: "Not only was he celebrated—they made a fucking Hollywood movie about it. He was played by Christian Bale." Experiencing that kind of legendary vindication alters a person, leaving them chasing that once-in-a-lifetime feeling forever.
Michael points out that even if Burry eventually happens to be correct six or nine months down the road, an analyst cannot reasonably take credit for predicting a decline after sitting negative through a 200% market advance. The goalposts constantly shift as Burry repeatedly uncovers new rationales to remain stubbornly bearish.
[23:05](https://www.youtube.com/watch?v=IYqPOO7a0T4&t=1385s) The GPU Depreciation Myth and Data Center Backlash
Michael revisits Burry’s primary operational bear thesis: that tech companies are artificially boosting reported earnings by extending the useful depreciation lifespan of their assets—specifically data center GPUs—which Burry characterized as one of the modern era's most common accounting frauds. The underlying assumption was that AI accelerators would suffer rapid obsolescence, forcing massive, unbudgeted write-downs.
That thesis, however, has failed to materialize. Michael points to an Andreessen Horowitz (a16z) "State of the Markets" report demonstrating that reports of GPU obsolescence are greatly exaggerated. Older chips, such as the Nvidia H100, are not seeing their rental value plunge; instead, persistent hardware shortages mean developers continue to pay robust rental rates to access them.
Josh adds that while there is genuine, widespread political pushback against AI data centers—from environmentalists protesting water and power usage, to locals worried a nearby facility will eliminate jobs, to politicians of both parties proposing moratoriums—the actual build-out has not halted. Aside from private credit lenders and a small enclave of Northern California technologists, data centers may be broadly unpopular, but construction continues unabated in accommodating municipalities. When suppliers like Micron raise their forward guidance rather than trimming it, the reality on the ground contradicts Burry's depreciation collapse. The entire premise that chip lifespans would fall short of expectations is "melting like an ice sculpture."
[25:35](https://www.youtube.com/watch?v=IYqPOO7a0T4&t=1535s) Hyperscaler Debt and Debunking the "Smart Money" Bond Myth
The conversation turns to another frequent bear argument: the fear that debt markets will eventually choke, refusing to absorb the hundreds of billions of dollars in bond issuance required for hyperscalers to fund AI infrastructure. Michael argues this risk can officially be put to rest due to the staggering amount of capital seeking yield.
As evidence, Michael cites a *Wall Street Journal* report on a massive corporate debt offering for Paramount, which attracted roughly $150 billion in orders—massively oversubscribing the deal. Josh reacts with disbelief: "Fucking Paramount, dude. A strong showing that nearly tripled... Oh, and Oracle is the best money in the world?" If a legacy media company like Paramount can see tens of billions of dollars chasing its paper at around a 9% yield, the idea that cash-rich giants like Amazon or Meta will struggle to tap fixed-income markets is completely ungrounded.
```mermaid flowchart TD accTitle: Traditional vs Current Bond-Equity Dynamic accDescr: Flowchart illustrating how equity performance now dictates fixed-income appetite for tech debt.
subgraph Traditional["Historical Market Dogma"] B1["Bond Market: The 'Smart Money'"] -->|"Signals leading economic truth"| E1["Equity Market Follows"] end
subgraph Current["Current Market Reality"] E2["Equity Rally & Product Traction\n(e.g., Meta stock jumps 30%, Microsoft hits 52-week highs)"] -->|"Stock market validates business model"| B2["Bond Buyers Step In"] B2 -->|"Massive demand for debt auctions"| H2["Infrastructure Fully Funded"] end ```
Josh takes aim at the decades-old financial truism that the bond market represents the "smart money" whose cerebral signals equity investors must follow. He argues that this dynamic has completely inverted: - Bond investors now look directly at the equity market for validation. - When Meta rallied 30% in two weeks following a major product release, fixed-income worries over tech balance sheets evaporated almost overnight. - Investors recognized that Meta had consumer traction and the ability to monetize AI, distinct from speculative infrastructure plays like CoreWeave. - With Microsoft quietly touching fresh 52-week highs, debt investors assume equity analysts have already vetted the winners, leaving bondholders confident to finance the build-out.
[29:20](https://www.youtube.com/watch?v=IYqPOO7a0T4&t=1760s) Setting the Stage for FICO's Collapse
Michael transitions into the next major segment by focusing on Fair Isaac Corporation (FICO). He notes the rare, culturally entrenched nature of the company: its consumer-facing product—the FICO score—is so deeply embedded in everyday financial language that the public refers to credit scores directly by the company's ticker symbol.
Despite operating what has historically been seen as an unassailable financial tollbooth, the stock has suddenly begun to get destroyed. To understand what went wrong, Michael notes that he tasked his research team to dig deep into the underlying data to diagnose the collapse.
[30:00](https://www.youtube.com/watch?v=IYqPOO7a0T4&t=1800s) The Historic Reign and Shock Collapse of FICO
Prior to its current drawdown of 60% to 70% off its November 2024 peak, Fair Isaac Corporation (FICO) held an astonishing, little-known distinction: across the roughly 220 to 230 companies that remained continuously in the S&P 500 from 1990 through 2024, FICO was the single best-performing stock in the entire index. Josh Brown admits utter shock at this stat, confessing that if asked, he would have assumed the top spot had to belong to a massive mega-cap like Apple. Yet even after suffering a violent crash, FICO remains the tenth best-performing survivor over that 36-year stretch, compounding at roughly 20% annualized.
The secret to that historic outperformance was an absolute, ironclad monopoly. As Michael Batnick emphasizes, this was not merely "monopolistic" behavior—FICO effectively owned Boardwalk with four hotels on it. For decades, a FICO score was the only metric that mattered for consumer credit approvals, spinning off predictable 20% to 30% operating margins year after year. While some casual observers initially attributed the stock's downturn to AI disruption or broad weakness in the housing and software sectors, the true catalyst was self-inflicted corporate greed meeting federal intervention.
```mermaid flowchart TD accTitle: FICO Pricing Escalation and Regulatory Disruption accDescr: Diagram illustrating how FICO price hikes triggered FHFA intervention and adoption of VantageScore by mortgage lenders. subgraph Pricing["FICO Price Escalation"] A["Historic Baseline: ~$0.60 - $1.00 per score"] --> B["Aggressive Price Hikes: Up to $5.00 - $10.00"] end subgraph Regulatory["Regulatory Intervention"] B --> C["FHFA / Bill Pulte intervene against rising closing costs"] C --> D["Repeal of FICO-only mandate for Fannie & Freddie"] end subgraph Adoption["Alternative Adoption"] D --> E["VantageScore (Equifax, Experian, TransUnion)"] E --> F["Lender Adoption Surges (Rocket Mortgage: 0% to 41%)"] F --> G["Borrowers save ~$1,600 in loan closing costs"] end ```
- FICO stood as the #1 performing stock in the S&P 500 from 1990 to 2024 among the ~220 continuous member companies. - Even factoring in the subsequent 60%–70% crash, the stock still ranks as the 10th best performer over that 36-year horizon. - The company sat at the convergence of two underperforming market themes: software disruption and housing sluggishness.
---
[33:15](https://www.youtube.com/watch?v=IYqPOO7a0T4&t=1995s) How VantageScore Broke the Monopoly
FICO's undoing began when management started aggressively hiking pricing from roughly $0.60 to $1.00 per score up to $5.00, and in some cases as high as $10.00. Because mortgage lenders pass scoring fees directly to consumers in their closing costs, the Federal Housing Finance Agency (FHFA) stepped in. Government officials, including Bill Pulte, pushed back against the escalating tollbooth and repealed the regulatory mandate requiring Fannie Mae and Freddie Mac to rely exclusively on FICO scores. This opened the door for VantageScore—a rival scoring system created in 2006 and jointly owned by the three major credit bureaus (Equifax, Experian, and TransUnion), functioning much like the bank consortium behind Zelle.
Once the regulatory barrier vanished over the summer of 2026, mortgage giants swiftly embraced VantageScore to lower origination friction. Rocket Mortgage saw its share of borrowers scored via VantageScore skyrocket from 0% in May to 41%, while United Wholesale Mortgage jumped from 0% to 26%. Rocket reported that VantageScore actually qualified more prospective buyers while trimming an average of $1,600 in closing costs per loan. Facing an immediate loss of volume and pricing power, Wall Street aggressively rerated FICO into the single worst-performing stock in the S&P 500 year-to-date, down 60%.
The crash occurred despite seemingly resilient headline numbers: the CEO opened their latest earnings call raising fiscal 2026 guidance and touting aggressive share buybacks. However, analysts at Goldman Sachs and Wells Fargo slashed their ratings as the core economic moat evaporated, while securities fraud investigations commenced over whether management misled investors regarding impending regulatory risks.
- Pricing per score jumped from $0.60–$1.00 up to $5.00–$10.00 before regulatory pushback. - Rocket Mortgage's use of VantageScore surged from 0% in May to 41%. - United Wholesale Mortgage pushed VantageScore usage from 0% to 26%. - VantageScore delivered borrowers an average savings of $1,600 per loan at closing. - FICO collapsed 60% year-to-date, landing at the very bottom of the S&P 500 performance table.
---
[36:30](https://www.youtube.com/watch?v=IYqPOO7a0T4&t=2190s) Stroke-of-the-Pen Risk and De Facto Monopolies
FICO's rapid downfall prompts a broader debate between Brown and Batnick about "stroke-of-the-pen risk"—the rare instances where an entrenched corporate monopoly can be dismantled overnight by administrative fiat or an act of Congress. Josh points to Apple's App Store as a primary theoretical target. If antitrust regulators were ever able to legally compel Apple to open iOS to third-party stores or slash its 30% take rate, the impact on Apple's bottom line would be devastating; however, antitrust litigation against big tech moves glacially over many years rather than striking overnight.
Batnick suggests independent oil refiners as another domestic parallel. Because the United States has not constructed a new major oil refinery since the 1970s, a tight oligopoly of refiners—specifically Valero, Phillips 66, and Marathon Petroleum—effectively commands domestic refining capacity. All three have seen their share prices double as the top performers in the Energy Select Sector SPDR Fund (XLE). While highly improbable, a theoretical regulatory shift permitting rapid new refinery permits would instantly undermine their pricing power. Ultimately, the hosts agree that true single-pen-stroke regulatory destructions like FICO's are remarkably rare in equity markets, which explains why the market revalued the company downward so violently.
- Apple's App Store 30% fee represents a massive regulatory target, though antitrust proceedings move significantly slower than agency rule changes. - Valero, Phillips 66, and Marathon Petroleum hold a de facto refining oligopoly due to zero major U.S. refinery builds since the 1970s. - All three refiners led the Energy Select Sector SPDR Fund (XLE) as top performers, roughly doubling in price.
---
[38:50](https://www.youtube.com/watch?v=IYqPOO7a0T4&t=2330s) The "Unbroadening" and Mega-Cap Tech Ascendance
The conversation pivots from single-stock wreckage to overall market structure and the return of "the unbroadening." Throughout the spring and into the summer, market commentators had cheered broadening participation, celebrating the fact that cyclical sectors, value names, and the equal-weighted index were finally joining the rally. That breadth expansion has since reversed completely, dragging the market back into a narrow regime dominated by mega-cap technology while everything else languishes.
Josh highlights research from Todd Sohn illustrating just how concentrated the S&P 500 has become around its primary leader: Nvidia. Trading at fresh all-time highs and approaching a staggering $6 trillion market capitalization, Nvidia alone has grown larger than entire sectors of the economy, including the entirety of Consumer Discretionary and Industrials. This extreme distortion underscores how heavily the major indices rely on a tiny handful of semiconductor and AI leaders to maintain positive momentum.
- Market breadth has rolled over, marking an end to the spring/summer expansion and a return to mega-cap tech dominance. - Nvidia reached an all-time high, approaching a market capitalization of nearly $6 trillion. - Nvidia's single market weight now eclipses the entire S&P 500 Consumer Discretionary sector as well as the Industrials sector.
[40:00](https://www.youtube.com/watch?v=IYqPOO7a0T4&t=2400s) The Scale Constraints on Nvidia and Mega-Cap Hegemony
Josh Brown and Michael Batnick explore the sheer, unprecedented weight of Nvidia inside the S&P 500, noting that the single semiconductor company is now larger than consumer staples and energy combined. Bringing up Geoffrey West's book *Scale*, Michael reflects on the biological reality that an elephant can only grow so large before facing the physical constraints of its own body and food supply. Applying that logic to markets, he argues that Nvidia's compressing price-to-earnings multiple isn't necessarily a referendum on the sustainability of its booming earnings narrative; rather, it reflects the sheer physics of scale. If Nvidia traded at a runaway premium multiple, its market cap would become mathematically absurd—pushing $13 trillion or swallowing 40% of the entire index.
Josh adds that virtually every active mutual fund manager is practically forced to be underweight Nvidia. With the stock commanding nearly 9% of the S&P 500, no client gives an active manager capital with instructions to run an overweight position at 12%—300 basis points above the index weight. Consequently, even when Nvidia is projected to print blistering 85% to 90% earnings growth in an upcoming quarter, the Street simply will not award it a 50x multiple. Instead, the company faces a unique capital allocation puzzle: its treasury is practically overflowing with free cash flow, and management is deploying it into global equity stakes and aggressive share repurchases. When the market prices Nvidia down to 21 times earnings, the company itself steps in and buys its own stock. Josh highlights the surreal reality that one corporation’s cash flow is supporting its own enormous market capitalization, which in turn acts as the load-bearing foundation keeping the entire stock market afloat.
- **Index scale**: Nvidia alone commands nearly 9% of the S&P 500, eclipsing the entire energy and consumer staples sectors combined. - **Active management constraints**: Almost every mutual fund manager is structurally underweight mega-cap tech, unable to justify allocating 12%+ of a portfolio to a single name. - **Corporate buybacks**: Nvidia's massive free cash flow allows it to aggressively buy back its own shares at lower valuations (around 21x earnings), effectively backstopping the broader market.
---
[43:08](https://www.youtube.com/watch?v=IYqPOO7a0T4&t=2588s) The Unbroadening: Breadth Deterioration and Hidden Drawdowns
Turning to market breadth, the hosts pull up research by Alex at Duality Research showing the S&P 500 tech sector (in purple) printing fresh all-time highs while the rest of the market (ex-tech) stalls out. The rolling two-month correlation between tech and the rest of the market has sunk to its most extreme negative reading since the bull market began in late 2022. A companion chart from NegligibleCap illustrates the severity of drawdowns beneath the surface across various industry groups since June 1st.
Examining the data, Josh and Michael focus on the column tracking stocks mired in a 30% or worse drawdown. Across the broader Russell 3000, a striking 29% of stocks have suffered a 30%+ collapse. Certain economically sensitive industries have taken severe beatings: 40% of automotive and components stocks are down at least 30%, while in software and services, an astounding 47% of equities are enduring drawdowns of 30% or worse. Josh points out that outside of a mega-cap giant like Microsoft, the broader software complex has quietly been getting slaughtered.
```mermaid flowchart TD accTitle: Market Breadth Divergence Breakdown accDescr: Visualizing the gap between mega-cap tech leadership and the deep underlying drawdowns across the Russell 3000.
subgraph Leaders ["Market Drivers"] Tech["Mega-Cap Tech / Mag 7<br/>(Pushing New All-Time Highs)"] end
subgraph Underbelly ["The Unbroadening: Russell 3000 Underneath"] R3K["29% of Russell 3000<br/>in 30%+ Drawdown"] Auto["Automobiles & Components:<br/>40% in 30%+ Drawdown"] Soft["Software & Services:<br/>47% in 30%+ Drawdown"] end
Tech -.->|"Extreme Negative Correlation"| Underbelly ```
- **Russell 3000 damage**: 29% of all constituents are sitting in a drawdown of 30% or worse since June 1st. - **Automotive industry**: 40% of automobile and component stocks have plunged 30% or more. - **Software sector carnage**: 47% of software and services companies are currently in a 30%+ drawdown.
---
[45:00](https://www.youtube.com/watch?v=IYqPOO7a0T4&t=2700s) The Reverse Warning Sign and October Surprise Risks
Looking at a composite chart from ChartKit tracking the "unbroadening," the hosts point out that the cumulative advance-decline line has fallen sharply, the equal-weight index has suffered a steady bleed, and the percentage of stocks trading above their 200-day moving average has tumbled from 75% down to 40% in rapid fashion. Meanwhile, the Mag 7 names march upward and to the right. While only one in three stocks is currently outperforming the index—down from 60% earlier in the summer—Michael makes a counterintuitive, bullish point.
Citing a study from Duality Research, Michael explains that critics have the breadth argument backwards. Historically during this bull market, when the "S&P 493" diverges to the downside against technology, it does not act as a sell signal for the general market; instead, the broader market historically rips higher to catch up to tech leadership. In fact, Duality's data suggests the true warning sign occurs when tech weakens and the rest of the market attempts to take the baton during an apparent "broadening."
Josh, however, remains skeptical of smooth sailing ahead. While agreeing that the mega-caps do not necessarily have to collapse, he expects a sharp VIX spike in October. Pointing to Jeff deGraaf's charts, Josh cannot fathom how equity volatility can remain totally flatlined while currency and fixed-income volatility are running hot, alongside the pressures of a slow-motion interest rate shock and an upcoming election cycle. From a wealth management perspective, Josh notes that Ritholtz Wealth Management is proactively having conversations with clients who have become egregiously overweight equities due to the rally, taking opportunistic trims to rebalance into bonds where appropriate.
- **200-day metric**: The share of stocks trading above their 200-day moving average plunged from 75% down to 40%. - **Market beat rate**: Only about 33% of stocks are outperforming the S&P 500 year-to-date, down from 60% earlier in the year. - **Duality Research takeaway**: Historically, tech outperforming while the 493 lags leads to the broader market catching up to large caps, whereas technology weakness during a market "broadening" has served as the real macro warning flag.
[50:00](https://www.youtube.com/watch?v=IYqPOO7a0T4&t=3000s) Earnings Shock Signals and the Breakdown in Consumer Discretionary
Josh Brown clarifies that any impending downward shock to the broader market will likely not originate from mega-cap technology earnings. Instead, the true canary in the coal mine will be the upcoming earnings reports from major financial institutions. If banks report that the consumer remains resilient, loan losses are nonexistent, credit card delinquencies are non-threatening, and the outlook into the fourth quarter remains bright, Josh concedes he will gladly walk back his bearish stance: "I will shut the fuck up." A clean bill of health from the financials would prove that fears of an October shock are overblown and that it is simply business as usual.
However, Michael Batnick highlights that if there is one distinct corner of the equity market sounding genuine alarm bells, it is consumer discretionary and retail. While certain weak spots can be explained away by company-specific issues—such as McDonald's facing idiosyncratic headwinds, Home Depot suffering under a frozen housing market, or Pepsi and consumer staples getting crushed because investors prefer a 5% risk-free Treasury yield over a 3% dividend—the damage extends much deeper.
Stocks like Walmart, TJX Companies (TJ Maxx), and especially American Express are getting hit hard. Michael stresses that American Express is a critical macro barometer because it represents the top and the upper-middle of the "K-shaped" economic recovery. When higher-tier discretionary spending names and prime credit networks are "getting mauled," it sends a tangible warning signal about consumer durability that cannot be easily dismissed.
- Home Depot's weakness is tied directly to the depressed state of housing turnover. - Consumer staples face severe yield competition from 5% short-term Treasuries. - American Express serves as a key signal of upper-income consumer spending under pressure.
---
[52:02](https://www.youtube.com/watch?v=IYqPOO7a0T4&t=3122s) Make the Case: Is Cathie Wood Back?
Transitioning into the recurring "Make the Case" segment, Michael revisits an argument he floated two weeks prior: the potential resurrection of Cathie Wood and ARK Invest. While refusing to take an early victory lap because the move is still short term, Michael draws attention to a compelling chart highlighted by JC Parets at an industry event. The chart constructed an equal-weighted composite of all seven core ARK ETFs—spanning genomics, space exploration, robotics, fintech, and speculative tech.
```mermaid flowchart TD accTitle: ARK ETF Composite Risk Appetite Flow accDescr: Visualizing the shift of capital from defensive staples into speculative ARK themes.
subgraph CapitalRotation ["Market Rotation"] Outflow["Capital Outflows<br/>(Defensive Sectors / XLP)"] Inflow["Capital Inflows<br/>(High-Beta Growth / ARK Basket)"] end
subgraph ARKComposite ["ARK 7-ETF Composite Basket"] ARKK["ARKK (Flagship Innovation)"] ARKG["ARKG (Genomics)"] ARKF["ARKF (Fintech)"] ARKQ["ARKQ (Robotics/Autonomous)"] ARKX["ARKX (Space Exploration)"] end
Outflow -->|"Risk-On Rotation"| Inflow Inflow --> ARKK & ARKG & ARKF & ARKQ & ARKX ```
This composite basket recently flashed a clear technical breakout. Rather than tracking traditional indicators, Michael argues that investors should watch where actual capital is flowing, quoting Nassim Taleb: "Don't tell me what you think. Show me your portfolio." Despite widespread economic hand-wringing, institutional and retail money has been quietly shifting out of defensive sectors like consumer staples and rotating directly into hyper-growth, speculative high-beta equities—the exact pond in which Cathie Wood fishes. Even if the broader market's logic turns out to be wrong down the road, active buyers are demonstrably leaning into speculative risk right now.
---
[54:02](https://www.youtube.com/watch?v=IYqPOO7a0T4&t=3242s) The Mega-Caps as Modern "Defensive" Plays: A Sharp Disagreement
The conversation turns to sector classification, sparking a sharp philosophical debate between Josh and Michael regarding what qualifies as "defensive" in today's market environment. Historically, technicians and portfolio managers weighed the Consumer Staples ETF (XLP) against the Consumer Discretionary ETF (XLY) to measure risk appetite. Josh argues that traditional defensive sectors—staples and utilities—are no longer genuinely defensive. Instead, they operate primarily as interest-rate proxies burdened by high input costs, weak lower-income consumers, and direct competition from high cash yields.
In Josh's view, investors seeking modern defense are no longer buying Procter & Gamble or utility companies; they are treating Apple, Microsoft, and Nvidia as the "default" or "easy button." Market participants use these mega-caps as defensive balance sheets offering reliable free cash flow just as often as they deploy them for aggressive offensive beta.
Michael pushes back aggressively against this framing, refusing to accept mega-cap tech as defensive:
> "I can't get there with you... They're not defensive... The Mag 7, they're not defensive. Just stop."
Michael insists that crowding into the Magnificent Seven during market jitters is purely unhedged risk-seeking disguised as "muscle memory" because those names historically led every rebound. Josh counters that this persistent structural behavior proves they now function with a defensive flavor in modern portfolio management, regardless of their nominal valuation.
---
[56:13](https://www.youtube.com/watch?v=IYqPOO7a0T4&t=3373s) Mystery Chart: The Unstoppable Energy Refiners
As financial journalist Jason Zweig makes a surprise appearance off-camera at the Altruist office, the hosts move on to the "Mystery Chart." Josh provides Michael with a single clue: the visual displays the three strongest stocks within one of the otherwise lamest, most neglected sectors of the market—names completely breaking away from their underlying peer group. Michael guesses instantly: "Are these refiners?"
Josh applauds the guess, revealing the chart to be a performance comparison of Valero Energy (VLO), Marathon Petroleum (MPC), and Phillips 66 (PSX). Michael reveals a rare behind-the-scenes portfolio action: in Ritholtz Wealth Management's internal Porterhouse strategy, they had to trim Valero for the first time since inception because it triggered their strict maximum-weighting rule after an extraordinary run.
Josh breaks down why refiners have decoupled so aggressively from the broader Energy Select Sector SPDR Fund (XLE):
```mermaid flowchart LR accTitle: Refiners Outperformance Drivers accDescr: Factors explaining how refiners broke out of the broader energy sector.
subgraph Drivers ["Catalysts"] CrackSpread["Refining Margins<br/>(Crack Spreads)"] Diesel["Strong Diesel Demand"] NoNatGas["Zero Natural Gas Drag"] end
subgraph Decoupling ["Outperformance"] Refiners["Refiners Basket:<br/>Valero / Marathon / Phillips 66"] XLE["Broader Energy Sector (XLE)<br/>(Lagging Crude & Gas E&Ps)"] end
CrackSpread & Diesel & NoNatGas --> Refiners Refiners -.->|"Massive Alpha Divergence"| XLE ```
- Valero exploded from roughly $100 per share in late 2024 to well over $400, surging over 120% year-to-date. - The outperformance is driven by refining margins and diesel strength rather than crude oil prices, entirely bypassing the headwinds hurting natural gas producers. - An overlay chart of refiners versus XLE demonstrates that these equities have broken completely free of sector constraints, generating massive, "AI-like" returns inside an old-economy space. - Josh emphasizes that quantitative screens highlighting the "best stocks in the market" are vital because nobody could have anticipated this breakout through thematic guesswork alone. - As Josh quips regarding technical discipline and downside protection: "God sent Moses down from Mount Everest to explain to the people stop losses for exactly that reason."
---
[59:20](https://www.youtube.com/watch?v=IYqPOO7a0T4&t=3560s) Predicting the Next VIX Spike and Wrapping Up
To close out the show, Michael poses a final forward-looking question: between now and the end of the month, which scenario is more likely—a relief rally where interest rates fall and the broader market rips higher, or a sharp volatility shock marked by a sudden VIX spike?
Josh plants his flag firmly on the volatility side, predicting that an upcoming episode of the show will inevitably be titled *"Josh Called the VIX Spike."* When Michael calls him out for shifting his original prediction window from Halloween to Thanksgiving, Josh jokes that he will happily claim full credit if it happens in October and partial credit if it hits in November.
The hosts sign off by reminding listeners of the week's upcoming content across The Compound network: - A new episode of *Animal Spirits* with Michael Batnick and Ben Carlson on Wednesday. - The next *Ask The Compound*, noting that audience questions have been pouring in "over the transom." - An upcoming episode of *The Compound and Friends* featuring a fan-favorite guest. - An announcement for a major fourth-quarter event in New York City, which will be revealed first to subscribers of the newsletter at `thecompoundnews.com`.
## Notable quotes > [00:00](https://www.youtube.com/watch?v=IYqPOO7a0T4&t=0s) slowly morphing into Fabio before our very eyes — Michael Batnick
> [03:55](https://www.youtube.com/watch?v=IYqPOO7a0T4&t=235s) I dare you to sell. I dare you. Do it. Watch what happens. — Josh Brown
> [20:00](https://www.youtube.com/watch?v=IYqPOO7a0T4&t=1200s) the last five people following him that have money left? — Josh Brown
> [20:00](https://www.youtube.com/watch?v=IYqPOO7a0T4&t=1200s) Not only was he celebrated—they made a fucking Hollywood movie about it. He was played by Christian Bale. — Josh Brown
> [23:05](https://www.youtube.com/watch?v=IYqPOO7a0T4&t=1385s) melting like an ice sculpture — Josh Brown
> [25:35](https://www.youtube.com/watch?v=IYqPOO7a0T4&t=1535s) Fucking Paramount, dude. A strong showing that nearly tripled... Oh, and Oracle is the best money in the world? — Josh Brown
> [50:00](https://www.youtube.com/watch?v=IYqPOO7a0T4&t=3000s) I will shut the fuck up. — Josh Brown
> [52:02](https://www.youtube.com/watch?v=IYqPOO7a0T4&t=3122s) Don't tell me what you think. Show me your portfolio. — Michael Batnick
> [54:02](https://www.youtube.com/watch?v=IYqPOO7a0T4&t=3242s) I can't get there with you... They're not defensive... The Mag 7, they're not defensive. Just stop. — Michael Batnick
> [56:13](https://www.youtube.com/watch?v=IYqPOO7a0T4&t=3373s) God sent Moses down from Mount Everest to explain to the people stop losses for exactly that reason. — Josh Brown
> [59:20](https://www.youtube.com/watch?v=IYqPOO7a0T4&t=3560s) Josh Called the VIX Spike — Josh Brown
## Mentioned Josh Brown, Michael Batnick, Chart Kid, Sean, Savita Subramanian, Mike Wilson, Jeff DeGraff, Nick Colas, Neil Dutta, Michael Burry, Bill Pulte, Todd Sohn, Geoffrey West, JC Parets, Jason Zweig, Ben Carlson, Bank of America, Renaissance Macro Research, Andreessen Horowitz (a16z), Micron, Paramount, Oracle, Meta, Microsoft, CoreWeave, Fair Isaac Corporation (FICO), Fannie Mae, Freddie Mac, Federal Housing Finance Agency (FHFA), VantageScore, Equifax, Experian, TransUnion, Rocket Mortgage, United Wholesale Mortgage, Goldman Sachs, Wells Fargo, Apple, Valero Energy, Phillips 66, Marathon Petroleum, Nvidia, Duality Research, McDonald's, Home Depot, Pepsi, Walmart, TJX Companies, American Express, ARK Invest, Cathie Wood, Procter & Gamble, Altruist, Ritholtz Wealth Management, The Compound, Neuberger Short Duration Income ETF (NBSD), S&P 500, Cboe Volatility Index (VIX), BofA Sell Side Indicator (SSI), AAII Sentiment Survey, MOVE Index, JPMorgan Global FX Volatility Index, Russell 2000, Russell 3000, Energy Select Sector SPDR Fund (XLE), Consumer Staples ETF (XLP), Consumer Discretionary ETF (XLY), ARKK, Scale by Geoffrey West
## Video description On this episode of What Are Your Thoughts, Josh Brown and Michael Batnick discuss: whether the stock market is getting too bullish, why the VIX remains unusually calm, and what weakening market breadth could mean for investors. They also break down Michael Burry’s latest warning, Nvidia’s growing influence on the S&P 500, FICO’s stunning collapse, and the disconnect between mega-cap tech and the rest of the market.
This episode is sponsored by Neuberger. Explore NBSD - including all risks and important information - at https://www.neuberger.com/nbsd
👕 Check out The Compound shop: https://www.idontshop.com
►00:00 - Intro ►03:55 - One Step Away From Sell ►19:55 - Checking in On The Bear Case ►29:20 - What the f*** happened to FICO? ►39:14 - The Unbroadening ►52:02 - Make the Case ►56:13 - Mystery Chart
🎙️Listen to our podcasts: TCAF: https://podcasts.thecompoundnews.com/show/TCAF/ Animal Spirits: https://podcasts.thecompoundnews.com/show/animalspirits/ Ask The Compound: https://podcasts.thecompoundnews.com/show/ATC/
The Compound Newsletter: https://www.thecompoundnews.com/subscribe
Linkedin: https://www.linkedin.com/company/the-compound-media/ Instagram: https://instagram.com/thecompoundnews Twitter: https://twitter.com/thecompoundnews Tik Tok: https://www.tiktok.com/@thecompoundnews
Investing involves the risk of loss. This podcast is for informational purposes only and should not be or regarded as personalized investment advice or relied upon for investment decisions. Josh Brown and Michael Batnick are employees of Ritholtz Wealth Management and may maintain positions in the securities discussed in this video. All opinions expressed by them are solely their own opinion and do not reflect the opinion of Ritholtz Wealth Management. See our disclosures here: https://ritholtzwealth.com/podcast-youtube-disclosures/
The Compound Media, Incorporated, an affiliate of Ritholtz Wealth Management, receives payment from various entities for advertisements in affiliated podcasts, blogs and emails. Inclusion of such advertisements does not constitute or imply endorsement, sponsorship or recommendation thereof, or any affiliation therewith, by the Content Creator or by Ritholtz Wealth Management or any of its employees. For additional advertisement disclaimers see here https://ritholtzwealth.com/advertising-disclaimers.
Neuberger Disclosure: Investors should consider the Fund’s investment objectives, risks, fees, and expenses carefully before investing. This and other important information can be found in the Fund’s prospectus, and, if available, summary prospectus, which you can obtain by calling 877.628.2583. Please read the prospectus, and, if available, the summary prospectus, carefully before making an investment. Neuberger Berman BD LLC, is the distributor of the Fund and a FINRA member.
#thecompound #investing #stockmarket #stocks
[Source](https://www.youtube.com/watch?v=IYqPOO7a0T4)