OpenAI Uses Codex to Patch Live Kubernetes Outages Without Rollbacks
OpenAI
Pairing observability telemetry with agentic Codex runners enables automated root-cause isolation and live patching, removing human engineers from the critical triage path during production outages.
AI-assisted summary of Production Monitoring with Codex: Grafana, Kubernetes, & Security — original source. Check the original for full context.
Source published:
Key ideas
- Codex can diagnose production incidents by correlating live telemetry directly with release diffs, generating in-place code patches that eliminate errors without requiring full version rollbacks. (0:02)
- For containerized infrastructure, Codex's Kubernetes rollout investigator reconstructs the causal chain of events behind runtime failures like OOMKilled crashes and cascading multi-service outages. (3:06)
- Codex supports automated runner architectures inside Kubernetes or Grafana that trigger directly from alert breaches and use multi-agent validation to remove humans from the triage critical path. (3:06)
- Service availability issues caused by unmetered workloads monopolizing shared worker pools can be identified and mitigated as security vulnerabilities using the Codex Security plugin. (6:00)
Detailed notes
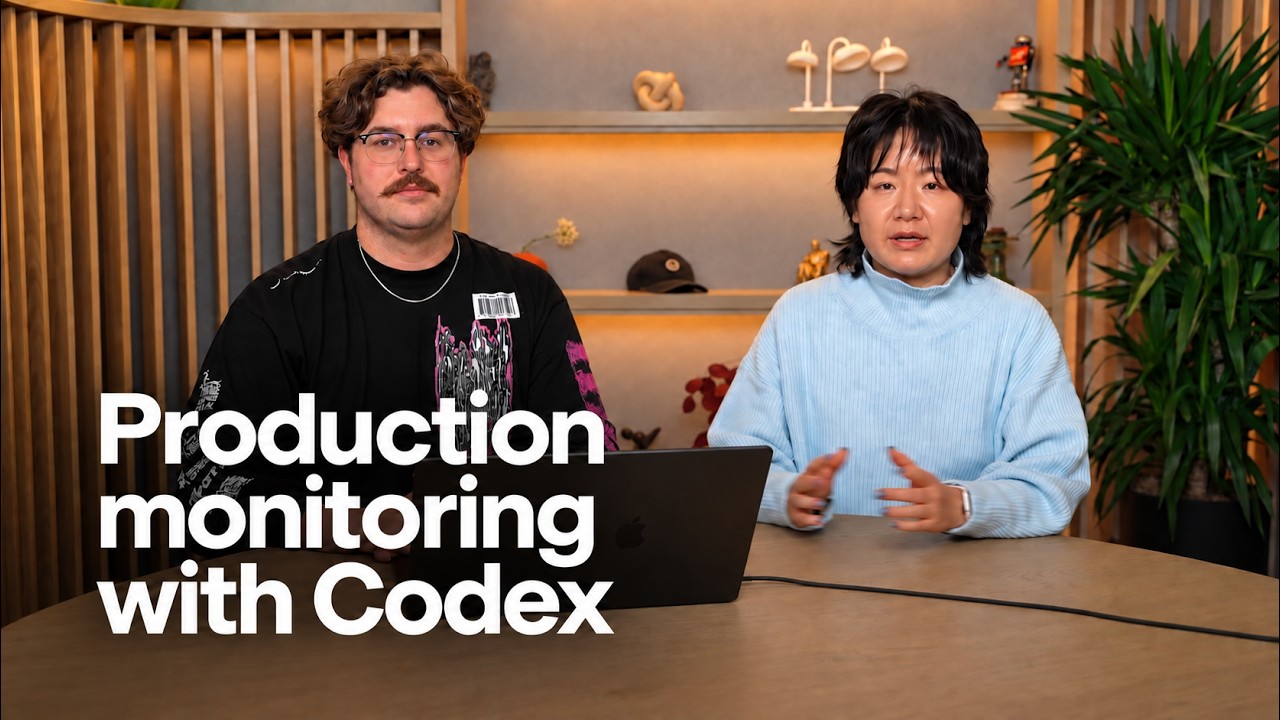
## Background Published on YouTube by OpenAI on October 7, 2026, this technical session features cohosts Tony Loehr and Anke Hao demonstrating how to triage and resolve critical on-call outages. According to the video description, the presentation walks through three production monitoring scenarios using Codex to examine Grafana checkout failures, debug Kubernetes rollout out-of-memory restarts, and connect application availability to security resource limits.
## TL;DR The video demonstrates how Codex streamlines production incident remediation across telemetry, container infrastructure, and application security. In the first scenario, Codex pinpoints a post-deployment 20% checkout failure by cross-referencing Grafana metrics with release diffs, generating a zero-rollback hotfix approved in minutes. The hosts then investigate an out-of-memory cascading failure across Kubernetes services, using a specialized rollout skill to reconstruct the causal chain and discussing both human-in-the-loop and autonomous multi-agent runner architectures. Finally, Codex Security diagnoses a thread-starving query in a shared worker pool, applying guardrails that treat resource exhaustion as an availability vulnerability.
## Atmosphere & style The presentation evokes the high-stakes, adrenaline-fueled tension of a 3:00 a.m. production outage, which steadily softens into an orderly, reassuring engineering workflow. Tony Loehr and Anke Hao share a collaborative, practical rapport, guiding viewers through terminal windows and Grafana dashboards with steady technical precision. It feels less like a polished marketing pitch and more like looking over the shoulder of seasoned on-call engineers replacing frantic manual debugging with calm, one-click agentic remediations.
## Bulletin - [00:02](https://www.youtube.com/watch?v=DmCaBWv5yG8&t=2s) Codex can diagnose production incidents by correlating live telemetry directly with release diffs, generating in-place code patches that eliminate errors without requiring full version rollbacks. - [03:06](https://www.youtube.com/watch?v=DmCaBWv5yG8&t=186s) For containerized infrastructure, Codex's Kubernetes rollout investigator reconstructs the causal chain of events behind runtime failures like OOMKilled crashes and cascading multi-service outages. - [03:06](https://www.youtube.com/watch?v=DmCaBWv5yG8&t=186s) Codex supports automated runner architectures inside Kubernetes or Grafana that trigger directly from alert breaches and use multi-agent validation to remove humans from the triage critical path. - [06:00](https://www.youtube.com/watch?v=DmCaBWv5yG8&t=360s) Service availability issues caused by unmetered workloads monopolizing shared worker pools can be identified and mitigated as security vulnerabilities using the Codex Security plugin.
## Key takeaways - [00:02](https://www.youtube.com/watch?v=DmCaBWv5yG8&t=2s) Traditional 3 a.m. incident triage is slowed down by the manual correlation needed to connect telemetry metrics with recent deployment histories and commit diffs. - [00:02](https://www.youtube.com/watch?v=DmCaBWv5yG8&t=2s) A custom Codex skill can instantly evaluate P95 latency, response times, checkout counts, and overall service health during active alerts. - [00:02](https://www.youtube.com/watch?v=DmCaBWv5yG8&t=2s) Using bounded evidence workflows, Codex identifies root causes across release diffs without requiring engineers to manually sift through commit SHAs. - [00:02](https://www.youtube.com/watch?v=DmCaBWv5yG8&t=2s) Codex supports in-place remediation on current releases, generating hotfixes that reduce error rates to zero instead of forcing a rollback to an older service version. - [03:06](https://www.youtube.com/watch?v=DmCaBWv5yG8&t=186s) Code updates that pass CI/CD pipelines can still trigger runtime OOMKilled errors in Kubernetes, rapidly causing cascading failures across APIs and edge gateways. - [03:06](https://www.youtube.com/watch?v=DmCaBWv5yG8&t=186s) Tracing and reconstructing the causal chain of events during infrastructure failures is one of Codex's most valuable features for both monitoring and security. - [03:06](https://www.youtube.com/watch?v=DmCaBWv5yG8&t=186s) Organizations can implement a human-in-the-loop workflow where on-call engineers review and approve Codex-generated patches before deployment. - [03:06](https://www.youtube.com/watch?v=DmCaBWv5yG8&t=186s) Codex can be deployed as autonomous runners within Kubernetes or observability platforms, initiating investigations immediately upon an alert threshold breach. - [03:06](https://www.youtube.com/watch?v=DmCaBWv5yG8&t=186s) Pairing Codex runners with multi-agent systems allows secondary agents to test and validate patches automatically, removing humans from the critical triage path. - [06:00](https://www.youtube.com/watch?v=DmCaBWv5yG8&t=360s) Outages can occur without new code deployments when massive, complex requests enter shared worker pools and starve critical user-facing traffic. - [06:00](https://www.youtube.com/watch?v=DmCaBWv5yG8&t=360s) The Codex Security plugin treats resource starvation as a security issue by identifying abusive query patterns and missing resource bounds. - [06:00](https://www.youtube.com/watch?v=DmCaBWv5yG8&t=360s) Engineers can validate availability patches by replaying offending heavy requests to verify that defensive guardrails block worker exhaustion. - [06:00](https://www.youtube.com/watch?v=DmCaBWv5yG8&t=360s) Pairing security tools with production observability reveals lateral remediation capabilities that are typically overlooked when running monitoring and security in silos.
## Detailed walkthrough ### [00:02](https://www.youtube.com/watch?v=DmCaBWv5yG8&t=2s) The 3 A.M. Incident: Checkout Failures and Grafana Triage
The scenario opens on every on-call engineer's worst nightmare: it is 3:00 a.m., the phone starts buzzing, and checkout errors are spiking rapidly. Opening Grafana reveals the damage, but knowing where to start troubleshooting during an outage is a notoriously difficult problem. As Anke Hao points out, determining what is broken requires understanding both what is affected and what changed. While telemetry dashboards provide one angle, an engineer still has to chase down deployment context, commit histories, and the underlying code—a process filled with tedious, repetitive correlation work.
```mermaid flowchart LR accTitle: Codex Bounded Evidence Remediation Workflow accDescr: Flow diagram showing telemetry gathering, root-cause diff analysis, human approval, and hotfix deployment. subgraph S1["Detection & Telemetry"] A["Grafana Alerts<br/>20% Error Rate"] --> B["Codex Custom Skill"] B --> C["Telemetry Gathering<br/>P95, Health, Response Time"] end subgraph S2["Analysis & Remediation"] C --> D["Release Diff &<br/>Bounded Evidence"] D --> E["Proposed Code Patch"] E --> F{"Engineer Approval<br/>'approve'"} F --> G["Patched v2 Deployed<br/>0% Error Rate"] end ```
To demonstrate how Codex streamlines this triage, Tony Loehr steps through an incident triggered right after rolling out release `v2` of a service repository. Following the deployment, the checkout error rate suddenly climbs to roughly 20%. Rather than manually sifting through log streams and Git blame records, the team invokes a custom Codex skill to inspect the checkout evidence:
- **Metrics evaluated**: Codex rapidly inspects successful checkouts, latency and response times, P95 metrics, and general service health. - **Root-cause isolation**: Leveraging a bounded evidence workflow alongside the release diff, Codex analyzes the diff between releases without requiring the engineer to track down individual commits. - **In-place remediation**: Instead of forcing a roll back to `v1`, Codex formulates a patch directly on `v2`. Once the engineer types `approve`, the hotfix deploys within seconds, driving the checkout error rate back down to zero while keeping the service on the latest version. - **Time saved**: The typical manual workflow—jumping across multiple dashboards, tracking down commit SHAs, and writing hotfixes during a stressful hour-long triage—is compressed into an agentic workflow taking only minutes.
---
[03:06](https://www.youtube.com/watch?v=DmCaBWv5yG8&t=186s) Kubernetes Rollout Failures and Automated Runner Architectures
Tony shifts the investigation from service-level metrics to containerized infrastructure on Kubernetes. The sample architecture consists of an inventory API cluster, an orders API cluster, and an edge gateway. A newly pushed update to the inventory API passes all CI/CD pipeline checks, yet immediately after deployment, the container gets `OOMKilled` (out-of-memory killed). The failure quickly triggers a cascading outage across the cluster, knocking down the orders API and the edge gateway alongside it.
To resolve the outage, Tony triggers the "Kubernetes rollout investigator skill" in Codex. Codex inspects the live rollout, traces the failure, and reconstructs the causal chain of events—which Tony highlights as "probably the most valuable aspect of Codex both for security and production monitoring purposes." Once Codex diagnoses the failure mechanism and prepares a patch, Tony issues an approval command. The updated container configuration rolls out, restoring baseline health across the inventory API, orders API, and edge gateway.
Reflecting on the architecture, Anke highlights two operational models for running Codex in production environments: - **Human-in-the-loop triage**: An engineer gets paged by an alert, launches Codex to investigate and generate a patch, and reviews the remediation before approving deployment. - **Autonomous runners & multi-agent systems**: Organizations can run Codex runners directly inside Kubernetes, Grafana, or an external observability platform. When metric thresholds breach baseline alerts, Codex can trigger autonomously from the alert itself, investigate, and draft the patch. By pairing this with a multi-agent system, secondary agents can validate and test proposed fixes automatically, taking humans out of the critical path entirely.
---
[06:00](https://www.youtube.com/watch?v=DmCaBWv5yG8&t=360s) Bridging Production Availability and Codex Security
In the final demonstration, Tony and Anke explore the subtle intersection where observability meets application security. In this scenario, an outage occurs in the absence of any recent deployments. Telemetry shows that checkout requests are grinding to a halt because a single, massive report request has entered a shared worker pool, monopolizing available compute and starving all surrounding checkout traffic.
Instead of treating the event purely as an infrastructure capacity problem, the team leverages the Codex Security plugin. The plugin analyzes the resource starvation behavior, identifies the abusive query pattern, and generates a security patch that places guardrails and limits on expensive operations:
- **Validation via replay**: After approving the security patch, the team replays the offending request; the system successfully blocks the oversized query rather than allowing it to exhaust shared worker pool threads. - **Availability as security**: By enforcing request complexity and resource bounds, the security patch directly restores service availability. - **Lateral capabilities**: Tony emphasizes that pairing security plugins with production observability uncovers powerful lateral use cases that engineering teams often overlook when operating monitoring and security tools in isolation.
## Notable quotes > [00:02](https://www.youtube.com/watch?v=DmCaBWv5yG8&t=2s) determining what is broken requires understanding both what is affected and what changed. — Anke Hao
> [03:06](https://www.youtube.com/watch?v=DmCaBWv5yG8&t=186s) probably the most valuable aspect of Codex both for security and production monitoring purposes. — Tony Loehr
## Mentioned Codex, Codex Security, Grafana, Kubernetes, OpenAI, Tony Loehr, Anke Hao
## Video description It’s 3 a.m. and checkout errors are climbing. What do you check first?
Join cohosts Tony Loehr and Anke Hao for three practical production-monitoring demos with Codex. Follow a checkout failure in Grafana, investigate a Kubernetes rollout that causes out-of-memory restarts, and explore how a Codex Security finding connects service availability to a missing resource limit.
See how telemetry, release history, and code support an investigation; learn how engineers review a proposed change and check the result.
[Source](https://www.youtube.com/watch?v=DmCaBWv5yG8)