AI Hardware Surge Drives 85% of S&P Gains as Rest of Market Stalls
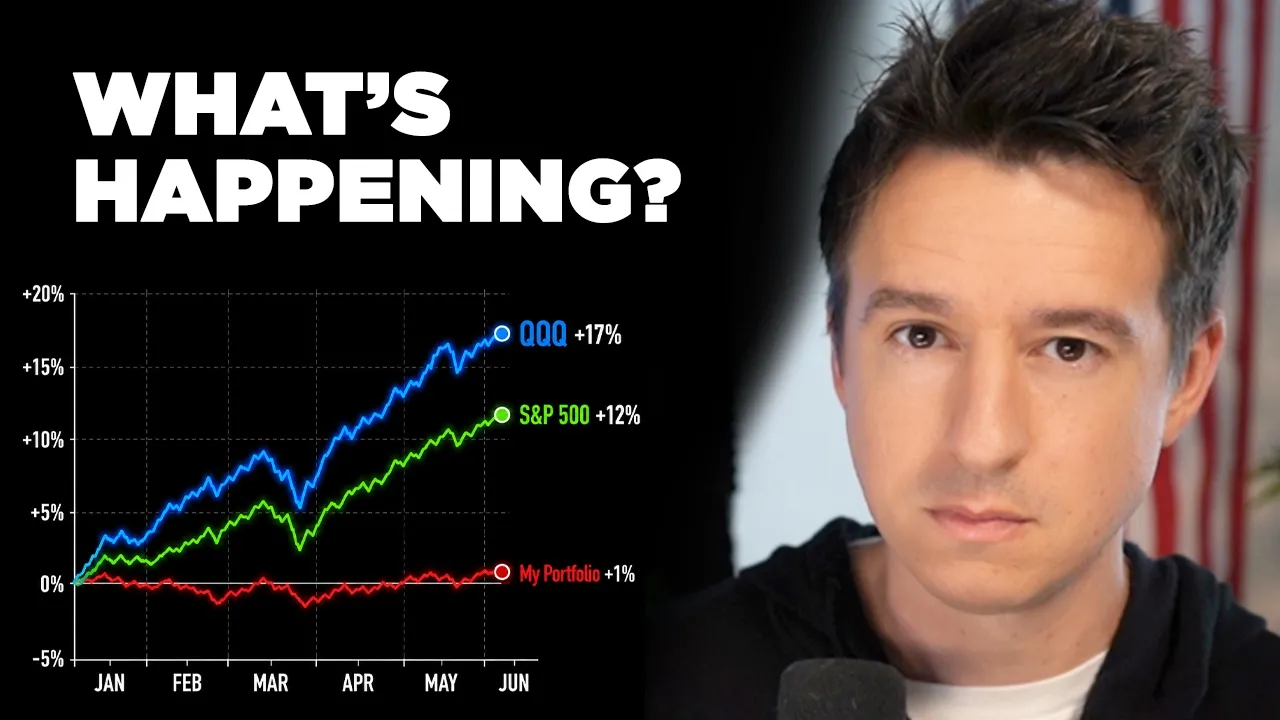
Something Has Gone Terribly Wrong — Joseph Carlson After Hours

Joseph Carlson After Hours

Because top-line revenue growth dictates nearly three-quarters of decade-long equity returns while valuation multiple shifts fade, staying invested in fundamental compounders outweighs chasing the narrow cyclical hardware rally.

AI-assisted summary of Something Has Gone Terribly Wrong — original source. Check the original for full context.

Source published:

Key ideas

  • Extreme stock market concentration has left the S&P 500 heavily reliant on just two sectors—semiconductors and tech hardware—which generated roughly 85% of total index gains while 40% of member stocks declined. (3:19)
  • Microsoft announced it is overhauling its operating structure from three segments down to two, formally breaking out Azure revenue as a standalone line item to enable direct comparisons against AWS and Google Cloud. (17:30)
  • Alphabet dodged a court-ordered breakup of its ad-tech business after a federal judge rejected the Department of Justice's divestiture remedy, leaving Google's core assets intact. (21:52)
  • S&P Global is exploring a multibillion-dollar spinoff of its Capital IQ Pro terminal software, reflecting a strategic pivot toward licensing underlying financial data catalogs directly across platforms and AI systems. (19:45)

Detailed notes

## Background Published on YouTube on September 3, 2026, by Joseph Carlson After Hours, the video addresses broader stock market dynamics and portfolio performance. The video description highlights an overview of current market movements, Microsoft's cloud reporting transparency, S&P Global rumors, Google's antitrust developments, and a humorous weekly fail, alongside links to Carlson's investment analysis platform, Qualtrim.

## TL;DR Joseph Carlson addresses his portfolio's modest +1.3% year-to-date return compared to the S&P 500's +13.2% gain, exploring why balanced stock-picking has lagged behind an extremely concentrated market rally driven by AI hardware and select biotechs. Rather than pivoting to chase cyclical winners that sat stagnant for a decade before spiking, Carlson explains why he is holding steady with consistent, double-digit revenue compounders. The episode also covers Microsoft's decision to directly disclose Azure revenues, S&P Global's rumored spinoff of Capital IQ Pro, Google dodging a structural ad-tech breakup in court, and a White House teleprompter operator penalized by the CFTC for insider wagering on Kalshi.

## Atmosphere & style The presentation carries a grounded, transparent, and analytical tone, opening with honest vulnerability about the psychological frustration of watching a portfolio sit flat while benchmark indexes surge. Carlson maintains a disciplined, data-first delivery, systematically dismantling emotional panic with historical metrics, decade-long charts, and cool-headed conviction. The episode shifts from rigorous corporate analysis into lighthearted satire at the finish, delivering an engaging mix of serious portfolio introspection and relaxed financial commentary.

## Bulletin - [03:19](https://www.youtube.com/watch?v=rTnKM_NzsKg&t=199s) Extreme stock market concentration has left the S&P 500 heavily reliant on just two sectors—semiconductors and tech hardware—which generated roughly 85% of total index gains while 40% of member stocks declined. - [17:30](https://www.youtube.com/watch?v=rTnKM_NzsKg&t=1050s) Microsoft announced it is overhauling its operating structure from three segments down to two, formally breaking out Azure revenue as a standalone line item to enable direct comparisons against AWS and Google Cloud. - [21:52](https://www.youtube.com/watch?v=rTnKM_NzsKg&t=1312s) Alphabet dodged a court-ordered breakup of its ad-tech business after a federal judge rejected the Department of Justice's divestiture remedy, leaving Google's core assets intact. - [19:45](https://www.youtube.com/watch?v=rTnKM_NzsKg&t=1185s) S&P Global is exploring a multibillion-dollar spinoff of its Capital IQ Pro terminal software, reflecting a strategic pivot toward licensing underlying financial data catalogs directly across platforms and AI systems.

## Key takeaways - [00:00](https://www.youtube.com/watch?v=rTnKM_NzsKg&t=0s) Joseph Carlson's portfolio sits at +1.3% year to date (~$17,000 in gains), sharply lagging the S&P 500's +13.2% rise after four consecutive years of outperformance from 2022 to 2025. - [03:19](https://www.youtube.com/watch?v=rTnKM_NzsKg&t=199s) The S&P 500's double-digit rally is driven by extreme breadth narrowing, with semiconductors and hardware delivering nearly 85% of index gains while the bottom 90% of companies added less than 2%. - [03:19](https://www.youtube.com/watch?v=rTnKM_NzsKg&t=199s) Institutional stock pickers experienced the same headwind, with Goldman Sachs reporting the worst monthly underperformance for hedge funds relative to the S&P 500 in over two decades. - [09:13](https://www.youtube.com/watch?v=rTnKM_NzsKg&t=553s) The benchmark's top performers are concentrated in AI memory hardware (SanDisk +457%, Dell +300%, Micron +200%) and clinical biotech developments rather than consistent consumer compounders. - [10:32](https://www.youtube.com/watch?v=rTnKM_NzsKg&t=632s) A 10-year chart analysis reveals that most of 2026's top-performing hardware stocks stagnated for 8 to 10 years before experiencing sudden, parabolic repricings. - [12:44](https://www.youtube.com/watch?v=rTnKM_NzsKg&t=764s) Steady compounders like Costco and Mastercard deliver consistent, linear decade-long returns without requiring multi-year stagnation followed by sudden momentum bursts. - [14:47](https://www.youtube.com/watch?v=rTnKM_NzsKg&t=887s) Empirical return attribution shows valuation multiples drive 46% of 1-year returns but only 5% of 10-year returns, whereas revenue growth accounts for 74% of long-term returns. - [14:47](https://www.youtube.com/watch?v=rTnKM_NzsKg&t=887s) Carlson chose to maintain his portfolio allocations because his holdings project forward 12-month revenue growth of 15.8%, outpacing the S&P 500's 11.0% projection by nearly 80%. - [17:57](https://www.youtube.com/watch?v=rTnKM_NzsKg&t=1077s) Microsoft's segment reorganization ends a decade of opacity by splitting out Azure financials from the Intelligent Cloud umbrella, providing direct transparency for cloud market share. - [19:45](https://www.youtube.com/watch?v=rTnKM_NzsKg&t=1185s) S&P Global's rumored Capital IQ Pro spinoff aims to shed front-end terminal software competition and reposition the firm as a pure-play, high-margin data and index provider. - [21:52](https://www.youtube.com/watch?v=rTnKM_NzsKg&t=1312s) The antitrust decision shielding Google from an ad-network breakup signals ongoing judicial skepticism toward forced corporate breakups as antitrust remedies. - [23:01](https://www.youtube.com/watch?v=rTnKM_NzsKg&t=1381s) Former White House teleprompter operator Gabriel Perez was penalized $172,000 by the CFTC for using advance access to presidential speeches to bet on prediction market Kalshi.

## Detailed walkthrough ### [00:00](https://www.youtube.com/watch?v=rTnKM_NzsKg&t=0s) A Terribly Wrong Year-to-Date Performance

Opening the portfolio view reveals what feels like an alarming reality: year-to-date performance sits at just +1.3%. It is not a calculation error or a glitch in the software; that is the true time-weighted return for the year, translating to a modest gain of roughly $17,000. While making a little bit of money means capital is not technically being lost, the result feels profoundly disappointing when stacked against the broader market. Over the same timeframe, the S&P 500 has surged by a staggering 13.2%, creating an enormous double-digit performance gap. For any active investor looking at their own portfolio sitting flat while the broad index races ahead, the immediate reaction is that "something has gone terribly wrong," prompting an urgent review into whether fundamental mistakes are being made or if a complete change in strategy is warranted.

```mermaid flowchart TD accTitle: S&P 500 Return Distribution in 2026 accDescr: Breakdown of the S&P 500 showing how 2 out of 24 sectors account for 85 percent of all gains while 90 percent of stocks sit flat or negative.

subgraph TopDriver["AI Infrastructure (2 of 24 Sectors)"] Semis["Semiconductors"] Hard["Tech Hardware & Equipment"] end

subgraph RestOfMarket["Rest of the Market (90% of Stocks)"] Flat["Contributed <2% of Gains"] Red["40% of S&P Stocks in the Red"] end

TopDriver -->|"Drives ~85% of Index Gains"| Market["S&P 500 (+10% to +13%)"] RestOfMarket -->|"Virtually Zero Net Impact"| Market ```

Before unpacking the mechanics behind this market divergence, several major corporate and regulatory developments loom large across the market. Microsoft has announced a notable shift toward transparency by breaking out Azure revenue as its own dedicated reporting line item. Meanwhile, rumors indicate that S&P Global may be preparing to divest Capital IQ, raising important portfolio implications for long-term shareholders. Google has once again dodged a forced corporate breakup in court, maintaining a perfect two-for-two track record against major regulatory separation attempts. On the lighter side, the "fail of the week" features a White House teleprompter operator who ran into serious trouble after placing advance bets on what Donald Trump was going to say in upcoming public addresses.

- Portfolio year-to-date return: +1.3% (total gain of approximately $17,000). - Comparative S&P 500 index return: +13.2%. - Upcoming Qualtrim coverage: An in-depth portfolio review exceeding an hour in length, detailing current valuations, fair-value buy prices, and specific allocation plans.

---

[02:02](https://www.youtube.com/watch?v=rTnKM_NzsKg&t=122s) Four Years of Outperformance Meet the 2026 Breather

Placing the current stagnation into historical context shows that the portfolio’s broader track record tells a completely different story. Since 2022, the portfolio had beaten the S&P 500 every single year without interruption—beating the index in 2022, 2023, 2024, and 2025. Yet stepping into 2026, that multi-year winning streak has hit an abrupt wall. At various points in the trading week, returns hover at a mere 0.81% year-to-date. The portfolio has essentially traded sideways through the entire first eight months of the year, acting as though "it was tired of the past 4 years of winning and now it decided, I need to take a breather."

Entering September with essentially zero capital appreciation while the S&P 500 advances by double digits and the Nasdaq 100 (QQQ) climbs even faster naturally triggers psychological doubt. When a portfolio sits dead flat while indexes set records, it is easy to assume that structural flaws have crept into the investment thesis. However, rather than succumbing to emotional panic or blindly chasing index momentum, rational investors must analyze the precise underlying forces pulling the major benchmarks upward to understand why broad stock-picking strategies are stalling.

---

[03:19](https://www.youtube.com/watch?v=rTnKM_NzsKg&t=199s) Bill Ackman, Narrow Breadth, and Historic Concentration

The primary engine powering the S&P 500 and the QQQ in 2026 is an extreme concentration of capital into a narrow band of companies. As hedge fund manager Bill Ackman highlighted in his mid-year shareholder report, the market's seemingly broad rally is an illusion created by just two specific sectors out of the S&P 500's total 24 industry sectors: semiconductors and technology hardware and equipment. These two sectors, serving as the essential "picks and shovels" of artificial intelligence infrastructure, are responsible for nearly 85% of the S&P 500’s total year-to-date gains.

This degree of concentration has hollowed out overall market breadth to historically rare levels:

| Market Metric | 2026 Figure | Context / Implication | |:--- |:--- |:--- | | **S&P 500 Headline Gain** | ~10% – 13% | Driven almost exclusively by AI hardware and chipmakers | | **Top 2 Sectors' Share of Gains** | ~85% | Semiconductors and Tech Hardware & Equipment carry the index | | **Bottom 90% of S&P Stocks** | <2% of Return | Collective net performance of roughly 450 companies | | **S&P Stocks in the Red** | 40% | Nearly half of the index has experienced negative returns | | **Hedge Fund Relative Performance** | 20-Year Low | Worst monthly underperformance versus the S&P 500 in over two decades (July) |

Unless a portfolio is heavily overweight these specific semiconductor and hardware names, keeping pace with the benchmark has been nearly impossible. Professional institutional managers face the exact same wall; Goldman Sachs reported that hedge funds logged their worst relative underperformance against the S&P 500 in July in more than twenty years simply because they held balanced portfolios across the other 90% of the market.

---

[06:24](https://www.youtube.com/watch?v=rTnKM_NzsKg&t=384s) The Bizarre Top 10 Performers Driving the Benchmark

A major factor complicating the environment for fundamental stock pickers is that 2026’s biggest winners are largely unpredictable, niche, or low-visibility businesses rather than predictable, compound-growth franchises. Inspecting the top ten performers in the S&P 500 reveals an unusual lineup dominated by specialized foundries, commodity hardware, and high-risk biotechs:

- **#10: United Microelectronics Corporation (UMC) (+151% YTD)** — A pure-play semiconductor foundry focused on mature node wafers, specialty power magnetic ICs, microcontrollers, and automotive chips. - **#9: Western Digital (+135% YTD)** — The legacy hard drive and storage manufacturer best known to retail consumers for portable disk drives on Amazon, surging as enterprise data demand spikes. - **#8: Revolution Medicines (RVMD) (+166% YTD)** — A specialized oncology biotech that rallied after regulatory approval of a daily oral treatment targeting metastatic pancreatic endocrine conditions—a development virtually impossible to forecast without deep medical and oncology credentials. - **#7: Bloom Energy (+171% YTD)** — A clean energy provider specializing in the manufacture and long-term servicing of solid oxide fuel cell systems. - **#6: Corcept Therapeutics** — Another highly specialized pharmaceutical developer operating well outside the domain of mainstream consumer predictability. - **#4: Micron Technology (+200% YTD)** — A massive pillar of the current rally, Micron has surged into a $1.07 trillion valuation, seeing its profit margins and net income explode upward at a pace unprecedented in memory chip history. - **#3: Dell Technologies** — Long viewed by everyday consumers as an aging PC maker defined by bulky beige desktop towers and floppy disk drives, the company has reinvented itself into a primary builder of AI server infrastructure, driving massive equity outperformance.

[09:13](https://www.youtube.com/watch?v=rTnKM_NzsKg&t=553s) The S&P 500's Top Gainers: AI Hardware and Random Biotechs

Looking at the upper echelon of the market leaders, Dell stands out as a massive $342 billion market cap giant with its stock soaring 300%. While consumer desktop PCs are no longer a common sight, Dell successfully pivoted toward a far more lucrative market: selling enterprise infrastructure through its Infrastructure Solutions Group. They are driving massive demand through PowerEdge servers, AI factory systems, and networking equipment designed specifically for artificial intelligence workloads.

Right behind Dell sits Moderna as the second-highest gainer year to date in the S&P 500, continuing to capitalize on its massive immunization and vaccine development pipeline. Taking the undisputed number one spot as the best-performing stock in the S&P 500 is SanDisk. Now valued at $227 billion, the memory firm is up an astronomical 457% year to date. Most everyday consumers know SanDisk simply as the brand behind cheap solid-state drives bought on Amazon, but they possessed the right technology, the right manufacturing capabilities, and found themselves "in the right place at the right time."

When examining the top ten gainers lifting the broader index, a distinct pattern emerges: seven are semiconductor or memory hardware players riding the AI wave, while the other three are pharmaceutical companies propelled by major clinical breakthroughs. These select names are the primary engine pulling the broader market upward, creating a stark contrast with steady, diversified portfolios that appear entirely flat by comparison.

- **Dell Technologies**: Market cap reached $342 billion; stock up 300% year to date driven by PowerEdge AI servers and infrastructure solutions. - **Moderna**: Ranked #2 best performer year to date in the S&P 500. - **SanDisk**: Ranked #1 best performer year to date in the S&P 500; market cap reached $227 billion; up 457%. - **Top 10 Breakdown**: 7 semiconductor/hardware companies and 3 pharmaceutical/biotech companies.

---

[10:32](https://www.youtube.com/watch?v=rTnKM_NzsKg&t=632s) The 10-Year Anomaly: Decade-Long Stagnation Before Explosive Bursts

Taking complete personal ownership of portfolio performance is essential: "I'm not trying to make excuses. I own the performance of my portfolio. I don't blame anybody else. I'm not trying to blame the market for it being flat. That's on me. I picked to own these stocks." However, understanding *why* these market-leading stocks are suddenly skyrocketing requires zooming out to a 10-year view to spot underlying anomalies.

A decade-long chart reveals that nearly all of these top performers experienced virtually zero progress for the better part of eight to ten years before their sudden parabolic move. Western Digital sat completely flat for nine straight years until late 2025 and 2026, when its boom suddenly materialized. Revolution Medicines was flat for a decade before surging over the past 18 months. Seagate Technology languished for ten years with zero net gains before taking off. An energy company in the cohort oscillated in the same tight trading range for nine years, and Corcept Therapeutics chopped sideways for eight and a half years before catching a massive spike. Micron Technology gained nothing for eight and a half years of the decade. Dell showed some steady progress prior to 2026, whereas Moderna swung wildly with immense unpredictability, and SanDisk’s standalone chart only traced back to its recent standalone period.

Investors holding these names were forced to sit through years of dead money, hoping circumstances would eventually pivot in their favor. Predicting three years ago that stagnant memory manufacturers like Micron or SanDisk would suddenly lead the S&P 500 was nearly impossible for most market participants, and chasing them after a 400% run means buying an asset that has already been aggressively repriced.

---

[12:44](https://www.youtube.com/watch?v=rTnKM_NzsKg&t=764s) Linear Compounders vs. Unpredictable Spikes

The erratic boom-and-bust trajectory of cyclical hardware contrasts sharply with organic compounders. Looking back at Costco, where initial purchases were made around $160 per share in 2017, the stock never suffered an eight-year drought followed by an overnight mania. Instead, its ascent was gradual and sustained, consistently establishing new highs over time. Texas Roadhouse exhibits the exact same organic, decade-long compounding pattern.

Payment network giants Visa and Mastercard demonstrate how operational consistency mirrors stock trajectory. Over the past decade, Mastercard gained roughly 500% excluding dividends in a remarkably steady, linear fashion. While every stock experiences routine pullbacks, consistent compounders do not sit dead in the water for ten years before spiking vertically over twelve months. At present, capital across the broader market is chasing high-momentum hardware repricings, leaving reliably growing businesses unrewarded and largely ignored in the short term.

```mermaid flowchart TD accTitle: Growth Trajectory Comparison accDescr: Visual flowchart comparing cyclical spike stocks against organic compounding businesses over a ten year horizon. subgraph Cyclical["Cyclical / Spike Pattern"] C1["Years 1 to 8: Flat / Zero Returns"] --> C2["Year 9 to 10: AI Hardware Repricing"] C2 --> C3["Massive Parabolic Burst (e.g., Micron, SanDisk)"] end subgraph Compounder["Organic Compounder Pattern"] K1["Consistent Revenue & Margin Growth"] --> K2["Gradual Multi-Year Price Appreciation"] K2 --> K3["Steady Decade Compounders (Costco, Mastercard)"] end ```

---

[14:47](https://www.youtube.com/watch?v=rTnKM_NzsKg&t=887s) The True Drivers of Long-Term Stock Returns

Short-term underperformance relative to sudden index spikes can feel frustrating, but historical data explains what actually drives total equity returns across varying horizons. A detailed breakdown of performance drivers—measuring revenue growth, profit margins, valuation multiples, and free cash flow—illustrates how the rules of investing change over time:

| Time Horizon | Valuation Multiple Impact | Revenue Growth Impact | Margin & Profit Impact | |:--- |:--- |:--- |:--- | | **1-Year** | 46% | ~25–30% | Minor component | | **3-Year** | 19% | Expanded role | Moderate component | | **10-Year** | 5% | 74% | 15% |

In any single one-year period, valuation multiples dominate nearly half of all returns; market performance is governed largely by what price multiple people are arbitrarily willing to pay. Widen the timeline to just three years, and the multiple's influence collapses from 46% to 19%. Over a full ten-year stretch, revenue growth dictates an overwhelming 74% of total performance, while the entry multiple accounts for a negligible 5%.

Evaluating the portfolio through this intrinsic lens yields an encouraging outlook: - **Trailing 12-Month Revenue Growth**: The S&P 500 grew revenue at an average 8.3%, while the focused portfolio compounded top-line sales 2.1 times faster. - **Forward 12-Month Projected Growth**: The S&P 500 is projected to grow top-line revenue at 11%, whereas the portfolio’s weighted forward growth stands at 15.8% (growing roughly 80% faster than the broader index).

Because revenue growth is the ultimate driver of decade-long wealth creation, lagging the market during a short-term multiple repricing is no reason to abandon ship: "I've decided to stay put with my strategy and hold through as long as these companies continue to grow."

---

[17:30](https://www.youtube.com/watch?v=rTnKM_NzsKg&t=1050s) Microsoft to Disclose Azure Revenue Directly

Moving into corporate earnings updates, Microsoft has announced a major shift toward operational transparency. Historically, Microsoft remained notoriously opaque regarding Azure’s financial specifics, cloaking cloud revenue inside its broader Intelligent Cloud umbrella and providing only percentage growth metrics rather than hard dollar figures.

Under the new reporting format, Microsoft will begin explicitly disclosing quarterly revenue for Azure. This provides analysts and retail investors with an unclouded view of how its core infrastructure business stacks up head-to-head against Amazon Web Services (AWS) and Google Cloud Platform (GCP).

[17:57](https://www.youtube.com/watch?v=rTnKM_NzsKg&t=1077s) Microsoft Revamps Reporting Segments to Break Out Azure

Microsoft revealed in a Wednesday presentation that it is restructuring its operating segments, cutting them down from three segments to two—overhauling a framework that has been in place since 2015. Under the historical setup, revenue was bundled into three buckets: Productivity and Business Processes, Intelligent Cloud, and More Personal Computing. The core frustration for analysts and investors has been that Azure was buried inside Intelligent Cloud alongside multiple other businesses, making it nearly impossible to evaluate what Azure alone was generating. After complaining about this opacity just a week prior, the shift to break Azure out into its own clearly visible metric comes as welcome news.

```mermaid flowchart TD accTitle: Microsoft Segment Reporting Transition accDescr: Diagram illustrating the shift from Microsoft's historical 3-segment reporting structure to its new structure with Azure broken out. subgraph Historical["Historical Structure (Since 2015)"] PBP["Productivity & Business Processes"] IC["Intelligent Cloud (Azure bundled inside)"] MPC["More Personal Computing"] end

subgraph NewStructure["New Reporting Structure"] SegA["Segment 1"] SegB["Segment 2"] AzureStand["Azure (Broken Out Directly)"] end

IC -->|"Unbundled"| AzureStand ```

Investors deserve direct visibility into Azure's exact numbers because Microsoft is no longer just a corporate cloud software provider—Azure represents a massive, core growth driver of the enterprise. Breaking it out transforms peer analysis. Previously on platforms like Qualtrim, users could easily stack Google Cloud directly against Amazon Web Services (AWS) in comparative bar charts to gauge size and growth rates, but comparing Microsoft required substituting Intelligent Cloud, which skewed the data. With standalone numbers, side-by-side growth tracking among the "Big Three" cloud hyperscalers becomes possible, giving the market the transparency it has long demanded while preserving historical Intelligent Cloud figures.

- **Historical Reporting Segments (2015–present):** Productivity and Business Processes, Intelligent Cloud, More Personal Computing. - **Reporting Overhaul:** Reduces operating segments from three to two while breaking out standalone Azure financials. - **Hyperscaler Comparability:** Enables direct, 1-to-1 visual and growth comparisons between Azure, AWS, and Google Cloud.

---

[19:45](https://www.youtube.com/watch?v=rTnKM_NzsKg&t=1185s) S&P Global Considers Spinning Out Capital IQ Pro

Bloomberg reported a rumor that S&P Global is evaluating a spinoff of its flagship data and research terminal, Capital IQ Pro, into an independent firm valued in the billions of dollars. While unconfirmed, the strategic rationale is strong. Capital IQ Pro functions primarily as a desktop application and user interface layer designed to display S&P Global's underlying financial datasets. Under a spin-off, S&P Global would retain its lucrative, proprietary Market Intelligence databases while divesting the desktop software wrapper itself.

To frame the strategy, S&P Global does not want to be Spotify fighting front-end platform wars; they want to be the music record labels owning the underlying master catalog. They have shown increasing indifference toward *how* end-users consume data—whether through terminals, ChatGPT, Claude, custom MCPs, or third-party plug-ins—so long as S&P Global monetizes the foundational data warehouse. Shedding Capital IQ Pro allows the firm to shed competitive UI software burdens and pivot toward a purer, higher-margin data and indices model, likely while retaining Capital IQ Pro as a massive recurring customer.

---

[21:52](https://www.youtube.com/watch?v=rTnKM_NzsKg&t=1312s) Google Narrowly Avoids Ad-Tech Breakup in Landmark Antitrust Ruling

Google secured a massive legal victory after a federal judge rejected the Department of Justice's bid to force a structural breakup of its advertising technology business. This marks the second time courts have denied government efforts to dismantle Alphabet, despite prior legal rulings finding that the company engaged in anticompetitive monopoly practices. The most catastrophic risk—being forced to spin off the Google Chrome browser—had already been sidestepped, and avoiding an ad-network divestiture effectively closes out nearly two decades of looming U.S. antitrust breakup anxiety.

The ruling deals a severe blow to the bipartisan antimonopoly movement that had gathered steam across Washington. While political pressure and DOJ scrutiny have intensified, the judiciary has remained skeptical of ordering structural corporate divestitures, viewing breakups as excessively radical remedies. For observers who anticipated Google being dismantled piece-by-piece and "sold at a garage sale," the judicial resistance ensures the business will remain intact for the foreseeable future.

---

[23:01](https://www.youtube.com/watch?v=rTnKM_NzsKg&t=1381s) Fail of the Week: White House Teleprompter Operator Busted on Kalshi

The segment wraps up with the "Fail of the Week," awarded to former White House teleprompter operator Gabriel Perez. The Commodity Futures Trading Commission (CFTC) ordered Perez to disgorge $107,000 in illicit trading gains alongside a $65,000 civil penalty. Prediction market platform Kalshi disclosed in July that Perez exploited his early access to unreleased presidential speech drafts to bet on specific keyword appearances—wager types centered on economic terminology and country mentions—netting roughly $100,000 ahead of Donald Trump's live remarks.

```mermaid flowchart LR accTitle: Teleprompter Operator Prediction Market Scheme accDescr: Visual flow showing how early speech draft access was monetized on Kalshi before being penalized by the CFTC. A["Early Presidential Speech Access"] --> B["Kalshi Bets on Specific Keywords"] B --> C["~$100,000 In Profits"] C --> D["CFTC Penalties: $107k Disgorgement + $65k Fine"] ```

When White House Press Secretary Karoline Leavitt notified Trump of the illicit trading, Trump labeled the operator's actions a "disgrace." While Perez indisputably engaged in deceitful cheating, the indignation is met with humor given the surrounding ecosystem—poking fun at the idea that premium traders can seemingly pay high fees for real-time access while front-running speeches via the teleprompter lands regular workers in regulatory crosshairs. Ultimately, the incident illustrates the broader cultural hazard of prediction markets converting routine speech and public events into speculative betting arenas.

- **Perpetrator:** Gabriel Perez (former White House teleprompter operator). - **Enforcement Body:** Commodity Futures Trading Commission (CFTC). - **Financial Penalties:** $107,000 disgorgement of unlawful gains plus a $65,000 civil monetary penalty. - **Mechanism:** Kalshi event contracts placed on specific presidential keywords and country names prior to delivery.

## Notable quotes > [00:00](https://www.youtube.com/watch?v=rTnKM_NzsKg&t=0s) something has gone terribly wrong — Joseph Carlson

> [02:02](https://www.youtube.com/watch?v=rTnKM_NzsKg&t=122s) it was tired of the past 4 years of winning and now it decided, I need to take a breather. — Joseph Carlson

> [09:13](https://www.youtube.com/watch?v=rTnKM_NzsKg&t=553s) in the right place at the right time. — Joseph Carlson

> [10:32](https://www.youtube.com/watch?v=rTnKM_NzsKg&t=632s) I'm not trying to make excuses. I own the performance of my portfolio. I don't blame anybody else. I'm not trying to blame the market for it being flat. That's on me. I picked to own these stocks. — Joseph Carlson

> [14:47](https://www.youtube.com/watch?v=rTnKM_NzsKg&t=887s) I've decided to stay put with my strategy and hold through as long as these companies continue to grow. — Joseph Carlson

> [21:52](https://www.youtube.com/watch?v=rTnKM_NzsKg&t=1312s) sold at a garage sale — Joseph Carlson

> [23:01](https://www.youtube.com/watch?v=rTnKM_NzsKg&t=1381s) disgrace — Donald Trump

## Mentioned Joseph Carlson, Qualtrim, Microsoft, Azure, S&P Global, Capital IQ, Capital IQ Pro, Google, Alphabet, Google Chrome, Donald Trump, Bill Ackman, United Microelectronics Corporation (UMC), Western Digital, Revolution Medicines (RVMD), Bloom Energy, Corcept Therapeutics, Micron Technology, Dell Technologies, Moderna, SanDisk, Seagate Technology, Costco, Texas Roadhouse, Visa, Mastercard, Amazon Web Services (AWS), Google Cloud Platform (GCP), Goldman Sachs, Bloomberg, Department of Justice (DOJ), Gabriel Perez, Commodity Futures Trading Commission (CFTC), Kalshi, Karoline Leavitt

## Video description Join Qualtrim, the stock analysis platform I built and use, and join over 13,000 other paying members: https://www.qualtrim.com/

00:00 What's Happneing In The Stock Market 17:31 Microsoft to Reveal Cloud Growth 19:45 S&P Global To Sell Capital IQ 21:52 Google Avoids Breakup 23:00 Fail Of The Week: Teleprompter Operator

-Disclaimer Some of the links below are affiliate links, I can earn money from them at no cost to you.

This content is not a solicitation, is not endorsed by M1, and was not reviewed by M1; the opinions expressed are solely those of the authors and do not reflect M1's views. Information presented is accurate as of the video posting date; for the most up-to-date information, please refer to m1.com. Before making any investment decisions, consult your personal investment, legal, and tax advisors, as this content is for informational purposes only and not intended as investment recommendations.

▀▀▀▀▀▀▀▀▀▀▀▀▀▀▀▀▀▀▀▀▀▀▀▀▀▀ Join Here: https://www.qualtrim.com/

📚 My favorite Investing Books: https://amzn.to/3KwyIhG 📷 All the tech I use to record videos: https://www.amazon.com/shop/josephcarlson/list/2L5YMP4DFYA8O?ref_=cm_sw_r_cp_ud_aipsflist_aipsfjosephcarlson_FAKKKMYKF486ZR6H2DSQ

🚀 Growth Portfolio: https://click.linksynergy.com/deeplink?id=5mNcifgFllM&mid=50362&murl=https://dashboard.m1.com/share?token=39d17ae6-4a4a-3fc4-bb15-d86abe3fbb67 💵 Dividend Portfolio: https://click.linksynergy.com/deeplink?id=5mNcifgFllM&mid=50362&murl=https://dashboard.m1.com/share?token=3b283352-1bff-31d9-8576-f5770c2bfdfd

SOCIAL MEDIA ▀▀▀▀▀▀▀▀▀▀▀▀▀▀▀▀▀▀▀▀▀▀▀▀▀▀ 🎥 More free content: https://www.youtube.com/channel/UCbta0n8i6Rljh0obO7HzG9A 🐦 I post random thoughts on Twitter too: https://twitter.com/joecarlsonshow

DISCLAIMER ▀▀▀▀▀▀▀▀▀▀▀▀▀▀▀▀▀▀▀▀▀▀▀▀▀▀ I am not a professional investor and have never claimed to be. I'm an amateur investor sharing my experience of what I've learned, where I have had success, and where I've had failures. I share my thoughts on investing and performance with transparency. My approach and goal to investing is to buy high-quality long-term investments in world-class businesses that I call "compounders". I view my investments as businesses, not as stocks. Before creating content on YouTube full time I worked as a senior-level programmer for 8 years. Over the years as a programmer, I compounded my knowledge of development. I take the same iterative learning approach to my study of investing. I study investing as a craft in the continual pursuit of being better. I will make mistakes in investment decisions from time to time. Results are not guaranteed. Please do not blindly follow me into any investments, and make sure your portfolio and investments are built around your specific income, risk tolerance, personality, timeline, and overall circumstances.

[Source](https://www.youtube.com/watch?v=rTnKM_NzsKg)

中文简报

AI硬件热潮驱动标普85%涨幅,其余市场陷入停滞 由于长期十年的股票回报中近四分之三由营收增长决定,而估值倍数变动的影响会逐渐减退,因此坚持投资于基本面复利型企业要优于追逐狭窄的周期性硬件涨势。 Joseph Carlson针对其投资组合年内迄今+1.3%的平淡回报与标普500指数+13.2%的涨幅进行了分析,探讨了为何在由AI硬件和部分生物科技股推动的极度集中的市场反弹中,平衡选股表现相对滞后。Carlson没有转向追逐那些在暴涨前停滞了十年的周期性赢家,而是解释了自己为何坚持持有能够实现稳定双位数营收增长的复利型企业。本期内容还涉及微软决定直接披露Azure营收、标普全球传闻分拆Capital IQ Pro、谷歌在法庭上避免了广告技术业务的结构性拆分,以及一名白宫提词器操作员因在Kalshi上进行内幕押注而受到美国商品期货交易委员会(CFTC)处罚。 股市的极度集中使得标普500指数严重依赖半导体和科技硬件这两个板块,两者贡献了该指数约85%的总体涨幅,而指数中40%的成分股则出现下跌。 (3:19) 微软宣布将其运营架构从三个业务部门调整为两个,并正式将Azure营收作为独立单项列出,以便与AWS和Google Cloud进行直接对比。 (17:30) 在一名称联邦法官驳回了美国司法部的剥离救济要求后,Alphabet避免了法院对其广告技术业务强制拆分的判决,使谷歌的核心资产得以保持完整。 (21:52) 标普全球正探讨以数十亿美元分拆其Capital IQ Pro终端软件,这反映出其正战略转向直接跨平台和AI系统授权底层金融数据目录。 (19:45)

Reading summary

Following four consecutive years of beating the benchmark, Joseph Carlson's portfolio sits up just 1.3% year-to-date in 2026 against a 13.2% surge in the S&P 500. He attributes this gap to extreme index concentration in cyclical AI hardware and niche biotechs, arguing that long-term returns remain anchored in sustained revenue growth rather than short-term multiple repricings. Narrow Concentration Masks Broad Market Stagnation (3:19) The dramatic spread between Carlson's portfolio (+1.3%, or roughly $17,000) and the S&P 500 (+13.2%) reflects historically thin market breadth rather than widespread economic expansion. Citing hedge fund manager Bill Ackman's mid-year shareholder report, Carlson highlights that just two out of 24 industry sectors—semiconductors and tech hardware and equipment—have generated approximately 85% of the S&P 500's total year-to-date gains. These two segments act as the primary hardware infrastructure providers for artificial intelligence. Outside of this narrow cluster, the broader market has stagnated. The bottom 90% of S&P 500 components have collectively contributed less than 2% of the index's net return, with 40% of member stocks trading in negative territory. Balanced institutional portfolios have faced similar headwinds; Goldman Sachs reported that hedge funds logged their worst monthly relative underperformance against the S&P 500 in over two decades in July due to maintaining diversified exposure across the rest of the market. Cyclical AI Surges Versus Steady Compounders (10:32) The equities leading the 2026 market advance are primarily cyclical hardware businesses and volatile biotechnology developers rather than consistent compounders. The S&P 500's top ten performers include SanDisk (up 457% to a $227 billion market capitalization), Dell Technologies (up 300% to $342 billion on AI server demand), Micron Technology (up 200% to a $1.07 trillion valuation), and Western Digital (up 135%), alongside clinical-stage pharmaceutical firms like Revolution Medicines and Moderna. Carlson emphasizes that nearly all of these top performers experienced eight to ten consecutive years of flat or negative returns before their sudden vertical ascents. Predicting these turnaround surges years in advance was improbable, and buying them after multi-hundred-percent gains carries significant repricing risk. This boom-and-bust trajectory contrasts with predictable compounders such as Costco, Texas Roadhouse, and Mastercard—which returned roughly 500% over the last decade excluding dividends through steady, linear operational expansion. Revenue Growth Outweighs Short-Term Multiple Expansion (14:47) To counter the temptation to chase momentum, Carlson examines historical drivers of equity performance across varying time horizons. Over a single year, valuation multiple fluctuations dictate roughly 46% of equity returns, making short-term performance heavily dependent on sentiment. Over a three-year horizon, the multiple's impact drops to 19%. Over a full ten-year holding period, revenue growth accounts for 74% of total equity performance, margins and profit contribute 15%, and entry valuation multiples account for just 5%. Evaluating fundamentals rather than share price fluctuations shows that Carlson's portfolio grew trailing twelve-month revenue 2.1 times faster than the S&P 500's 8.3% average. Looking ahead, the portfolio's weighted forward revenue is projected to expand by 15.8% compared to 11% for the index. Because top-line business growth governs long-term value creation, Carlson maintains that underperforming a benchmark during a short-term multiple expansion is not a valid reason to abandon a disciplined compounding strategy. Cloud Transparency, Corporate Spin-Offs, and Antitrust (17:30) Beyond market performance, several major corporate and regulatory developments emerged. Microsoft restructured its financial reporting from three operating segments down to two, directly breaking out quarterly Azure cloud revenue for the first time since 2015. This change allows investors to benchmark Azure directly against Amazon Web Services and Google Cloud Platform. In another corporate shift, Bloomberg reported that S&P Global is exploring a multi-billion-dollar spinoff of its Capital IQ Pro desktop platform, enabling the firm to shed front-end interface software while retaining its high-margin foundational market databases. On the legal front, Google avoided a forced structural breakup after a federal judge rejected the Department of Justice's attempt to dismantle its advertising technology business, ending significant uncertainty over a forced corporate separation. Separately, the Commodity Futures Trading Commission penalized former White House teleprompter operator Gabriel Perez, ordering $107,000 in disgorgement and a $65,000 fine for using advance access to presidential speech drafts to wager on keyword contracts on the prediction platform Kalshi. Carlson resolves to keep his portfolio strategy intact without chasing cyclical hardware winners, accepting short-term benchmark tracking error as long as his holdings maintain superior revenue and cash flow growth relative to the broader index.

Source quotes

[0:00] Joseph Carlson: something has gone terribly wrong [2:02] Joseph Carlson: it was tired of the past 4 years of winning and now it decided, I need to take a breather. [9:13] Joseph Carlson: in the right place at the right time. [10:32] Joseph Carlson: I'm not trying to make excuses. I own the performance of my portfolio. I don't blame anybody else. I'm not trying to blame the market for it being flat. That's on me. I picked to own these stocks. [14:47] Joseph Carlson: I've decided to stay put with my strategy and hold through as long as these companies continue to grow. [21:52] Joseph Carlson: sold at a garage sale [23:01] Donald Trump: disgrace

Original transcript

[0:00] Welcome everyone. It's seems as though [0:02] something has gone terribly wrong. When [0:04] I look at my portfolio and I switch over [0:06] to the year-to-date, my performance so [0:09] far is only plus 1.3%. [0:13] That's not a mistake. That is the actual [0:15] time-weighted return this year, or I've [0:18] only made $17,000. Now, I'm not losing [0:20] money per se, we're still making a [0:22] little bit of money, but this feels [0:24] pretty wrong when you compare it against [0:25] the S&P 500. Year-to-date, the S&P 500 [0:29] is up a staggering 13.2% [0:32] with my portfolio only up 1% and the [0:34] index up 13%. It looks like something's [0:37] gone wrong this year. So, we're going to [0:38] be looking over my portfolio and over [0:40] the S&P 500 index and try to figure out [0:43] what's going on. What's causing this big [0:45] discrepancy in performance this year? [0:48] We'll try to see if there's something [0:49] going on that's terribly wrong and if we [0:52] need to change strategies. So, this is [0:54] going to be an in-depth look in this [0:56] episode. Now, of course, we have a lot [0:57] of other news to get to. We have news [0:59] that Microsoft is becoming suddenly more [1:01] transparent with the reporting. They're [1:03] going to report Azure as a breakout [1:05] line, which is really really cool. We [1:07] have S&P Global rumored to be selling [1:09] off Capital IQ. As a big holder of S&P [1:12] Global, what does that mean? We have [1:13] Google avoiding a big breakup in their [1:15] company once again. Google's two for [1:17] two. And then we have the fail of the [1:18] week, which in this case is a [1:19] teleprompter operator for the White [1:22] House. Unfortunately, he got in a little [1:24] bit of trouble for betting on what Trump [1:26] would say in advance. So, we have a ton [1:28] to get to in this episode. Now, if you [1:29] like talking about stocks and seeing [1:31] in-depth research, you should try out [1:32] qualtrum.com. It's a community that I [1:34] built. It's an entire investment [1:36] analysis platform that I've [1:37] hand-tailored made. It's also a Discord [1:40] community and we have exclusive content [1:42] as well. For example, later this week, [1:44] I'm going to release an hour-plus long [1:46] portfolio update that goes over every [1:48] single position, every single update for [1:50] all of these companies, my buy prices, [1:53] my valuations for them, where I'd invest [1:55] my money today, and so on. That's going [1:57] to be later this week. So if you want to [1:58] try that out, you can do so at no risk. [2:00] It comes with a free trial. Now, let's [2:02] go ahead and jump in because when I look [2:04] at my portfolio, [2:06] I notice something here. [2:07] Overall, the portfolio has been doing [2:09] great. This has treated me really well [2:11] for the past 3 years. In fact, since [2:13] 2022, this portfolio has outperformed [2:16] the S&P 500 every single year. So it's [2:19] outperformed in 2022, it's outperformed [2:21] in 2023, outperformed in 2024, [2:24] outperformed in 2025. But then we get to [2:27] 2026 [2:29] and no longer is this portfolio [2:30] outperforming. In fact, we're we're up [2:32] currently 0.81% [2:34] year-to-date. My portfolio has been [2:36] sitting flat for basically all of 2026. [2:40] It's just been taking a rest. [2:42] It seems like it was tired of the past 4 [2:44] years of winning and now it decided, I [2:46] need to take a breather. And 2026 is the [2:49] the year that it decided to take a [2:50] breather. [2:51] Meanwhile, the S&P 500 is racing [2:53] upwards. It's up 12%. The QQQ is up even [2:56] more. So it's easy to conclude that in [2:58] 2026, looking at this portfolio be flat [3:01] for basically the entire year. We're in [3:03] September now, while the S&P 500 is [3:05] racing away, it's easy to look at this [3:08] and say, "Wow, something has gone [3:09] terribly wrong. I am making a mistake. [3:12] There there's something bad happening." [3:14] And I think it's important to observe [3:16] those type of thoughts and really look [3:17] at what's going on. The important [3:19] question I believe for investors is what [3:21] is causing this market to go up. Why is [3:23] the S&P 500 and the QQQ doing so well in [3:26] 2026? That could answer the question of [3:29] what's happening with my portfolio or [3:31] similar ones that aren't seeing much of [3:33] a upswing this year. And one of the best [3:35] explanations of what's driving this [3:37] market is a concentration of investors [3:39] into a specific sector. This is [3:41] something that Bill Ackman himself [3:42] highlighted in his most recent earnings [3:44] report. He outlines that the market's [3:46] gains this year have been driven by a [3:47] small subset of sectors. While the the [3:50] 500 index has approximately increased by [3:52] 10% through the first 6 months of the [3:54] year, nearly the entirety of the gains [3:57] has come from two sectors that provide [3:59] the picks and shovels for AI [4:01] infrastructure. Just two of the S&P [4:03] 500's 24 sectors. The S&P 500 has 24 [4:07] sectors. Two of them are causing all the [4:09] gains in 2026. Semiconductors and tech [4:12] hardware and equipment, just those two [4:14] sectors contributed nearly 85% of the [4:17] S&P 500's year-to-date gains. So, the [4:20] vast overwhelming majority of the gains [4:22] year-to-date, the reason that the [4:24] markets are moving up, are because of [4:25] semiconductors [4:27] and hardware and equipment. So, [4:29] basically semiconductor companies and [4:31] semiconductor-related or adjacent [4:33] companies. [4:34] That's 85% of the gains. Basically, [4:36] that's where all the gains are [4:37] happening. That's where all the magic is [4:39] happening. If you're in semiconductors, [4:41] you've had a great year. If not, well, [4:43] it's likely been a bit of a struggle. [4:45] It's been a lot more difficult. As a [4:46] result, more than 90% of the companies [4:49] in the S&P 500 have collectively [4:51] contributed less than 2% of the overall [4:54] return in the index. So, another way of [4:56] saying this is the breadth of the market [4:58] is incredibly slim. There's only a [5:00] couple companies really carrying this [5:02] market upwards, and the huge majority of [5:05] companies are doing nothing. In fact, to [5:06] put numbers behind this, right now the [5:08] S&P 500 is up around 10 to 12%. 40% of [5:11] the companies in the S&P 500 are in the [5:14] red year-to-date. So, 40% are in the [5:16] red, and 90% of the companies have done [5:20] almost nothing this year. Up only 2%. [5:23] Meaning that that 8 to 10% of companies [5:25] are doing all the lifting. It's the [5:27] whole reason the market's in the green. [5:29] Now, this is an unusually concentrated [5:31] market, even by historical terms. You [5:33] can compare this to past years where big [5:35] tech led or other companies did really [5:37] well, and there is a level of [5:39] concentration where only a few companies [5:41] are doing a lot of the lifting, but the [5:42] breadth of the market, the number of [5:44] companies that contribute is much larger [5:46] in historical terms. What we are seeing [5:48] today is a level of concentration that [5:50] we just have not seen before. This is a [5:52] highly specific concentrated market into [5:55] these picks and shovels companies. Now, [5:57] the outcome of this, of course, is that [5:58] it makes the job of a stock picker [6:00] incredibly difficult unless you're in [6:03] these companies specifically. For [6:04] example, Goldman Sachs recently just [6:06] said that hedge funds have suffered [6:08] their worst underperformance versus the [6:10] S&P 500 in July in more than 20 years. [6:14] Why are hedge funds suffering? Because [6:16] they don't own that sliver of stocks [6:18] that are doing the performance this [6:19] year. They own companies in the other [6:21] 90%. Another factor in making this year [6:24] especially difficult for the stock [6:26] picker is the type of companies that are [6:28] going up are in most cases highly [6:30] unpredictable gains. They're ones that [6:32] are very difficult to foresee. These [6:34] aren't companies that have continually [6:35] expanding business models. In a lot of [6:37] cases, these are very specific niche [6:39] companies that people didn't look at [6:41] before. For example, let's go ahead and [6:42] take a look at a list of the top 10 [6:44] performing stocks of this year. We'll [6:46] start with number 10. It's called UMC. [6:50] United Microelectronics Corporation. [6:53] It's the 10th highest performing stock [6:55] in the S&P 500. And if we look at the [6:57] performance, it's up 151% [7:00] year-to-date. Well, of course, UMC is a [7:02] pure play semiconductor foundry whose [7:04] economic engine is manufacturing [7:06] specialty mature mature node wafer and [7:09] power magnetic ICs, [7:11] microcontrollers, sensors, connectivity, [7:13] display, automotive and consumer chips. [7:16] These are the type of stocks that are [7:17] going nuts. We have Western Digital. You [7:20] know, the company that makes the hard [7:21] drive. You probably bought one or two of [7:23] them on Amazon. Yeah, you should have [7:24] known that this hard drive maker would [7:26] be the ninth best performing stock in [7:28] 2026. It's up a nice 135%. [7:31] In number eight, of course, we have [7:33] RVMD, Revolution Medicines, up a clean [7:36] 166% [7:38] in 2026. Now, what does this company [7:41] actually do? They're an oncology company [7:43] and they have a once daily oral, I'm not [7:45] even going to try to pronounce that, a [7:47] drug approved for metastatic pancreatic [7:50] endocrine something. How many investors [7:52] have I heard invest in this one? Well, [7:54] not a single one because unless you're a [7:56] specific pharmaceutical expert that is [7:58] also an oncologist, you likely have no [8:00] clue that this drug was going to be [8:01] successful or not. But hey, at least [8:03] that's one company that's not a [8:04] semiconductor stock. We have Bloom [8:06] Energy Corporation. This is number [8:08] seven. It actually changes a lot. So, it [8:10] was number seven just like a month ago. [8:11] Now, it's only up 171%. [8:14] What does Bloom Energy do? Well, the [8:15] company has installation and long-term [8:17] services of solid oxide fuel cell [8:20] systems. Then I believe we get to number [8:21] six here. This is Corcept Therapeutics [8:23] Incorporated. Unlikely that you're going [8:25] to have an expertise in this or have any [8:27] level of predictability in it. Now, we [8:28] get to more familiar names. These are [8:30] likely ones that you've heard of. We [8:31] have the fourth best performing stock in [8:33] the market, one that has heavily lifted [8:35] the entire industry. It's one of the [8:36] biggest companies in the world, which is [8:38] Micron Technologies. This is now a $1.07 [8:41] trillion market cap company. It's up [8:43] 200% year to date. Micron's numbers are [8:47] truly astonishing. They're numbers that [8:48] we've never seen before. The company [8:50] became one of the most profitable [8:51] companies seemingly overnight. We get to [8:53] the third best performing stock in the [8:54] S&P 500 this year and we have a Dell [8:57] Technologies. Now, I looked at Dell as [8:59] an old computer company. They sold the [9:01] really old desktop computers. I had an [9:04] old Dell when I was a kid. Big old [9:06] tower. It had like a floppy disk. That's [9:09] how I envision Dell. The old desktop [9:11] computer company. And here Dell is a [9:13] $342 billion market cap company. The [9:17] stock is up 300%. Now, I don't [9:19] personally see Dell desktop computers [9:21] that often anymore, but luckily the [9:22] company pivoted into a much more [9:24] lucrative Dell sells enterprise [9:26] infrastructure through its [9:27] infrastructure solutions group. [9:29] PowerEdge servers, AI factory systems, [9:32] networking. All of this is AI server [9:34] offerings. The second highest gainer [9:36] year to date in the S&P 500 is Moderna. [9:39] Of course, this is a behemoth that has a [9:41] lot of the immunizations, the vaccines. [9:43] They're constantly developing new ones. [9:45] And then finally, we get to number one. [9:46] The best performing stock in the S&P 500 [9:48] this year and we have SanDisk, another [9:50] memory company. It's now $227 billion. [9:54] It's up 457%. [9:56] SanDisk is another memory company. [9:58] Again, this is the type of thing where [10:00] you buy a little solid state drive on [10:02] Amazon. You probably view it as just a [10:04] consumer company. But SanDisk had the [10:06] right technology, the right [10:07] manufacturing, and they're in the right [10:09] place at the right time. And these are [10:11] the type of companies that are making [10:12] the big gains this year. So, out of [10:14] these 10 companies, we have three random [10:15] pharmaceutical companies that have had [10:17] massive breakthroughs. And then we have [10:19] seven companies that are in the [10:21] semiconductor industry. These are the [10:23] best performers in the market today. [10:25] They're the ones lifting the markets in [10:26] 2026. When I compare to my portfolio [10:28] again, that is just flat this year. [10:32] I'm not trying to make excuses. I own [10:34] the performance of my portfolio. I don't [10:36] blame anybody else. I'm not trying to [10:37] blame the market for it being flat. [10:39] That's on me. I picked to own these [10:41] stocks. [10:42] But I do believe it's good to give [10:43] explanation of why a portfolio like this [10:46] is flat and all these companies are [10:48] going up like crazy. It's important to [10:50] put this all in context because this can [10:52] be very tricky for investors. When you [10:54] look at companies like this that are up [10:56] so much year to date, I think the best [10:58] exercise is just to zoom out 10 years [11:00] and look for any type of anomaly. This [11:02] stock is one that has been flat for 5 [11:04] plus years. It had a big bump in 2020, [11:07] then it gave up a lot of the returns. [11:08] And then for about 5 years, this company [11:10] just remained flat and then it had a [11:12] sudden bursting gains, practically all [11:15] the gains in just the past year. We look [11:18] at Western Digital Corporation and you [11:20] see a very similar trend. We zoom out 10 [11:21] years and this company has been [11:23] literally flat for 9 years straight [11:26] until we get into late 2025 and then [11:28] 2026 where it had its epic boom. [11:30] Revolution Medicine shows a very similar [11:32] type of story. You zoom out to 10 years, [11:34] completely flat for 10 years, and then [11:36] all of a sudden gains in the past year [11:37] and a half. Seagate technology, we look [11:39] at the exact same type of thing. Zoom [11:41] out to 10 years, completely flat for an [11:43] entire decade until the past year and a [11:45] half. This energy company, we zoom out [11:47] and we see the exact same thing. It has [11:49] been bouncing around the same price for [11:51] 9 years except for the past year and a [11:53] half. Corcept Therapeutics, this is [11:55] another one. We look past 10 years, we [11:57] see that it is basically flat for 8 and [11:59] a half years, had a bump, then another [12:01] downfall, then another big bump. Micron [12:03] technology, and it's literally flat for [12:05] 8 and a half of the years. It made no [12:08] gains until the past year and a half [12:10] alone. Now, to Dell's credit, it did [12:11] make some gains leading up and to 2026. [12:14] So, at least there was some progress. It [12:15] wasn't completely flat. With Moderna, [12:17] this one is all over the place. It did [12:19] have a big jump year-to-date. We zoom [12:21] out to 10 years, and it actually it was [12:23] up a lot higher, it went back down, and [12:25] then it had a sudden spike. It is [12:26] entirely unpredictable what this stock [12:28] is going to do. We look at SanDisk, and [12:29] this one's a little bit misleading [12:31] because we zoom out to 10 years, and [12:33] this one actually starts in 2025. So, [12:35] this one very similarly had no gains. It [12:38] wasn't really a big company at all until [12:40] just 2025 to 2026. So, we notice a trend [12:43] looking at these companies that are [12:45] doing really well this year. They are [12:47] very unpredictable. They're companies [12:48] that for the better part of a decade did [12:50] nothing. Investors had to just sit there [12:52] and hope the situation would change. You [12:55] compare this to other companies. For [12:56] example, I look at Costco over the past [12:58] 10 years. My first buy of Costco was in [13:00] 2017. So, my first buy was about $160, [13:04] give or take. [13:05] And this stock does not have 8 years of [13:08] no gains and then a sudden burst of [13:09] gains in a year and a half. It's far [13:11] more gradual. We can look at Texas [13:13] Roadhouse. This is another one that you [13:15] can see it's a gradual growth. It gets [13:17] to new highs over time. It's not [13:19] perfectly linear. No stock is going to [13:21] trade in a straight line, but this one [13:22] shows a more organic growth over the [13:24] past decade. We look over the past 10 [13:26] years at MasterCard. Both Visa and [13:28] MasterCard are examples of companies [13:30] that grow at a very consistent basis and [13:32] even their stock price grows at the same [13:34] pace. Over the past 10 years, the gains [13:36] have been incredible. It's been up 500% [13:39] not counting dividends. And we look at [13:40] this and it's a very linear growth from [13:42] MasterCard. Again, every stock is going [13:44] to have some level of dips, but what we [13:46] don't see is 10 years of being flat and [13:49] then suddenly a spike up a year and a [13:51] half ago. So, it's starting to make [13:52] sense of why this small subset of [13:54] companies are doing so well this year [13:56] and why so many people have missed these [13:57] type of stocks. It's really difficult to [13:59] pick a stock that's going to do well [14:01] that hasn't done well for 8 years or 10 [14:04] years. That's just difficult to do. Most [14:06] people aren't going to predict that [14:08] Micron or that SanDisk will be the stock [14:10] to buy 3 years ago. And if you missed [14:13] it, they've already been repriced. [14:15] Meanwhile, these type of companies, [14:16] these ones that are growing organically [14:18] every single day, they're growing more [14:20] and more every single year on a [14:21] consistent basis, they're simply not [14:23] being rewarded today. There's no capital [14:25] chasing these companies. So, while we [14:27] sit year-to-date being mostly flat, we [14:29] have the market going up. Now, you may [14:31] say that's discouraging because you want [14:33] to outperform every single year and you [14:35] may think that you need to own the index [14:36] so you can get any type of random stock [14:38] that does well. But I don't think that [14:40] that's necessarily the case. I don't [14:41] think investors should be discouraged if [14:43] they're underperforming those type of [14:45] companies this year. Because we can look [14:48] at what drives long-term stock [14:49] outperformance. This chart here, I [14:52] believe, illustrates it better than most [14:54] charts. It shows on the one year, the [14:56] three year, the five and 10 year, what [14:59] factors in a company led to total [15:00] outperformance. So, we have light blue, [15:03] that's the revenue growth. We have [15:05] green, which is the margins of the [15:06] company. We have yellow, which is the [15:09] multiple it trades at, so the valuation [15:11] of it, and then we have blue, which is [15:12] the free cash flow. These are all what's [15:14] the breakdown of the stock's returns [15:16] over time. [15:17] And you'll notice that in the one year, [15:20] you can see what makes up the biggest [15:21] difference. It is the multiple. This [15:24] yellow part makes up 46% of your [15:26] returns. So basically in the short term, [15:28] in a one-year time frame, multiple's [15:30] everything. The price people are willing [15:32] to pay. Revenue plays a part, all the [15:34] other stuff plays a part, but around 50% [15:36] of it is simply the multiple. But you'll [15:38] notice when we only go three years out. [15:40] So when we just widen the timeline a [15:41] little bit, the multiple goes from 46% [15:44] down to 19% of an impact of the overall [15:46] returns. At a 10-year time period, the [15:49] revenue growth determines 74% of the [15:51] total return of a company you invest in. [15:54] It is by far the dominant factor in [15:56] whether or not you're going to have good [15:57] returns. Now profits make up a a pretty [15:59] big chunk as well, 15%. The multiple you [16:02] paid, 5%. [16:05] Barely a factor after a decade. So [16:06] there's a couple takeaways from this. In [16:08] the short term, the multiples that [16:09] companies trade at are the most [16:11] important, but the long-term performance [16:13] is going to be driven by revenue growth. [16:15] So even though my stocks are flat this [16:17] year, I like to look at what they're [16:19] doing intrinsically, and especially how [16:21] fast the revenue's growing. And this is [16:23] where I believe things are really [16:24] encouraging. I ran analysis that looks [16:26] at the overall weighted revenue growth [16:27] in my portfolio over the trailing 12 [16:29] months and the projected revenue growth [16:31] over the next 12 months. And I compare [16:33] that against the S&P 500. [16:35] The S&P 500's revenue growth over the [16:37] trailing 12 months is 8.3%. [16:40] That's good. It's a a nice year for the [16:43] S&P 500, it's about average. In the [16:44] trailing 12 months, my portfolio has [16:46] grown about 2.1 times faster than the [16:49] S&P 500 in revenue growth. [16:51] And on a forward growth outlook, it's [16:54] going to grow 15.8% [16:56] compared to the S&P 500's 11%. [16:59] So when I look overall at what's going [17:01] on behind the scenes, how my companies [17:03] are actually performing, the most [17:04] important factor that my portfolio's [17:06] long-term outperformance, which will be [17:08] the overall revenue growth, is actually [17:10] going along quite nicely. It's growing [17:12] two times as fast as the S&P 500 and [17:15] projected to grow dramatically faster, [17:16] about 80% faster next year. So, even [17:19] after looking at this terrible situation [17:22] that we have ourselves in, this flat [17:24] year-to-date, I've decided to stay put [17:26] with my strategy and hold through as [17:28] long as these companies continue to [17:29] grow. Now, moving on, we get to some [17:30] important news here. Specifically, that [17:32] Microsoft is now deciding to be a little [17:34] bit more transparent. Before, Microsoft [17:36] was very sneaky. They're very opaque. [17:39] They would not tell us how much money [17:41] Azure is really making. But, with this [17:43] report, it looks like they're changing [17:44] their mind. It says here that Microsoft [17:46] will start disclosing quarterly revenue [17:47] for its Azure cloud business for the [17:49] first time, providing investors with a [17:51] clearer picture of its business that [17:52] competes with Amazon's web service or [17:55] Google's cloud platform. The change, [17:57] announced in a presentation on [17:58] Wednesday, is part of a broader shift in [18:00] Microsoft's reporting structure as the [18:02] company trims its operating segments [18:04] from three to two. The prior structure [18:06] has been in place since 2015. Now, if we [18:08] look at the prior structure, or what [18:10] exists today, this is what it looks [18:12] like. We have the revenue by segment. [18:14] This is a KPI guy that we keep track of, [18:16] and it's broken into these three [18:17] different segments: business, [18:19] productivity and business process, [18:20] intelligent cloud, and personal [18:21] computing. Azure is hidden inside of [18:24] intelligent cloud, and it's jumbled in [18:26] with a bunch of other businesses. So, [18:28] you really have no clue what Azure [18:30] itself is actually doing. And that has [18:32] been the complaint for a while. I was [18:34] just complaining about this a week ago, [18:35] and here we are getting news that [18:37] Microsoft is like, "All right, we'll fix [18:39] it. We'll become more transparent. We'll [18:40] break out Azure specifically." And this [18:43] is great, and it's great for a couple [18:44] different reasons. First of all, [18:46] investors deserve to know what Azure is [18:48] doing specifically. Microsoft is no [18:50] longer just a corporate cloud software [18:51] company. Azure is a massive part of [18:54] Microsoft. Investors should know how [18:56] much revenue Azure is making. That [18:58] should be a very basic thing to break [19:00] out. Another thing is that when we look [19:02] at the reporting and we try to run [19:03] analysis, for example, if I try to do a [19:06] stacked bar chart, which we can do in [19:08] Qualtrics, I could stack Google Cloud [19:11] against AWS, and I could see those [19:12] stacked bars against each other and see [19:14] kind of which one's bigger than which [19:15] and I can directly compare them. [19:17] But with Microsoft I can't because I can [19:19] only stack up intelligent cloud which [19:21] really isn't Azure. And this will make [19:23] it much easier to compare these three [19:24] different business lines together of [19:26] Azure, Google Cloud, and AWS. We'll be [19:28] able to make these stacked bar charts [19:30] and growth rates and direct comparisons [19:32] that will help out investors. So [19:34] overall, I'm in complete favor of this. [19:36] I'm glad they're doing it. The way that [19:38] this is going to be reported is in cloud [19:39] computing will have the historical data [19:41] stay put, but then we'll break this off [19:43] into two segments as they do the new [19:45] reporting. Now, the next bit of news we [19:46] got is a rumor. It's from Bloomberg. [19:49] They say that S&P Global is considering [19:51] spinning out its flagship data and [19:53] research platform Capital IQ Pro. And a [19:56] move that could create a standalone firm [19:58] worth billions of dollars. Now, nothing [19:59] is for certain here, but this would be a [20:01] big move for S&P Global and I think one [20:03] that's actually warranted. For example, [20:05] if we look at what Capital IQ Pro [20:07] actually is, it is a desktop application [20:10] that is primarily a user interface to [20:12] interact with all the data from S&P [20:14] Global. S&P Global would keep the data, [20:17] all of their proprietary data, and [20:19] they'd sell off this desktop application [20:21] and the user interface. [20:23] A way of looking at it is S&P Global [20:25] doesn't want to be Spotify. They want to [20:27] be the music labels. They want to be the [20:29] ones that own the actual data. They [20:31] don't really care about the user [20:33] interface or how people look at the data [20:36] or consume the data. They're not really [20:38] invested in fighting with other user [20:40] interfaces. Capital IQ Pro does have a [20:43] little bit of data that it harvests [20:45] itself and that it contains itself [20:46] that's proprietary, but the huge [20:48] majority of data from Capital IQ Pro [20:50] comes from S&P Global. [20:52] So S&P Global would keep its market [20:54] intel business, it would keep its [20:56] proprietary data, but it would just get [20:58] rid of this interface. And I believe [21:00] that this makes sense and it's [21:01] consistent with S&P Global's past moves. [21:04] S&P Global has been making it [21:05] increasingly clear that they want to be [21:07] agnostic to user interfaces. They simply [21:10] want to be a data and indices company. [21:12] S&P Global would prefer to house and [21:14] monetize a huge warehouse of data, of [21:16] which you can find that data in any way [21:18] that you want. You can use ChatGPT, you [21:21] can use Claude, you can use any type of [21:23] plug-in you want, MCPs, you can use [21:25] interfaces, or you can use Capital IQ. [21:28] They don't care which way you access [21:30] their data as long as you're using their [21:32] data. S&P Global is moving towards a [21:35] higher margin data business that I [21:37] believe is less competitive than overall [21:39] the battle between all the user [21:40] interfaces that they have to sell to the [21:42] end user. And even if they were to spin [21:44] off Capital IQ, S&P Global would likely [21:46] remain a massive client of Capital IQ. [21:49] So overall, I think this is a good move [21:51] and it makes sense with their strategy. [21:52] Next up, we got some good news if you're [21:54] a Google investor. They just avoided a [21:55] big breakup of their ad business. A [21:57] federal judge rejected the request from [21:59] the Department of Justice to break up [22:01] their advertising business. The second [22:03] time the court has denied government [22:05] efforts to break up this company after [22:07] it was found liable for engaging in [22:09] illegal monopoly tactics. So Google is [22:11] found to be a big bad monopoly, but they [22:13] didn't have to break off Chrome. That [22:15] was the major win. If Google had to [22:16] break off Chrome, that would have been [22:18] really bad. So they avoided that. Then [22:20] there was a decision of whether or not [22:21] they had to break up a segment of their [22:23] advertising business. This decision is a [22:25] historical marker that effectively [22:27] closes the book on a nearly two decade [22:29] US antitrust risk for Google. This is [22:32] also another severe blow to the [22:34] anti-monopoly political movement that [22:36] has been embraced by both parties and [22:38] has grown over the past few years. Even [22:40] with all this political incentive, even [22:42] with the Department of Justice going [22:43] after them, judges, however, have proved [22:46] deeply resistant to splitting up the [22:48] companies, believing that the remedy is [22:50] too drastic. So the people hoping for a [22:52] downfall in Google, that the company [22:54] will be broken up, split into pieces, [22:56] and sold at a garage sale, well, they're [22:58] going to be very disappointed because [22:59] it's not happening anytime soon. Now [23:01] moving on, we get to the fail of the [23:02] week, which in this case is the [23:03] teleprompter operator that worked for [23:06] the White House. The Commodity Futures [23:07] Trading Commissioners said the operator, [23:09] Gabriel Perez, must pay back $107,000 he [23:12] made from unlawful trading, plus a civil [23:15] penalty of 65,000. [23:17] The prediction market company, Kalshi, [23:19] disclosed in July that Mr. Perez had [23:21] used his positions to win around [23:22] $100,000 [23:24] by placing bets about what Mr. Trump [23:27] would say in his speeches. Mr. Perez had [23:29] access to presidential speeches before [23:31] they were delivered. He then placed [23:33] wagers on common words that would appear [23:35] in the remarks, such as a country name [23:38] or economic terms, the company said. [23:40] After the allegations became public, [23:42] Karoline Leavitt, the White House press [23:44] secretary, said that she had talked to [23:46] Mr. Trump about the reports that his [23:47] teleprompter operator had been making [23:49] money off of his speeches on prediction [23:50] markets, and that he called it a [23:52] disgrace. Okay, come on. [23:55] He He made some money on the side. And [23:57] sure, what this teleprompter operator [23:59] did it was deceiving. He was betting [24:01] ahead of the market. He knew what he did [24:03] He knew what he did was cheating, right? [24:04] So, what What he did was wrong, but we [24:07] have Trump here saying it's a disgrace. [24:08] It's a disgrace, folks. [24:10] At the same time, Trump is charging [24:12] $100,000 to access an API for his [24:15] advanced words. [24:17] So, it seems as though if you have the [24:18] money to pay Trump, then you then you [24:20] can benefit from advanced words. [24:23] But if you're one of the poor folks that [24:24] can't afford that $100,000 per month API [24:27] to get Trump's advanced words, then [24:29] you're out of luck. No betting in [24:31] advance for you. [24:33] And overall, this once again just [24:34] highlights the problem with prediction [24:35] markets. Turning every single thing into [24:37] a gamble is not good for society. We're [24:39] going to see more and more of this over [24:41] time. [24:42] That's it for this episode. Hope you [24:43] enjoyed. See you in the next one.