How to Know if a Stock is Cheap or Expensive? Part 2 of 2
Adam Khoo
AI-assisted summary of How to Know if a Stock is Cheap or Expensive? Part 2 of 2 — original source. Check the original for full context.
Source published:
Key ideas
- The 20-year Discounted Free Cash Flow (DCF) model serves as the primary valuation benchmark for roughly 90% of predictable cash-generating businesses, though temporary capital expenditure spikes—such as big tech's heavy AI investments—should be normalized using a trailing 5-year average. (4:37)
- Applying cash flow discounting models to cyclical companies like Micron creates severe distortions and absurd valuations due to peak-cycle growth assumptions; cyclical firms must instead be evaluated using normalized historical multiples such as mean P/E or P/S. (14:36)
- Because customer float, lending activities, and operational deposits distort operating cash flows in financial institutions, non-bank financials like UnitedHealth require a Discounted Net Income (DNI) framework, while commercial banks rely on historical Price-to-Book multiples. (19:55)
- A genuine fundamental margin of safety must be verified by technical analysis before entering a trade; waiting for share prices to hit established support zones prevents investors from catching falling knives in temporarily cheap stocks. (22:31)
Detailed notes
## Background Published on YouTube by professional investor and educator Adam Khoo on August 21, 2026, this video serves as part two of a guide on evaluating stock prices. According to the description, Khoo outlines a practical framework for calculating intrinsic value, buying with a margin of safety, and avoiding the common mistake of confusing nominal share price with actual business value.
## TL;DR Khoo demonstrates that intrinsic value is an evolving range based on cash flow predictability rather than a single fixed number. He details eight core valuation models, spotlighting the 20-year Discounted Free Cash Flow (DCF) framework for steady businesses like Mastercard, while warning that cyclical companies like Micron and financial firms like UnitedHealth require specialized alternatives such as multiples or Discounted Net Income. Ultimately, he stresses that securing an undervalued business creates a margin of safety, but optimal entry timing requires pairing fundamental valuation with technical support levels.
## Atmosphere & style The presentation carries the brisk, authoritative, and pragmatic cadence of an interactive masterclass. Khoo moves smoothly between financial formulas and analytical software dashboards, punctuating the instructional breakdown with dry humor when pointing out absurd mathematical distortions in cyclical stocks. Watching the session feels practical and demystifying, equipping retail investors with institutional-style rigor while warning them against algorithmic blind spots.
## Bulletin - [04:37](https://www.youtube.com/watch?v=3DcW4KanvTM&t=277s) The 20-year Discounted Free Cash Flow (DCF) model serves as the primary valuation benchmark for roughly 90% of predictable cash-generating businesses, though temporary capital expenditure spikes—such as big tech's heavy AI investments—should be normalized using a trailing 5-year average. - [14:36](https://www.youtube.com/watch?v=3DcW4KanvTM&t=876s) Applying cash flow discounting models to cyclical companies like Micron creates severe distortions and absurd valuations due to peak-cycle growth assumptions; cyclical firms must instead be evaluated using normalized historical multiples such as mean P/E or P/S. - [19:55](https://www.youtube.com/watch?v=3DcW4KanvTM&t=1195s) Because customer float, lending activities, and operational deposits distort operating cash flows in financial institutions, non-bank financials like UnitedHealth require a Discounted Net Income (DNI) framework, while commercial banks rely on historical Price-to-Book multiples. - [22:31](https://www.youtube.com/watch?v=3DcW4KanvTM&t=1351s) A genuine fundamental margin of safety must be verified by technical analysis before entering a trade; waiting for share prices to hit established support zones prevents investors from catching falling knives in temporarily cheap stocks.
## Key takeaways - [00:00](https://www.youtube.com/watch?v=3DcW4KanvTM&t=0s) A stock represents fractional business ownership, and its intrinsic value equals all projected future cash flows discounted back to the present day divided by outstanding shares. - [02:24](https://www.youtube.com/watch?v=3DcW4KanvTM&t=144s) Intrinsic value should never be treated as an exact pinpoint figure, but rather as an evolving range consisting of base, optimistic, and conservative pessimistic scenarios. - [02:24](https://www.youtube.com/watch?v=3DcW4KanvTM&t=144s) Businesses with consistent historical earnings yield tight, dependable valuation ranges, whereas unpredictable companies produce wide, volatile fair-value spreads. - [04:37](https://www.youtube.com/watch?v=3DcW4KanvTM&t=277s) The 20-year Discounted Free Cash Flow (DCF) model is the standard workhorse for common equities, provided the company has demonstrated a consistent record of growing free cash flow. - [06:27](https://www.youtube.com/watch?v=3DcW4KanvTM&t=387s) Temporary surges in capital expenditures, such as infrastructure buildouts for AI data centers, can be smoothed using a 5-year normalized average to avoid understating underlying free cash flow. - [10:53](https://www.youtube.com/watch?v=3DcW4KanvTM&t=653s) Consensus growth estimates often require conservative algorithmic or manual haircuts across intermediate forecast years to stress-test valuations against analyst over-optimism. - [14:36](https://www.youtube.com/watch?v=3DcW4KanvTM&t=876s) Blindly plugging peak-cycle growth projections into DCF models for cyclical companies produces nonsensical intrinsic values, such as Micron modeling out to $317,000 per share. - [14:36](https://www.youtube.com/watch?v=3DcW4KanvTM&t=876s) Cyclical businesses are better analyzed using historical mean valuation multiples, though their broad uncertainty ranges often make them better candidates for short-term swing trading than long-term holding. - [19:55](https://www.youtube.com/watch?v=3DcW4KanvTM&t=1195s) Insurance and non-bank financial firms must be valued using Discounted Net Income (DNI) rather than DCF, because balance sheet float and operational reserves obscure operating cash flow. - [19:55](https://www.youtube.com/watch?v=3DcW4KanvTM&t=1195s) Commercial banking institutions require a 5-year mean price-to-book (P/B) ratio multiplied by current book value per share rather than earnings or cash flow discounting models. - [19:55](https://www.youtube.com/watch?v=3DcW4KanvTM&t=1195s) An optimal margin of safety is established when a high-quality company's market price trades below even the most conservative lower boundary of its calculated valuation range. - [22:31](https://www.youtube.com/watch?v=3DcW4KanvTM&t=1351s) Fundamental valuation alone is incomplete without technical timing; combining a strong margin of safety with price confirmation at key technical support levels optimizes entry points.
## Detailed walkthrough ### [00:00](https://www.youtube.com/watch?v=3DcW4KanvTM&t=0s) Introduction and Recap: What Is Intrinsic Value?
The primary objective of stock valuation is to establish whether a company is currently underpriced or overpriced relative to its fundamental business performance, giving investors the confidence to buy low and only sell when a stock becomes excessively overvalued. Buying fundamentally sound companies below what they are worth creates a vital "margin of safety," whereas selling at premium levels above business value secures optimal gains.
```mermaid flowchart LR accTitle: Cash Flow to Intrinsic Value Flowchart accDescr: Shows the progression from a business generating future cash flows to discounting them to present value and dividing by share count to get intrinsic value per share. subgraph Engine["Business Engine"] A["Operating Business"] --> B["Future Cash Flows / Profits"] end subgraph Valuation["Discounting & Share Price"] B --> C["Discount to Present Value<br/>(Time Value of Money)"] C --> D["Total Enterprise Value"] D --> E["Divide by Share Count =<br/>Intrinsic Value Per Share"] end ```
Every share of stock represents fractional ownership of an operating business. Because a business functions fundamentally as a "money-making machine," its value is directly proportional to its ability to generate profits and cash flow over time: - The intrinsic value of any business equals the sum total of all future cash flows discounted back to the present day due to the time value of money. - Dividing this discounted figure by the total number of outstanding shares yields the intrinsic value per share. - Because future cash flows cannot be known with absolute certainty, all valuation calculations rely on forward estimates and growth projections rather than guaranteed figures.
---
[02:24](https://www.youtube.com/watch?v=3DcW4KanvTM&t=144s) The Four Keys: Predictability and Valuation Ranges
Valuing equities requires recognizing that not all companies offer the same degree of predictability. Companies with clean histories of steady earnings yield dependable intrinsic value calculations, whereas companies with erratic track records produce volatile, unreliable estimates.
```mermaid flowchart TD accTitle: Predictability and Valuation Range Comparison accDescr: Contrasts consistent companies with narrow valuation ranges against inconsistent companies with wide ranges. subgraph Consistent["Predictable Businesses (e.g., Mastercard)"] A1["Smooth Historical Profits & Cash Flow"] --> B1["Reliable Future Growth Assumptions"] B1 --> C1["Narrow Intrinsic Value Range"] end subgraph Inconsistent["Unpredictable Businesses (e.g., SpaceX)"] A2["Erratic Historical Results (Up & Down)"] --> B2["Highly Uncertain Future Estimates"] B2 --> C2["Wide Intrinsic Value Range"] end ```
Valuation should never be viewed as an exact pinpoint number, but rather as an evolving spectrum: - **Base Case:** The baseline expectation derived from consensus growth forecasts. - **Optimistic (Bull) Case:** Built on higher growth expectations. - **Pessimistic (Bear) Case:** Anchored in conservative, slower growth rates. - **Margin of Safety Target:** Entering below the base case—or ideally below the pessimistic bear case—ensures downside protection against operational missteps. - **Range Differences:** Highly erratic businesses (such as SpaceX) carry massive fair-value spreads, potentially ranging from $50 on the pessimistic side up to $160 or $200 on the optimistic side. Conversely, predictable businesses like Mastercard exhibit very narrow, tight valuation ranges.
---
[04:37](https://www.youtube.com/watch?v=3DcW4KanvTM&t=277s) The 8 Core Valuation Models and the 20-Year DCF Approach
While numerous models exist across Wall Street, eight primary valuation techniques form the practical foundation for evaluating common stocks: 1. Mean Price-to-Earnings (P/E) Ratio 2. PEG Ratio (Price/Earnings to Growth) 3. Mean Price-to-Book (P/B) Ratio 4. Mean Price-to-Sales (P/S) Ratio 5. Price-to-Sales Growth (PSG) Ratio 6. Discounted Free Cash Flow (DCF) Method 7. Discounted Cash from Operations Method 8. Discounted Net Income Method
Among these eight frameworks, the discounted free cash flow (DCF) model is the definitive workhorse, utilized roughly "90% of the time." The core setup assumes the business operates and produces cash flow for a defined 20-year horizon before expiring; any operational cash generation beyond that 20-year window is treated as an unmodeled bonus. Future annual free cash flows across these two decades are calculated and discounted back to present value using a suitable discount rate. However, the fundamental prerequisite for using this method is a demonstrated track record of consistently growing free cash flow.
---
[06:27](https://www.youtube.com/watch?v=3DcW4KanvTM&t=387s) Practical Application: Valuing Mastercard and Normalizing CapEx
Evaluating Mastercard (ticker symbol MA) illustrates how the 20-year DCF framework operates in practice using analytical platforms such as Stock Oracle. Mastercard carries a 5-year projected growth rate of 15.65% and a long-term growth projection of 17%. These growth inputs originate from FactSet, aggregating consensus estimates from hundreds of equity analysts. While investors can use these institutional figures directly, conservative practitioners often haircut them significantly (for example, slashing a 15% projection in half to 7.5%) to run stringent personal stress tests.
A visual examination of Mastercard's financials confirms sustained, year-over-year gains in free cash flow, meeting the DCF model's strict consistency requirements:
$$\text{Free Cash Flow (FCF)} = \text{Operating Cash Flow} - \text{Capital Expenditures (CapEx)}$$
- **The CapEx Distortion Problem:** Tech giants such as Amazon, Meta, and Microsoft routinely produce reliable operating cash flows, but their recent massive capital expenditure cycles (such as building AI data centers) have temporarily depressed reported free cash flow. - **Normalizing CapEx:** A temporary spike in capital spending does not invalidate the DCF method. When operating cash flow remains strong, capital expenditure can be "normalized" by taking a trailing 5-year average to smooth out cyclical capital spending spikes. - **Mastercard Valuation Outcome:** Running the 20-year discounted free cash flow model on Mastercard's consistent financial profile yields an intrinsic value of approximately $719 per share.
[10:53](https://www.youtube.com/watch?v=3DcW4KanvTM&t=653s) Mastercard and the Oracle Value AI Adjustment
To understand how the valuation engine functions under the hood, Khoo navigates through the platform's intrinsic value calculation section, selecting the discounted free cash flow (DCF) method for Mastercard. The automated breakdown calculates an intrinsic value of $719 per share. This baseline model relies on consensus FactSet growth projections: business cash flows expanding at 15% annually for the first five years, accelerating slightly to 17% from year 6 to year 10, and tapering to a 4% terminal growth rate for the final decade.
```mermaid flowchart TD accTitle: Intrinsic Value Workflow by Business Type accDescr: Decision logic showing how business predictability dictates the appropriate valuation method.
Start["Analyze Business Model & Cash Flows"] --> Choice{"Cash Flow Profile"}
subgraph Predictable["Predictable & Compounding"] Choice -->|"Steady Cash Generation"| FCF["Discounted Free Cash Flow (DCF)<br>e.g., Mastercard ($719 vs $561 Oracle)"] end
subgraph Cyclical["Cyclical / Commodity"] Choice -->|"Volatile Boom-and-Bust"| Mult["Historical Multiples<br>• Mean 5-Yr P/E without NRI<br>• Mean P/S Growth<br>e.g., Micron ($556 - $1,016)"] end
subgraph Financials["Financial Institutions"] Choice -->|"Insurance / Asset Mgmt / Credit"| DNI["Discounted Net Income (DNI)<br>e.g., UnitedHealth ($529 vs $446)"] Choice -->|"Commercial Banks"| PB["Mean Price-to-Book (5-Yr Avg P/B)"] end ```
Khoo addresses a frequent point of confusion for users of Stock Oracle: why does the platform's proprietary "Oracle Value" report $561 when the raw DCF equation outputs $719? He explains that while the algorithm automatically selects discounted free cash flow as the optimal methodology for a cash generator like Mastercard, it applies an algorithmic conservatism filter. The AI evaluates FactSet's forward consensus, and whenever it detects excessive optimism, it cuts the forward growth rates downward. In Mastercard's case, the AI dampens the growth forecast for years 6 through 10 down to roughly 9.5%, which recalculates the valuation down to approximately $559 or $560.
Investors are not bound to algorithmic conclusions; the model allows users to adjust inputs to reflect their own convictions. If an investor considers the AI overly pessimistic and projects a 12% intermediate growth rate, plugging that figure in outputs an intrinsic value of $607 per share. As Khoo reiterates, intrinsic value is never a fixed, absolute number—it is always a derivative of forward-looking projections. Investors can stress-test a business across optimistic best-case scenarios, conservative worst-case scenarios, and a middle base case.
- **Mastercard Free Cash Flow Model Inputs:** 15% growth for years 1–5, 17% growth for years 6–10, and a 4% terminal growth rate yield an unadjusted intrinsic value of $719. - **Oracle Value Conservative Adjustment:** Trims intermediate growth estimates from 17% to roughly 9.5%, pulling the valuation down to $561. - **Custom User Scenario:** Modeling an intermediate 12% growth rate yields a fair value of $607.
---
[14:36](https://www.youtube.com/watch?v=3DcW4KanvTM&t=876s) The Trap of Cyclical Stocks: Valuing Micron (MU)
Valuation approaches must pivot dramatically when analyzing cyclical companies such as semiconductor memory manufacturer Micron Technology (ticker: MU). Khoo demonstrates why relying blindly on the discounted free cash flow method—his personal favorite—fails when applied to cyclical businesses. Examining Micron's historical financial charts reveals severe volatility: operating cash flow swings violently up and down across cycles, while free cash flow alternates erratically between positive surges, deep negative plunges, and flat stretches.
Because free cash flow lacks historical stability, predicting what Micron will generate over a 5-, 10-, or 15-year horizon is fundamentally impossible. Optimists assume current cyclical peaks will continue indefinitely, while pessimists anticipate an inevitable downcycle once supply catches up. Khoo snorts in disbelief while demonstrating what happens if an investor blindly feeds consensus analyst estimates into a DCF model for Micron: because FactSet projections assume 99% annual growth over the next five years and 148% long-term growth, the DCF calculator outputs an absurd intrinsic value of $317,000 per share.
To evaluate cyclical businesses sensibly, investors must discard cash flow discounting and apply normalized valuation multiples, such as the mean price-to-earnings (P/E) or mean price-to-sales (P/S) ratios:
| Valuation Approach | Metric / Model Applied | Resulting Valuation | Context / Implication | |:--- |:--- |:--- |:--- | | **Consensus DCF** | Consensus estimates (99% 5-yr, 148% long-run) | **~$317,000** | Absurd result caused by unadjusted cyclical peak estimates. | | **Conservative Multiples (Oracle Value)** | 5-Year Mean P/E (excluding non-recurring income) multiplied by current EPS | **~$556** | Assumes profits will contract once memory chip supply eases. | | **Growth Multiple Method** | Price-to-Sales Growth Ratio Method | **~$1,016** | Assumes the company has permanently broken free of memory cyclicality. |
This dynamic creates a wide valuation range spanning $500 to $1,000. If Micron is worth $1,000, it is deeply undervalued at current market prices; if it is worth $500, it is heavily overvalued. Because of this massive uncertainty, Khoo personally avoids owning cyclical stocks as long-term investments, preferring instead to trade their price swings via short-term options strategies where long-range fundamental valuation is secondary.
---
[19:55](https://www.youtube.com/watch?v=3DcW4KanvTM&t=1195s) Valuing Financials and Insurance: UnitedHealth Group (UNH)
Valuation techniques must also adjust for financial entities, including insurance providers, asset managers, credit card issuers, and banking institutions. Discounted free cash flow models fail for financial firms because the movement of customer float, lending balances, and operational deposits distorts reported operational cash flows. While banks must be evaluated using a 5-year mean price-to-book (P/B) ratio multiplied by current book value per share, non-bank financials such as American Express or managed care conglomerates require a discounted net income (DNI) model.
To illustrate, Khoo examines healthcare and insurance giant UnitedHealth Group (ticker: UNH). FactSet consensus models UNH growing at 15.96% annually over the next five years, followed by 13.67% long-term growth. Projecting net profits over a 20-year horizon and discounting those flows back to present value produces a baseline intrinsic value of $529 per share under the discounted net income method.
By contrast, the conservative AI-driven Oracle Value assigns UnitedHealth a valuation of $446 by shaving percentage points off FactSet's forward growth trajectory. However, Khoo highlights that in real-world investing, arguing over whether UNH is worth $446 or $529 is largely irrelevant because the stock trades around $384 at the time of analysis. When a high-quality company trades at a clear discount to even the most conservative boundary of its valuation range, it offers an undeniable margin of safety.
- **Methodology Rule of Thumb:** Use discounted net income for asset managers, insurance companies, and select consumer finance firms; use mean price-to-book for commercial banks. - **UnitedHealth Growth Estimates:** 15.96% for the initial 5-year period; 13.67% long-term normalized growth. - **UnitedHealth Valuation Comparison:** Discounted Net Income yields $529, Oracle Value yields $446, and current market price sits comfortably below both at $384.
[22:31](https://www.youtube.com/watch?v=3DcW4KanvTM&t=1351s) Combining Margin of Safety with Technical Analysis
When a share price trades significantly below multiple valuation models and falls beneath the calculated valuation range, it creates a true margin of safety. This represents the ideal window to purchase shares, provided that the underlying business is fundamentally sound. Valuation metrics alone are insufficient; you must first verify that you are dealing with a high-quality company before even considering the price tag.
However, fundamental analysis and intrinsic value calculations represent only part of the equation. Technical analysis and chart patterns play an equally critical role before executing any entry. Rather than buying blindly as a stock collapses—where an ostensibly "cheap" stock can easily become much cheaper in the short run—it is crucial to wait until the price waves down to a clear, strong support level with a demonstrated probability of rebounding. Merging solid fundamentals with precise technical timing is the specific combination that allows an investor to beat the broader market consistently.
```mermaid flowchart LR accTitle: Combined Investment Decision Framework accDescr: Flowchart illustrating Adam Khoo's process of evaluating quality, valuation, and technical timing before entering a stock. subgraph Quality["1. Business Assessment"] Q["High-Quality Company Check"] end subgraph Valuation["2. Intrinsic Value & Safety"] V["Valuation Range Analysis"] --> M["Margin of Safety Established"] end subgraph Timing["3. Technical Execution"] T["Wave Down to Strong Support"] --> E["Optimal Entry Point"] end Q --> V M --> T ```
- **Fundamental Prerequisite**: A low valuation only matters if the underlying business has durable competitive advantages and strong economics. - **Multiple Valuation Confirmation**: Confidence increases when the market price sits below the outputs of several distinct valuation models. - **Support-Level Confirmation**: Technical analysis prevents catching falling knives by requiring price stabilization at verified support zones before capital is deployed.
[23:23](https://www.youtube.com/watch?v=3DcW4KanvTM&t=1403s) Mastering Valuation and Resources for Investors
While tools like Stock Oracle streamline the process of screening and identifying stocks that are sufficiently cheap to buy, mastering every underlying valuation methodology requires comprehensive study. Deep dives into these quantitative and qualitative methods are explored across multi-hour training programs, such as the Whale Investor course and the Wealth Academy Investor Masterclass. There are currently numerous compelling opportunities in the market where great, high-caliber businesses are trading at deeply discounted levels.
Investors looking to sharpen their skills across investing and trading can explore specialized courses through Piranha Profits to learn how to generate consistent income across global financial markets, or attend live online training via the Wealth Academy Global live seminars. As Adam Khoo frequently reminds his community before signing off: "May the markets be with you."
- **Resources & Platforms**: - Educational courses and tools available at PiranhaProfits.com (including trading and value momentum systems). - Interactive live seminars hosted via WealthAcademyGlobal.com. - Software screening and intrinsic value estimation powered by tools like Stock Oracle.
## Notable quotes > [00:00](https://www.youtube.com/watch?v=3DcW4KanvTM&t=0s) The intrinsic value of any business equals the sum total of all future cash flows discounted back to the present day due to the time value of money. — Adam Khoo
> [00:00](https://www.youtube.com/watch?v=3DcW4KanvTM&t=0s) Because future cash flows cannot be known with absolute certainty, all valuation calculations rely on forward estimates and growth projections rather than guaranteed figures. — Adam Khoo
> [02:24](https://www.youtube.com/watch?v=3DcW4KanvTM&t=144s) Valuation should never be viewed as an exact pinpoint number, but rather as an evolving spectrum — Adam Khoo
> [04:37](https://www.youtube.com/watch?v=3DcW4KanvTM&t=277s) Among these eight frameworks, the discounted free cash flow (DCF) model is the definitive workhorse, utilized roughly "90% of the time." — Adam Khoo
> [06:27](https://www.youtube.com/watch?v=3DcW4KanvTM&t=387s) A temporary spike in capital spending does not invalidate the DCF method. When operating cash flow remains strong, capital expenditure can be "normalized" by taking a trailing 5-year average to smooth out cyclical capital spending spikes. — Adam Khoo
> [10:53](https://www.youtube.com/watch?v=3DcW4KanvTM&t=653s) As Khoo reiterates, intrinsic value is never a fixed, absolute number—it is always a derivative of forward-looking projections. — Adam Khoo
> [14:36](https://www.youtube.com/watch?v=3DcW4KanvTM&t=876s) Because free cash flow lacks historical stability, predicting what Micron will generate over a 5-, 10-, or 15-year horizon is fundamentally impossible. — Adam Khoo
> [19:55](https://www.youtube.com/watch?v=3DcW4KanvTM&t=1195s) When a high-quality company trades at a clear discount to even the most conservative boundary of its valuation range, it offers an undeniable margin of safety. — Adam Khoo
> [22:31](https://www.youtube.com/watch?v=3DcW4KanvTM&t=1351s) Rather than buying blindly as a stock collapses—where an ostensibly "cheap" stock can easily become much cheaper in the short run—it is crucial to wait until the price waves down to a clear, strong support level with a demonstrated probability of rebounding. — Adam Khoo
> [23:23](https://www.youtube.com/watch?v=3DcW4KanvTM&t=1403s) May the markets be with you. — Adam Khoo
## Mentioned Adam Khoo, Mastercard, SpaceX, Amazon, Meta, Microsoft, Micron Technology, UnitedHealth Group, American Express, Stock Oracle, FactSet, Piranha Profits, Wealth Academy, Whale Investor, Wealth Academy Investor Masterclass
## Video description Part 2 of 2. Watch Part 1 first!
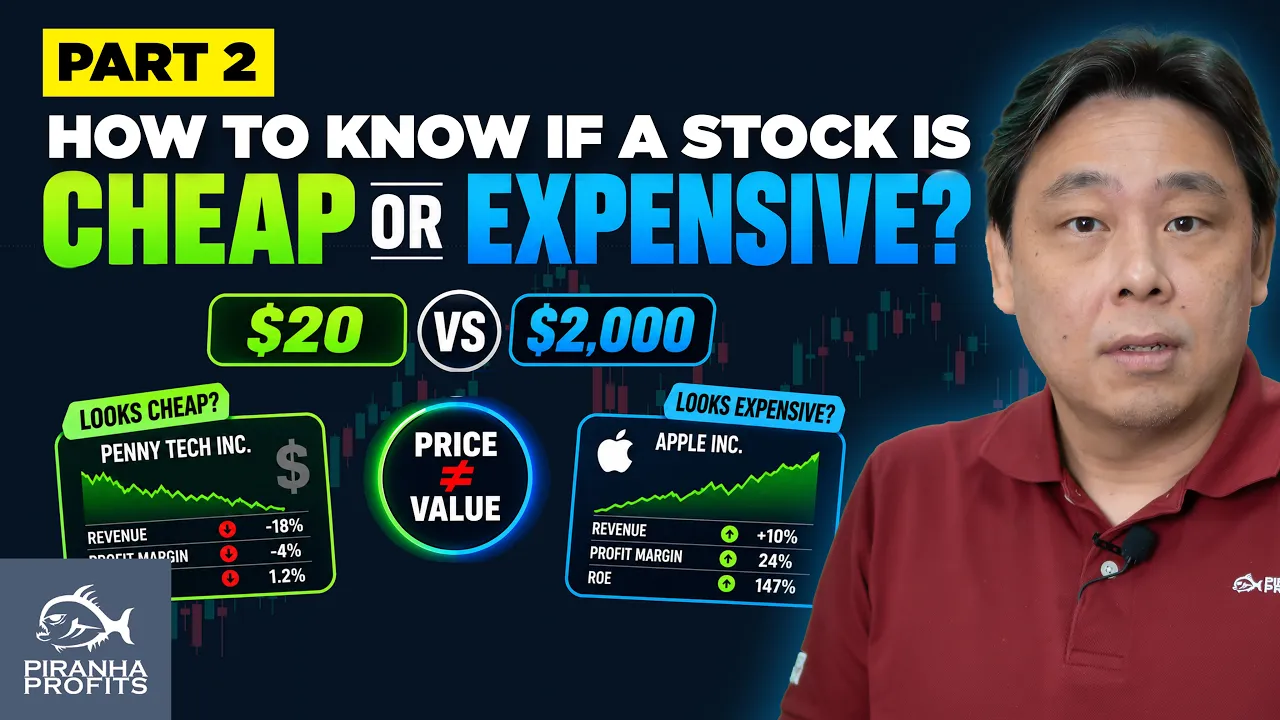
Is a $20 stock actually cheap? Is a $2,000 stock expensive? The single biggest mistake investors make is confusing share price with actual business value.
A great company can turn into a terrible investment if you overpay, while a high-dollar stock can be an absolute steal if it trades below its fair value.
In this video, I break down the exact framework I use for determining the intrinsic value of a stock, buying with a margin of safety, and protecting your portfolio from valuation traps.
What You Will Learn: 1) Price vs. Value: Why nominal share prices mean nothing without business context. 2) Quality Over Cheapness: Why buying a great business at a fair price beats buying a bad business at a discount. 3) Valuation is a Range: How to handle cash flow uncertainty and why you shouldn't try to value every stock on the market. 4) Margin of Safety: How to build a buffer for error before making any investment.
======================== Stock Investing & Trading insights by Adam Khoo will show you profitable trading and investment opportunities in today's stock markets.
These are essential strategies for stock traders and investors who want to improve their investment and trading performance.
Adam Khoo is a professional stock investor and options trader and the best-selling author of 16 books including 'Winning the Game of Stocks" and "Profit from the Panic". Thousands of students have profited from his sharp investment insights into the world of stock market investing and trading. ===================== Sign up for our courses/mentorship programs 📗 Value Momentum Investing: http://bit.ly/4mqrEVP 📙 Options Waverider™: http://bit.ly/4c5xyrR 📘 Price Action Manipulation™ (Trading): http://bit.ly/48FUAmQ 📕 Income Investing™ (Dividends): http://bit.ly/3Ow8CRj
Grab our Playbook Subscriptions Ultimate Investors Playbook™: http://bit.ly/3QiN6zT Options Tactics Playbook™: http://bit.ly/4tCQFPL PAM™ Trader Playbook: http://bit.ly/4mmYnv0 ===================== 💻 Join Our Wealth Academy Live Seminars https://www.wealthacademyglobal.com ===================== 🧑🏫 Visit Adam Khoo Learning Technologies Group https://www.akltg.com ===================== Follow Me On Social Media 🌟 Facebook: https://facebook.com/adamkhoosuccess 🌟 Instagram: https://www.instagram.com/adamkhoosuccess/ ===================== Follow Piranha Profits On Social Media 🐟 Facebook: https://www.facebook.com/piranhaprofits 🐟 Instagram: https://www.instagram.com/piranhaprofits 🐟 Telegram: https://t.me/piranhaprofits 🐟 Discord: https://discord.gg/piranhaprofits ===================== 👉 If you've found this video helpful, please LIKE, SHARE, & COMMENT 👉 SUBSCRIBE to my Channel for more Market Analyses & Investing Strategies 👉 Click on the NOTIFICATION BELL to get notified whenever I upload a new video ===================== 💸 MAY THE MARKETS BE WITH YOU! 💸
[Source](https://www.youtube.com/watch?v=3DcW4KanvTM)