Emory’s Williams Finds Smart Home Tech Accelerates Net Emissions
Stanford Online
Surging hardware density in domestic sensing creates a low-carbon paradox that increases grid strain while burdening households with operational fragility and misleading data.
The low-carbon innovation paradox shows that expanding computing density from one personal desktop to 50–100 built-environment IoT nodes risks increasing net emissions and grid strain, undermining the core purpose of smart sustainability tech. (0:10)
A domestic field study indicates homeowners actively resist smart replacements for quiet analog items, prioritizing reliable workflows and sentimental artifacts over IoT devices that introduce computational maintenance and operational fragility. (5:38)
An evaluation of nine air quality visualizations revealed an accuracy trade-off: static displays yielded the most accurate interpretations of AQI categories, while interactive scrubber tools doubled user success when comparing sensor reliability. (32:28)
The UBench platform supports circular fabrication by projecting computer vision defect segmentation directly onto reclaimed timber and using 3D-tracked inductive and capacitive pens to diagnose embedded metal and rot. (21:19)
Detailed notes
## Background
Published on YouTube by Stanford Online on October 22, 2026, this recording of the Stanford CS547 HCI Seminar features Dr. Kristin Williams from Emory University's Embodied Interaction Lab. According to the page description, the presentation investigates sensing uncertainty, examining how user interfaces shape epistemic positions when sensors misreport events and why sustainable HCI must embrace uncertainty as a primary research question.
## TL;DR
Dr. Kristin Williams examines the low-carbon innovation paradox, showing how proliferated IoT hardware stresses resources while introducing operational fragility and domestic resistance against automating cherished analog routines. Drawing on material circularity, she presents UBench, an augmented workbench that uses computer vision and instrumented sensing pens to scaffold novice fabrication with unpredictable, reclaimed timber. Williams also reviews an empirical evaluation of low-cost air quality visualizations, demonstrating that while static displays best support absolute AQI reading accuracy, interactive designs significantly improve users' grasp of sensor reliability and drift. She concludes by urging interaction designers to treat sensor uncertainty not as an error to conceal, but as an epistemic reality requiring collective, tangible interaction paradigms.
## Atmosphere & style
The presentation carries the measured, intellectually rigorous tone of a graduate research colloquium, seamlessly bridging qualitative ethnographic observations with quantitative visualization benchmarks. Williams delivers her findings with grounded clarity and understated warmth, displaying deep empathy for both the messy domestic workflows of study participants and the tactile knowledge of craftspeople. As the talk moves into audience questions, the atmosphere becomes an engaging, collaborative exploration of real-world friction, addressing everything from kriging artifacts in air quality data to the physical and occupational hazards of e-waste recycling.
## Bulletin
- [00:10](https://www.youtube.com/watch?v=jT6aYMQ0Lqw&t=10s) The low-carbon innovation paradox shows that expanding computing density from one personal desktop to 50–100 built-environment IoT nodes risks increasing net emissions and grid strain, undermining the core purpose of smart sustainability tech.
- [05:38](https://www.youtube.com/watch?v=jT6aYMQ0Lqw&t=338s) A domestic field study indicates homeowners actively resist smart replacements for quiet analog items, prioritizing reliable workflows and sentimental artifacts over IoT devices that introduce computational maintenance and operational fragility.
- [32:28](https://www.youtube.com/watch?v=jT6aYMQ0Lqw&t=1948s) An evaluation of nine air quality visualizations revealed an accuracy trade-off: static displays yielded the most accurate interpretations of AQI categories, while interactive scrubber tools doubled user success when comparing sensor reliability.
- [21:19](https://www.youtube.com/watch?v=jT6aYMQ0Lqw&t=1279s) The UBench platform supports circular fabrication by projecting computer vision defect segmentation directly onto reclaimed timber and using 3D-tracked inductive and capacitive pens to diagnose embedded metal and rot.
## Key takeaways
- [00:10](https://www.youtube.com/watch?v=jT6aYMQ0Lqw&t=10s) The low-carbon innovation paradox demonstrates that hardware proliferation—growing from single personal machines to dozens of ambient IoT devices—counteracts emissions reductions.
- [00:10](https://www.youtube.com/watch?v=jT6aYMQ0Lqw&t=10s) Sensing uncertainty requires designers and users to treat sensor data as ranges of possibilities rather than ground truth, as hardware frequently reports misleading readings.
- [05:38](https://www.youtube.com/watch?v=jT6aYMQ0Lqw&t=338s) Domestic fieldwork reveals that families refuse to smartify reliable analog items to avoid introducing operational fragility and continuous computational chores into essential routines.
- [10:38](https://www.youtube.com/watch?v=jT6aYMQ0Lqw&t=638s) Analog domestic artifacts build deep emotional attachment through material provenance, wear, and physical history, which digital upgrades frequently disrupt.
- [15:06](https://www.youtube.com/watch?v=jT6aYMQ0Lqw&t=906s) Standard digital fabrication CAD tools fail when applied to circular reclaimed materials because they assume raw materials are uniform, pristine, and dimensionally true.
- [17:34](https://www.youtube.com/watch?v=jT6aYMQ0Lqw&t=1054s) The UBench system enables in situ defect negotiation by projecting flaw boundaries, cut lines, and classification panels directly onto irregular reclaimed timber.
- [21:19](https://www.youtube.com/watch?v=jT6aYMQ0Lqw&t=1279s) Specialized handheld sensing pens track submerged metallic fasteners inductively and moisture variations capacitively, preventing shop accidents and tool damage.
- [26:43](https://www.youtube.com/watch?v=jT6aYMQ0Lqw&t=1603s) Low-cost air quality sensors inherently suffer from drift over time due to surface contaminant accumulation, humidity changes, and uncalibrated field deployments.
- [32:28](https://www.youtube.com/watch?v=jT6aYMQ0Lqw&t=1948s) Static visualizations supported the most accurate readings of specific air quality categories, while interactive modes were over two times more effective for evaluating sensor reliability.
- [32:28](https://www.youtube.com/watch?v=jT6aYMQ0Lqw&t=1948s) Spatial Kriging maps halved participant accuracy compared to temporal plots or single-sensor gauges by smoothing localized readings across neighboring areas.
- [39:22](https://www.youtube.com/watch?v=jT6aYMQ0Lqw&t=2362s) Only 4% of participants reported low confidence in evaluating air quality data despite frequent errors and an inverse correlation between self-reported numeracy and task accuracy.
- [41:37](https://www.youtube.com/watch?v=jT6aYMQ0Lqw&t=2497s) User interfaces act as epistemic mechanisms that actively structure what users consider knowable and what interpretations they generate from sensor streams.
- [46:10](https://www.youtube.com/watch?v=jT6aYMQ0Lqw&t=2770s) Physical artifacts function as boundary objects in domestic environments, helping families negotiate technology modifications concretely rather than through abstract promises.
- [50:50](https://www.youtube.com/watch?v=jT6aYMQ0Lqw&t=3050s) Households are primarily receptive to augmenting objects when the intervention directly resolves chronic, dysfunctional domestic routines rather than offering generic automation.
- [56:32](https://www.youtube.com/watch?v=jT6aYMQ0Lqw&t=3392s) Achieving true hardware circularity requires modular architectures with mechanical fasteners that facilitate disassembly, preventing the severe occupational hazards linked to manual e-waste reclamation.
## Detailed walkthrough
### [00:10](https://www.youtube.com/watch?v=jT6aYMQ0Lqw&t=10s) The Low-Carbon Innovation Paradox and Sensing Uncertainty
Williams frames her presentation around open questions rather than settled conclusions, using ideas from her recent article on sensing uncertainty in sustainable human-computer interaction (HCI), published in the September/October issue of *interactions* magazine. She reflects on how society accumulates electronic waste, referencing striking fieldwork photos from Syed Ishtiaque Ahmed’s lab at the University of Toronto showing e-waste workers laboring amid discarded electronics. Although sustainability has been an active topic for at least 25 years, its slow burn has reached an urgent breaking point: global greenhouse gas emissions have not been curbed to prevent the planet from exceeding the 2.5-degree warming threshold identified by climate scientists, and e-waste generation continues to soar. Concurrently, data center expansions driven by the rapid growth of AI are putting extraordinary stress on municipal energy and water grids, pushing computer scientists to rethink sustainable computing from within.
```mermaid
flowchart TD
accTitle: Low-Carbon Innovation Paradox
accDescr: Diagram illustrating how deploying IoT to cut energy usage counterintuitively increases emissions through device proliferation and data infrastructure.
subgraph Goal["Intended Sustainability Goal"]
A["Deploy Edge IoT Sensors"] --> B["Collect Energy Consumption Data"]
B --> C["Analyze Trends to Lower Emissions"]
end
subgraph Reality["The Innovation Paradox"]
A --> D["Device Ratio Jumps (50-100 per person)"]
D --> E["Manufacturing & Networking Overhead"]
E --> F["Data Storage & Intensive Computation"]
F --> G["Net Increase in Carbon Emissions"]
end
```
Attempts to solve these challenges frequently run straight into the "low-carbon innovation paradox." The very technologies meant to lower emissions often end up exacerbating them. For example, placing Internet of Things (IoT) edge sensors at consumption points can track power usage and guide better decisions. However, shifting from desktop computing (roughly one device per person) to mobile computing and wearables raised device ownership to five or ten per person. Pushing IoT into the built environment pushes that figure to 50 or 100 devices per person. The manufacturing, networking, storage, and computationally heavy analysis required for these fleets can dwarf the energy savings achieved. Rather than abandoning these technologies, Williams argues that researchers need a new mode of thinking that openly accommodates uncertainty.
Sustainable computing literature often examines uncertainty through the lens of long-term rebound effects—where efficiency gains lower costs and ultimately drive aggregate consumption up. Williams sets that long-term debate aside to focus on an immediate, overlooked problem: *sensing uncertainty*. Sensors frequently produce misleading data, meaning decision-makers cannot assume a sensor reading represents ground truth; instead, the true value sits somewhere within a range of possibilities. As Williams explains:
> “So, when I talk about sensing uncertainty, I'm talking about does this sensor actually report on an event as it occurred? Or really, do we need to think about this data as being misleading and need to approximate or understand how to cope with the fact that it might re the real value might lie within a range of possibilities.”
- The talk draws from research featured in the September/October issue of ACM *interactions* magazine.
- Fieldwork images of e-waste recycling originated from Syed Ishtiaque Ahmed’s group at the University of Toronto.
- Climate targets aim to stop planetary warming from crossing the 2.5°C threshold.
- Per-capita device density has climbed from 1 (desktop) to 5–10 (mobile/wearables), with IoT projections reaching 50 to 100 devices per individual.
---
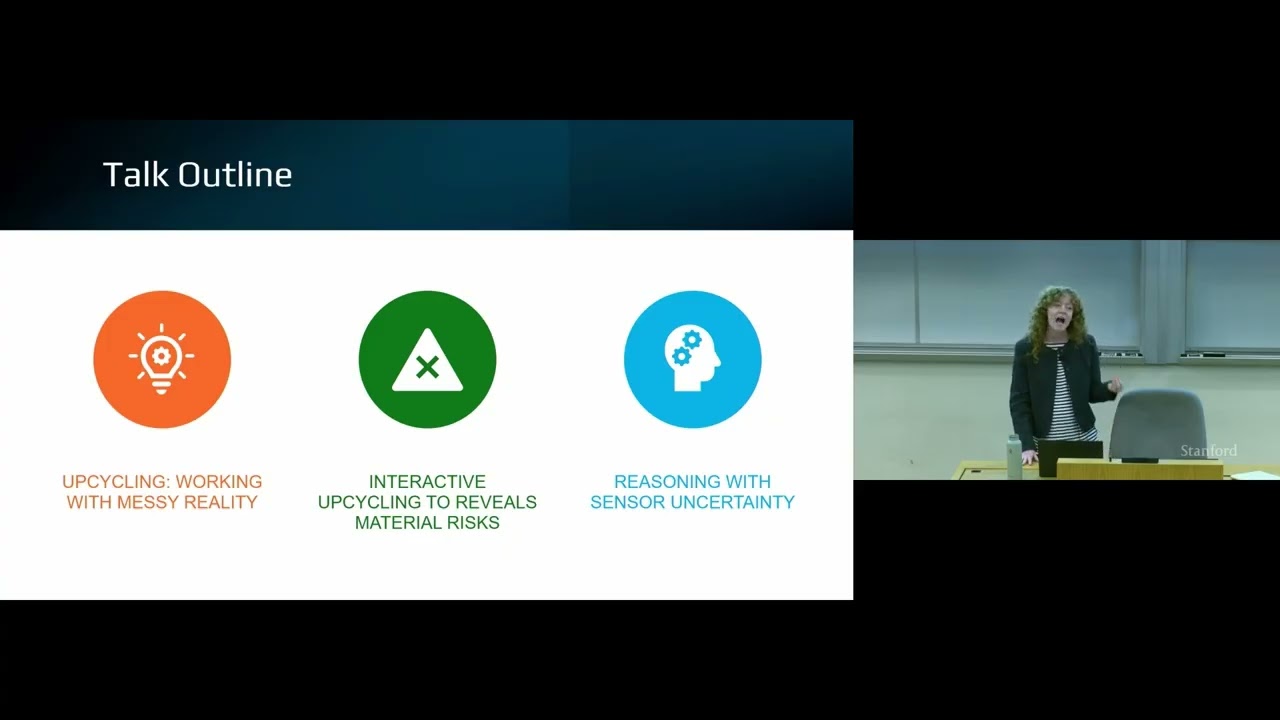
[05:38](https://www.youtube.com/watch?v=jT6aYMQ0Lqw&t=338s) Investigating Upcycling and Domestic IoT Fragility
Williams outlines the trajectory of her lab's work across the computing stack, starting with her dissertation research on upcycling. While investigating ways to graft lightweight IoT capabilities onto ordinary objects rather than throwing them away, she confronted the question of whether modifying an existing artifact truly benefits the user. In contrast to *upcycling*—where a transformed artifact gains more utility and value than it originally had—ill-conceived modifications result in *downcycling*, leaving the object degraded, less useful, and more prone to obsolescence.
```mermaid
flowchart LR
accTitle: Upcycling vs Downcycling Transformation
accDescr: Flow showing the divergent outcomes when modifying household artifacts with embedded computing.
A["Everyday Domestic Artifact"] --> B{"Add Computational Layer"}
B -->|"Adds Utility & Meaning"| C["Upcycling: Greater Value"]
B -->|"Introduces Fragility & Maintenance"| D["Downcycling: Less Value / Discarded"]
```
Mainstream smart home deployments push homeowners to displace reliable items (swapping basic LED bulbs for smart bulbs or legacy sound systems for smart speakers), requiring installation assistance from specialized contractors. Studies repeatedly show that homeowners struggle to attach meaning to these smart replacements and feel significantly less connected to them than to their non-digital counterparts. To see whether IoT could instead integrate into existing possessions without erasing their history, Williams and her team conducted an in-home study with 10 families in the Pittsburgh area, spending 7 to 10 hours collecting data per household over the course of a week.
During home tours, participants were asked to choose five rooms, identifying three items per room they wished to augment with computing and three they insisted on leaving untouched. The findings highlighted a clear division: families had zero desire to modify items that simply worked without intervention. They valued these quiet, reliable objects because they kept the home functioning without drawing attention to themselves. Conversely, participants feared that embedding IoT would make their homes brittle, requiring constant upkeep and tying essential domestic routines to external corporate ecosystems that could change or fail at any moment. As Williams summarizes their perspective:
> “In contrast, owners worried that adding IoT risked the idea of introducing fragility into their home by automating home routines and introducing computational management.”
- The field study investigated 10 households in Pittsburgh, gathering 7 to 10 hours of fieldwork per family.
- Participants selected five rooms, picking three objects to augment with computing and three to preserve in an analog state.
- Domestic objects were categorized broadly into reliable items that quietly perform their roles versus items requiring frequent upkeep and repair.
- The next case study introduced in the seminar focuses on a participant named Sheila to illustrate these domestic tensions.
[10:38](https://www.youtube.com/watch?v=jT6aYMQ0Lqw&t=638s) Household Artifacts, Domestic Clutter, and Family Dynamics
Kristin Williams shares an ethnographic account of Sheila, a retired systems administrator who carried her career mindset straight into managing her domestic life. To coordinate day-to-day operations, Sheila engineered custom systems to track when she and her husband took their medications, schedule their bill payments, and even calculate guest lists for social gatherings to maintain a balanced, regular rotation of friends so nobody felt left out. Despite automating all of these chores, Sheila felt completely depleted. As Williams recounts: “She feels like in her retirement days, she's actually working all the time.”
To manage breakdowns and pending chores, Sheila relied heavily on the physical environment as a tracking mechanism. In one vivid example, Sheila purchased a car at the end of May that came equipped with an unfamiliar Android Auto system. When the dealership failed to deliver an owner's manual, Sheila placed an administrative folder on her kitchen counter. Even after repeated follow-up calls where customer service reps promised delivery, the manual never arrived. The folder remained sitting prominently on the counter, serving as a tangible state machine tracking whether the company had fulfilled its obligation. Sheila's husband noted his acute appreciation for the labor she poured into managing household information. When prompted to update the operating systems on their home computing devices, both hesitated and refused: they feared the software upgrade would render Sheila's custom-built tools obsolete, preferring to keep their aging systems because they understood them and they functioned reliably.
Spatial arrangements in the home served not only as trackers for breakdowns, but also as scaffolds for coordinating handoffs and fostering personal identity. While ubiquitous computing and IoT paradigms envision seamlessly automating everyday domestic routines, Williams argues that this vision fundamentally fails because it ignores how people actively use physical objects and clutter:
> “So, part of the challenge with IoT's vision of automating the day-to-day is it doesn't really engage the messiness of home life. It doesn't account for the clutter and how that organizes the day-to-day.”
Physical form factors, spatial ownership, and object histories actively mediate family life and individual creativity:
- **Affordances of physical history:** One participant, Lisa, voiced a strong dislike for reading recipes off an iPad. She treasured her physical cookbook because its splatters and worn margins told a family story: “Well, you can mark it. You've got history there. There are stains from the recipes I've used a lot. I can leave something for my kids.”
- **Physical tailoring of tools:** Lisa physically altered her own baking tools—such as modifying a wooden rolling pin—to precisely suit how she rolled out pastry dough.
- **Negotiation of domestic territory:** Household members demarcated physical rooms to afford each other autonomy. Lisa remodeled the kitchen entirely to her liking, an arrangement the rest of the family supported without friction because cooking was her creative domain.
- **Upcycling as a path for IoT:** Rather than replacing these deeply contextual items with generic smart devices, Williams argues for an upcycling approach to IoT that embeds sensing capabilities into existing possessions, thereby preserving the personal histories, material traces, and social relationships already tied to them.
---
[15:06](https://www.youtube.com/watch?v=jT6aYMQ0Lqw&t=906s) Upcycled IoT and the Material Challenges of Secondhand Fabrication
To investigate how to integrate smart capabilities into pre-existing objects, Williams's lab drew inspiration from circular supply chains and *garbology*—an ethnoarchaeological method that examines how human cultures relate to material culture, waste, and disposal. Shifting toward an upcycled paradigm introduces severe design and fabrication bottlenecks. Contemporary fabrication pipelines and digital fabrication software (such as CAD suites) operate under the assumption that incoming raw materials are pristine, dimensionally true, and uniform. Secondhand materials, by contrast, bear physical scars from their previous lives that disrupt conventional fabrication. Reclaiming timber from discarded furniture, for instance, forces makers to grapple with hidden metallic fasteners (such as embedded nails), toxic legacy finishes or lead paints, and structural faults like warping, splits, and deep fissures.
To understand how craftsmen navigate these unpredictable material conditions, the research team conducted contextual inquiries in the workshops of four professional woodworkers who each possessed over a decade of experience operating businesses centered on upcycled and reclaimed timber products. The researchers tasked each artisan with recounting a recent reclaimed wood project, provided a generative toolkit designed to elicit their tacit inspection and assessment heuristics, and administered semi-structured interviews exploring how the artisans leveraged material defects directly within their aesthetic and structural design decisions.
```mermaid
flowchart TD
accTitle: Secondhand Material Contextual Inquiry Flow
accDescr: Three-step qualitative inquiry pipeline with expert upcycled woodworkers leading to system design rationale.
subgraph Inquiry["Contextual Inquiry Protocol (N=4 Experts)"]
A["Workflow Recall:<br/>Recount recent reclaimed wood project"]
B["Generative Toolkit:<br/>Surface tacit assessment heuristics"]
C["Semi-Structured Interview:<br/>Reflect on flaws, quirks, and risk strategies"]
A --> B --> C
end
subgraph Rationale["Design Rationale for Upcycling Systems"]
D["1. Surface early risk awareness"]
E["2. Tangible defect-aware inspection"]
F["3. In situ CAD-free design on material"]
G["4. Embed expert heuristics into tools"]
end
C --> D
C --> E
C --> F
C --> G
```
---
[17:34](https://www.youtube.com/watch?v=jT6aYMQ0Lqw&t=1054s) Four Design Pillars for Reclaimed Material Work and the UBench System
From the artisan field studies, Williams outlines four primary design criteria essential for supporting sustainable fabrication with non-standard, secondhand materials. Novices and intermediate makers frequently overlook critical material assessments, misinterpreting the severity of flaws or locking into rigid cuts too early. These misjudgments produce dangerous shop accidents, ruined workpieces, or structurally unviable end products. As Williams warns: “digital support could make these risks visible and understandable early so that users can make more informed decisions.”
Williams details the four design principles that emerged from their fieldwork:
1. **Early Risk Visibility:** Tools must reveal structural and chemical hazards (such as hidden screws, rotted pockets, or fragile grain) before cuts or shaping operations begin, preventing costly waste and physical injury.
2. **Defect-Aware Interactive Decision Support:** Sensing-augmented tools should engage the worker in a physical dialogue right at the bench, helping them weigh the tradeoffs of specific blemishes to decide whether an imperfection should be highlighted as a decorative feature, reinforced through a repair technique, or excised entirely.
3. **In Situ, On-Material Authoring:** Reclaimed workpieces possess idiosyncratic geometry, grain paths, and defect maps. Forcing makers to replicate these geometries inside screen-based CAD software creates friction and spatial disconnect. Instead, digital layouts and iterations should be authored directly onto the physical surface of the timber itself.
4. **Embodied Expert Guidance Ready-at-Hand:** Because upcycling remains a niche craft dominated by seasoned experts, computing interfaces should scaffold standard bench operations (such as cutting, filling, joining, and finishing) by surfacing context-sensitive heuristics at the moment the maker's design intent collides with a material defect.
To instantiate these four pillars, the lab engineered **UBench**, a digital fabrication and sensing workbench. UBench blends physical woodworking tools with embedded sensing arrays, granting makers real-time feedback on material flaws and dynamically guiding their design choices directly on reclaimed timber.
[21:19](https://www.youtube.com/watch?v=jT6aYMQ0Lqw&t=1279s) Ubench: Material Assessment and Instrumented Sensing Pens
To support defect-aware woodworking on salvaged lumber, the Ubench system turns the workpiece itself into the interactive surface, grounding assessment, interpretation, and design directly in the physical material. An overhead projector-camera unit scans the wood and projects defect boundaries and contextual data straight onto its surface. Because salvaged lumber hides internal flaws as well as surface blemishes, material assessment relies on a dual-sensing approach: an automated computer vision segmentation model and manual inspection using handheld sensing pens. A fine-tuned segmentation model first captures the wood’s exterior contours and flags visible surface defects such as knots and splits.
```mermaid
flowchart TD
accTitle: Ubench Sensing and In-Situ Design Flow
accDescr: Diagram showing how overhead computer vision and instrumented pens feed into projected feedback on the wood.
subgraph Assessment ["Material Assessment"]
A["Overhead Projector-Camera"] -->|"Contour & Surface Defects"| C["Fine-Tuned Segmentation"]
B["Instrumented Pens (Fiducial Tracked)"] -->|"Inductive / Capacitive Sensing"| D["Hidden Defects (Metal & Moisture)"]
end
subgraph Interaction ["Spatial Projection & In-Situ Design"]
C --> E["Projected Annotations on Workpiece"]
D --> E
F["Custom Pencil with 3D Pen Cap"] -->|"User Design Intent / Cut Lines"| G["Defect Management Panel"]
E --> G
G -->|"Contextual Suggestions & Warnings"| E
end
```
To uncover what the camera cannot see, woodworkers probe the material using custom-instrumented sensing pens, each tracked in 3D by the overhead camera via an attached fiducial marker. An inductive metal-detection pen locates hidden ferrous hazards such as embedded nails, screws, and staples that could damage blades or injure the user. A capacitive moisture-sensing pen gauges internal dampness to identify the danger of fungal decay, rot, biological attack, or structural instability. As the user sweeps the pens across the board, the system registers the readings and immediately projects color-coded boundaries onto the workpiece, ensuring hidden defect data remains spatially anchored to the physical lumber.
- **Overhead setup**: Integrated projector-camera unit for real-time surface scanning and projection mapping directly onto the workpiece.
- **Surface defect recognition**: Fine-tuned segmentation model identifying external contours, splits, checks, and knots.
- **Metal detection pen**: Employs an inductive sensor to detect submerged nails and staples while carving out danger margins around the metal.
- **Moisture detection pen**: Employs a capacitive sensor to flag fungal decay and structural weakness from retained water.
- **Spatial tracking**: 3D fiducial markers on each pen tie sensor readings directly to physical coordinates on the lumber.
---
[23:32](https://www.youtube.com/watch?v=jT6aYMQ0Lqw&t=1412s) In-Situ Design Dialogue and Defect Negotiation
Beyond defect identification, Ubench bridges the gap between raw material evaluation and fabrication through in-situ design. Rather than forcing the woodworker onto a separate computer workstation, the system provides a 3D-tracked pen cap that slips onto standard pens or pencils, allowing users to sketch their design plans and cut lines directly onto the timber. The overhead computer vision pipeline continuously tracks these markings, initiating an interactive dialogue between the system’s defect database and the woodworker's design intent.
When a user selects an annotated defect with an inspection pen, the system projects a defect management panel alongside it. The interface details specific risks—such as structural failure or safety hazards—and allows the woodworker to select a management strategy: featuring the defect as a visual highlight, repairing it, or discarding that section entirely. When the user's sketched design lines intersect a defect, Ubench recalculates and displays contextual guidance. For instance, if a woodworker designates a natural hole to be featured, the projected color of the defect dynamically shifts to reflect that choice; if a planned saw cut intersects an embedded nail, the system projects a prominent warning in the corner of the wood to prevent circular saw blade collisions.
During a demo of this workflow, an audience member asked whether traditional woodworkers typically just sketch on the wood. Kristin Williams affirmed that they do, explaining that the entire design philosophy was built around externalizing the tacit knowledge that seasoned artisans carry:
> “And so that was part of what we're trying to support is our experts do this all in their head.”
Novice woodworkers with around a year of experience frequently avoid reclaimed and secondhand timber because they lack the diagnostic skill to manage defects safely. Ubench provides a cognitive scaffold to help learners develop that defect awareness directly in their physical workflow.
- **Tracked pen cap**: Enables freehand sketching with the user's personal pencil or pen while tracking 2D/3D strokes via overhead vision.
- **Interactive defect panel**: Lets users inspect structural and safety implications and choose whether to feature, repair, or discard flaws.
- **Safety cut-line warnings**: Warns the woodworker if a planned circular saw line collides with embedded metal defects.
- **Cognitive scaffolding**: Targets early-stage woodworkers who otherwise avoid secondhand materials due to defect uncertainty.
---
[26:43](https://www.youtube.com/watch?v=jT6aYMQ0Lqw&t=1603s) From Secondhand Materials to Sensing Uncertainty and Air Quality
Working on Ubench highlighted a broader challenge in sustainable HCI: secondhand materials inherently force interaction designers to grapple with noisy, automated sensor data and determine how users should negotiate that ambiguity. Rather than treating sensor readings as infallible ground truth, interfaces must help users reason about noisy streams and assign their own situated meaning. To examine this dynamic systematically, Williams and her lab shifted focus toward data visualization, noting that visualizations have become central to high-stakes civic and personal decision-making. During the COVID-19 pandemic, geospatial visualizations entered the public zeitgeist as people consulted infection and transmission maps to decide whether to report to an office, visit a doctor, or buy groceries.
Yet the underlying data in these critical interfaces is fraught with uncertainty across every stage of the pipeline—from hardware measurement and algorithmic processing to downstream synthesis and analysis. Because the formal definition of uncertainty remains disputed within the broader scientific community, the researchers adopted an operational definition drawn from prior literature:
> “So what we mean by uncertainty is the possible the possibility that an event did not occur as it is being reported by the sensor.”
Instead of representing a discrete ground-truth value, a sensor reading reflects a probabilistic range. This issue is acute in low-cost air quality sensing. Over prolonged deployments, environmental sensors suffer from sensor drift caused by contaminant buildup on sensing surfaces, ambient humidity fluctuations, and physical mishandling. When user interfaces fail to communicate this drift, users make poorly informed choices. This prompted the team's core research question: how can interaction design effectively communicate uncertainty in air quality data?
- **Uncertainty origin**: Enters environmental sensing through initial physical measurement, filtering, interpolation, and downstream synthesis.
- **Operational definition**: The likelihood that an event deviates from the sensor reading, meaning true conditions fall within a wider range rather than a single reported point.
- **Sensor drift causes**: Particulate accumulation, environmental changes (e.g., elevated humidity), and hardware mishandling.
---
[29:15](https://www.youtube.com/watch?v=jT6aYMQ0Lqw&t=1755s) Designing and Evaluating Nine Air Quality Visualizations
To investigate how interaction design can resolve sensor uncertainty, the researchers developed nine distinct visualizations evaluated across two primary axes: the level of context provided and the level of interactivity supported. Sensor readings of particulate matter 2.5 ($PM_{2.5}$) were translated into the Air Quality Index (AQI) based on United States Environmental Protection Agency (EPA) guidance and color scales. To ground the uncertainty values, the team calculated the root mean square error (RMSE) between EPA $PM_{2.5}$ data gathered in California and gold-standard measurements from the Federal Reference Method.
The context axis spanned three representations:
1. **Sensor-only**: Displayed via a gauge-style plot with a central needle.
2. **Temporal context**: Displayed through a radial plot showing monthly and seasonal averages.
3. **Spatial context**: Displayed as a continuous map using Kriging interpolation to estimate values across unsensed geographical pixels between sparse monitoring stations.
The interactivity axis crossed these contextual forms across three modes:
1. **Static**: Encoded uncertainty through static visual channels, including needle fatness on the gauge, polar bar heights on the radial plot, and visual glyphs and color fills on the spatial map.
2. **Animated**: Used Animated Hypothetical Outcome Plots (HOPs), where each animated frame displays an alternate draw from the distribution of possible sensor values.
3. **Interactive**: Provided a manual slider that allowed users to scrub through individual frames of the hypothetical outcome plots at their own pace.
| Context Level | Static Representation | Animated Representation (HOPs) | Interactive Representation (Slider) |
|:--- |:--- |:--- |:--- |
| **Sensor-Only** | Gauge plot with needle fatness | Animated gauge shifting across potential draws | Gauge plot with scrubber slider across draws |
| **Temporal** | Radial plot with polar bar heights | Animated radial plot cycling seasonal draws | Radial plot with interactive temporal scrubber |
| **Spatial** | Kriging map with static glyphs/color fills | Animated Kriging map flickering possible values | Kriging map with slider stepping through frames |
To evaluate these visualizations, the team crowdsourced a within-subjects study with 150 participants. Following rigorous data quality filters, 103 participants—predominantly college-educated—were retained. The study tested whether animated presentations enabled more accurate semantic interpretations of AQI categories (e.g., distinguishing moderate from unhealthy air quality) and whether higher interactivity helped users compare two competing sensor streams to correctly identify which data source exhibited greater uncertainty.
[32:28](https://www.youtube.com/watch?v=jT6aYMQ0Lqw&t=1948s) Study Design and Surprising Inaccuracy Across Visualizations
To evaluate how users interpret environmental sensing data, participants were asked three primary sets of questions. First, they were tasked with interpreting air quality data and evaluating the reliability between two sensors, with options provided to state that they could not determine a difference or believed the two sensors were the same. Second, the study investigated whether richer contextual information enabled more confident and accurate decision-making by prompting participants to rate their confidence on a 1-to-7 scale for their initial answers.
The experimental results revealed marked divergences from initial assumptions. As expected, static visualizations supported the most accurate interpretation of air quality values. To the researchers' surprise, however, participants working with interactive and animated visualizations were actually more likely to provide inaccurate interpretations than accurate ones. Conversely, interactive visualizations proved superior when comparing data reliability between two sensors: participants using interactive designs were 1.7 times more likely than those using animated designs, and 2.1 times more likely than those using static designs, to correctly evaluate sensor reliability. A binomial regression using a logit link function confirmed this ordering to be statistically significant, aligning with the team's hypothesis on reliability comparison.
The spatial context condition introduced further counterintuitive outcomes. Rather than assisting users, the spatial condition resulted in significantly less accurate responses than either the temporal context or the sensor-only baseline. Statistical testing demonstrated a significant main effect of context on accuracy, showing that participants were roughly half as likely to make an accurate assessment when presented with spatial context compared to temporal or sensor-only views.
```mermaid
flowchart TD
accTitle: Visualization Modality and Performance Trade-off
accDescr: Visualizing the inverse relationship between static and interactive visualizations on value accuracy versus reliability comparison.
subgraph StaticVis["Static Visualizations"]
S1["Higher Accuracy on AQI Values"]
S2["Poorer Performance on Sensor Reliability"]
end
subgraph InteractiveVis["Interactive Visualizations"]
I1["Lower Accuracy on AQI Values"]
I2["1.7x to 2.1x Better at Comparing Sensor Reliability"]
end
subgraph SpatialContext["Spatial Context (Kriging)"]
SP1["Half as Likely to be Accurate vs. Temporal/Sensor-Only"]
end
```
[34:12](https://www.youtube.com/watch?v=jT6aYMQ0Lqw&t=2052s) Audience Q&A: Gradients, Discrete Bins, and the Cost of Communicating Uncertainty
During the audience discussion, an attendee noted the surprisingly high baseline rates of inaccuracy and asked what might be causing them. Kristin Williams explained that one major open question is their design decision to use continuous color gradients rather than rigid partitions: the EPA traditionally relies on discrete color bins with hard dividing lines so that an AQI category is unmistakably green, yellow, or orange. Because the research team focused specifically on uncertainty, they implemented continuous gradients to visually capture ambiguous, intermediate states, which may have led participants to misclassify borderline colors. An attendee noted that intermediate hues might fall closer to an adjacent bin in human perception, suggesting that perceptually uniform color spaces could help clarify how users interpret these border areas.
Another audience member asked whether participants marked "wrong" in the interactive condition were simply selecting a value within an uncertainty band that spanned two discrete EPA bins. Williams clarified that participants were not asked to enter raw numbers or pick hex codes; instead, they were required to categorize the reading into discrete semantic anchors (such as "moderate" or "unhealthy") while viewing a side reference legend displaying where the anchors lay along the continuous spectrum. If an uncertain value crossed multiple bins, participants were forced to make a judgment call on a single category, and selections outside the nominal target bin were scored as inaccurate.
The discussion turned to the fundamental trade-off between communicative clarity and epistemic honesty. Williams highlighted that while rigid bins produce higher nominal accuracy, they conceal the messy realities of the underlying data. Williams argued that hiding this nuance carries severe societal risks, observing: “And we got really interested in this particularly in the wake of COVID where you have a lot of backlash where people mistrust like I was shown this kind of black and white map and I made decisions based off that.” When institutions present definitive maps that mask substantial variance, the public may feel deceived if outcomes diverge. Consequently, the research aims to convey uncertainty even if lay judgments of ambiguous data do not mirror formal statistical conventions.
- EPA air quality reporting uses discrete color bands, whereas this study explored continuous gradients to communicate ambiguous states.
- Accuracy was measured against semantic index categories (e.g., low, moderate, poor air quality) rather than numeric PM2.5 readings.
- Post-pandemic communication challenges motivated the effort to make data uncertainty explicit rather than masking it behind overly neat categorical maps.
[39:22](https://www.youtube.com/watch?v=jT6aYMQ0Lqw&t=2362s) Mathematical Literacy, Kriging Artifacts, and the Accuracy Trade-Off
Williams presented several exploratory findings that further complicated the relationship between user perception and task performance. Surprisingly, there was almost no correlation between correct responses during the training task and the confidence participants expressed in their final evaluations. In fact, participants were remarkably self-assured: only 4% of all experimental trials recorded a lack of confidence. This overconfidence stood in sharp contrast to their objective performance and numeracy. The survey included three elementary questions designed to gauge self-reported mathematical proficiency, tasks that any individual with a standard high school education was expected to answer easily. Yet out of 103 respondents, only 85 reported being able to solve at least one task, and only 60 could solve two. Furthermore, the analysis uncovered a moderate negative correlation between self-reported mathematical ability and the number of correct responses on the interpretation tasks.
The pronounced failure of map-based interactive visualizations to support accurate AQI readings was partially attributed to the underlying spatial interpolation algorithms, specifically kriging. Kriging estimates values across unsampled geographic space by weighting neighboring sensor points, but this mathematical smoothing can visually mask local sensor realities. For instance, an isolated sensor location that actually recorded clean air (which would correspond to green) was smoothed into a yellow band due to surrounding high-pollution readings. Improving the communicative granularity of geostatistical techniques is therefore essential if spatial maps are to reflect local PM2.5 concentrations accurately.
Reflecting on these outcomes, Williams summarized the core tension uncovered by the experiments. Static visualizations reliably assisted participants in making definitive AQI category judgments, but interactive modalities were far more effective at helping them compare sensor reliability and grasp data uncertainty. Williams summarized this core tension by noting: “So, this suggests that there may be a trade-off between accurately interpreting the AQI and understanding the uncertainty associated with the underlying data.” Balancing these divergent needs requires deliberate interface engineering.
- Only 4% of user trials indicated a lack of confidence, despite widespread inaccuracy.
- Out of 103 participants, 85 reported completing at least one basic numeracy question and only 60 reported completing two.
- A moderate negative correlation was observed between self-reported mathematical capability and correct task answers.
- Geostatistical kriging caused localized PM2.5 values to be obscured by surrounding points, skewing user interpretations across semantic boundaries.
[41:37](https://www.youtube.com/watch?v=jT6aYMQ0Lqw&t=2497s) Epistemic Interfaces and the Sustainable HCI Research Agenda
Synthesizing the study's implications, Williams revisited the theoretical foundations of the Embodied Interaction Lab's work. She argued that uncertainty in sustainable human-computer interaction cannot be reduced to a mechanical cost-benefit calculation between immediate and long-term trade-offs. Rather, HCI researchers must grapple with how interfaces make uncertainty tangible, perceivable, and ready-to-hand for everyday decision-making, enabling non-experts to engage with intricate scientific phenomena.
Because embedded computation permeates daily physical surroundings, user interfaces play a foundational epistemic role in determining what information is accessible and what conclusions people can draw. Williams emphasized this structural role, stating: “We must grapple with how our user interfaces shape what can be known and what ideas can be generated.” Sustainable computing must extend beyond resource efficiency to embrace circular hardware lifecycles, creative upcycling, and the exposure of latent material risks.
Navigating this agenda requires computing architectures and interface designs that accommodate human perceptual and physical limitations. Presenting novel or unconventional visual encodings in scientific communication introduces unexpected cognitive overhead that can unintentionally degrade user comprehension, leaving critical questions open about how to balance algorithmic transparency, physical hardware realities, and responsible public communication.
[43:05](https://www.youtube.com/watch?v=jT6aYMQ0Lqw&t=2585s) Visualizing Aggregate Uncertainty and Battery-Free Computing Challenges
Kristin Williams explores the delicate design trade-offs involved in conveying uncertainty to everyday users. While familiar and basic visualization types often prove more effective for human perception, the central design challenge lies in providing people with a cumulative understanding of aggregate uncertainty so they can make informed decisions. Williams notes that animations—such as animated hypothetical outcome plots (HOPs) or interactive visual interfaces—can successfully steer people away from fixating on a single isolated data point and help them visualize the full distribution and range of possibilities. However, interactivity introduces its own double-edged sword: enabling users to actively manipulate the visualization can also inadvertently empower them to cherry-pick and fixate on their own favored interpretation of the data. Balancing these dynamics remains an open research challenge.
Beyond visual representation, Williams points to emerging technological paradigms in wireless networking and paper-based computing that aim to eliminate batteries from Internet of Things (IoT) hardware altogether. Removing batteries significantly reduces toxic chemical residue and electronic waste. Yet, operating without continuous power sources means the underlying sensors are inherently unstable and uncertain. To address this persistent sensor uncertainty, interactive systems cannot rely solely on automated heuristics; interaction designers must explicitly craft roles for end users to help interpret, contextualize, and assign subjective meaning to noisy sensor feeds, supported by robust tangible interaction techniques. Furthermore, aligning people’s mental models with the system's underlying data feedback requires active intervention, leading Williams’s lab to adopt participatory design methods to study how interactive affordances can bridge this conceptual gap.
```mermaid
flowchart TD
accTitle: Balancing Uncertainty and User Interpretation
accDescr: Diagram illustrating the inputs, technical interventions, and user roles required to manage sensor uncertainty in sustainable computing.
subgraph Design["Interaction Strategies"]
B --> C["Animated Hypothetical Outcome Plots (HOPs)"]
B --> D["Tangible & Interactive Affordances"]
end
subgraph Outcomes["User Cognition"]
C --> E["Prevents Single-Point Fixation"]
D --> F["User Meaning-Making & Mental Model Alignment"]
end
```
[45:01](https://www.youtube.com/watch?v=jT6aYMQ0Lqw&t=2701s) Embracing Uncertainty in Sustainable HCI and Concluding Remarks
Bringing the presentation to a close, Williams synthesizes the overarching philosophy required to tackle sustainability within human-computer interaction. Designers cannot treat ecological stewardship as a problem that will be solved by educating users into specialists: “So, in conclusion, we cannot expect everyone to become a sustainability expert.” Rather than burdening individuals with technical fluency, the HCI community must invent novel interaction paradigms that inherently accommodate and communicate ambiguity, empowering non-experts to work comfortably alongside uncertainty.
Williams calls on researchers to prototype and actively build alternative computing futures, experimenting directly with low-impact materials to confront the "low-carbon innovation paradox." This paradox demands that technologists critically reassess the hidden environmental footprint of the very digital systems built to monitor sustainability, intentionally substituting, replacing, or reimagining material choices. Williams asserts: “By embracing uncertainty as a central research question, we can allow for collective response and opportunities for community resolution.” Concluding on a warm note, she expresses deep gratitude to her faculty collaborators and offers a pointed acknowledgment to the funding bodies supporting open-ended research: “And at this time with their skepticism about funding scientific curiosity, I want to thank the funders who continue to seed and prioritize new ideas that are driven by scientific findings and investigator creativity.” The audience responds with applause as the session opens for questions.
[46:10](https://www.youtube.com/watch?v=jT6aYMQ0Lqw&t=2770s) Q&A: Family Collaboration, Fragility, and Boundary Objects in the Home
The question-and-answer period begins with an attendee asking Williams to expand on the findings from her structured interview studies. Williams chuckles and asks for clarification: “The first one in the home tours or the second, the woodworking?” When the attendee leaves it open, Williams laughs and snorts slightly, explaining, “Okay, um, so I can’t talk about the woodworking—that piece is under review, so I don’t want to go there.”
Focusing instead on the in-home tours, Williams shares that participants routinely voiced anxieties that grafting smart IoT capabilities onto ordinary household belongings introduced fragility and threatened to ruin cherished possessions. She connects this to findings from her paper on family collaboration, which investigated how multi-person households negotiate smart upgrades:
```mermaid
flowchart LR
accTitle: In-Home IoT Negotiation Process
accDescr: A sequential flow showing how families move from initial ideas to prototype reflection and final consensus using boundary objects.
A["Home Tour & Ideation"] --> B["24-Hour Defamiliarization"]
B --> C["Physical Artifact as Boundary Object"]
C --> D["Tension Resolution & Consensus"]
```
- **Defamiliarization through Living Prototyping:** While standard brainstorming occurred, Williams was most intrigued by defamiliarization. When families were asked to live with and work through an IoT concept in their physical space for 24 hours, they gained a far deeper appreciation of the practical repercussions and stepped back to critically reflect on how modifications would alter their daily routines.
- **Asymmetric Household Dynamics:** In several homes, a single enthusiastic individual acted as the technological driver, dreaming up elaborate automation scenarios, while other family members passively acquiesced with an attitude of, "Okay, whatever you say, I'll just tag along."
- **Physical Boundary Objects:** Borrowing from anthropological theory, Williams describes how tangible items functioned as boundary objects. Physically pointing to, touching, and manipulating the target heirloom grounded family tensions, shifting debates away from vague hypotheticals: “It made it more concrete and less of an abstract proposition.”
[48:56](https://www.youtube.com/watch?v=jT6aYMQ0Lqw&t=2936s) Q&A: Material Provenance and Product Attachment to Analog Objects
An audience member follows up on the distinction between how people relate to digital versus non-digital possessions, asking Williams to elaborate on her earlier point that users exhibit significantly stronger attachments to their non-IoT belongings. Williams grounds her response in digital consumption and marketing literature, which has established using standardized psychometric scales that consumers consistently fail to form the same deep, enduring product attachments to digital hardware as they do to analog artifacts.
In Williams’s fieldwork, this divergence surfaced organically without explicit prompting. When researchers asked participants simple, neutral sorting questions—such as what household items they might consider augmenting with computation versus what objects must remain untouched—participants vehemently protected sentimental heirlooms:
- **Unprompted Preservation:** Participants recoiled at the idea of altering sentimental objects, such as an inherited painting passed down from a grandfather, insisting on its absolute preservation in its original state.
- **Material Provenance and Social History:** Williams explains that attachment is not merely a psychological reaction to physical form; it is fundamentally tied to provenance, historical trajectory, and the role the artifact occupies in the social life of the household and its living spaces.
[50:50](https://www.youtube.com/watch?v=jT6aYMQ0Lqw&t=3050s) Q&A: Overcoming Functional Fixation Through Dysfunctional Routines
A participant raises the problem of functional fixation, questioning how everyday users can evaluate the trade-offs of upcycling non-smart objects when they lack a clear mental framework for what smart computing adds. The questioner remarks that unless a concrete value is presented, people often see only the downsides—or restrict their imagination to mundane commercial tropes like an internet-connected refrigerator that merely alerts them when a door is left ajar.
Williams agrees that functional fixation is a formidable obstacle, recalling discussions she held with industrial design educators on how they teach design students to break past static perceptions of objects. To overcome this rigidity during their research, Williams’s team deployed a multi-stage probe:
- **The Five-Day Diary Study:** Following the initial home tour, researchers gave households simple stickers to place on everyday objects, accompanied by small USB microphones.
- **Focusing on Function Over Form:** Rather than asking participants to sketch new physical form factors, the study prompted them to speak into the microphones and imagine functional interventions that could alter their domestic habits.
- **Targeting Dysfunctional Routines:** This approach revealed that participants were most motivated to integrate IoT not for abstract novelty, but to remedy chronic domestic frictions. As Williams explains: “And this is where we really did come to some conclusions about dysfunctional routines were the places where people wanted to modify the artifact to address the dysfunction of that routine.”
As the session nears its end, another audience member shifts back to visualization techniques, asking how Williams’s multi-sensor uncertainty smoothing models hold up in situations where a user has only a single, isolated sensor—such as a single camera or individual air quality index (AQI) monitor—where error stems not from statistical variance across multiple devices, but from systematic sensor bias that consistently over- or under-reports conditions.
[53:44](https://www.youtube.com/watch?v=jT6aYMQ0Lqw&t=3224s) Temporal Visualizations and Calibrating Sensor Drift
Kristin Williams clarifies the mechanics of the temporal and sensor-only visualizations discussed in her study, contrasting them with spatial approaches. While spatial context maps attempt to interpolate between multiple physical sensors using slider interfaces, the temporal and sensor-only visualizations rely strictly on an isolated single stream of numerical data. Williams acknowledges that the study setup had a subtlety that could be misunderstood: participants tasked with evaluating two points in the temporal visualization were not comparing two different physical units, but rather judging reading accuracy from the exact same physical sensor at two distinct moments in time.
When asked by an audience member how the error was sampled and whether real hardware was used, Williams explains that the dataset was collected directly from the California Environmental Protection Agency (EPA) website, utilizing their root-mean-square error (RMSE) benchmarks. She highlights the EPA's Federal Reference Method (FRM), which serves as a publicly reported gold standard indicating precisely where sensor values should have been recorded on a given date and time. This reference provides the ground truth necessary to track and quantify physical sensor drift over longitudinal deployments.
```mermaid
flowchart TD
accTitle: Single Sensor Temporal Evaluation Pipeline
accDescr: Pipeline showing EPA air quality data compared against Federal Reference Method to evaluate temporal sensor drift without spatial interpolation.
subgraph Analysis["Error Calibration"]
C["Root-Mean-Square Error Calculation"]
D["Temporal Drift Tracking Over Time"]
end
subgraph Interface["User Evaluation"]
E["Single-Sensor Temporal Visualization"]
F["Participant Judgment: Time Point 1 vs. Time Point 2"]
end
A --> C
B --> C
C --> D
D --> E
E --> F
```
- Temporal evaluations compared readings from the identical physical sensor across two distinct time stamps rather than cross-comparing separate devices.
- The baseline ground truth was derived from the EPA's Federal Reference Method (FRM), designed specifically to quantify sensor drift.
- Spatial visualization techniques relied on interpolating values across neighboring nodes, whereas temporal models operated without spatial interpolation.
---
[55:11](https://www.youtube.com/watch?v=jT6aYMQ0Lqw&t=3311s) Designing for Uncalibrated Sensors and Seasonal Variations
An audience member asks how designers should handle visualization interfaces when no authoritative reference record or ground truth exists to self-calibrate drifting hardware. Williams explains that uncertainty is inherently embedded within real-world deployments because researchers cannot always verify whether field devices were maintained properly. “I think that that's essentially baked into the visualizations in the sense that we have no idea whether those sensor readings that we pulled down from the California website were calibrated or not,” Williams points out, adding candidly that maintenance lapses often occur simply because “somebody was sick the day they were supposed to go calibrate it or whatever.”
To mitigate this absence of absolute ground truth, Williams' team structured the data around environmental patterns, such as seasonal variation. Drifting tendencies frequently correlate with ambient fluctuations in temperature and humidity. Williams credits co-author Aries, an air quality expert on the research paper, who guided the team's temporal sampling strategy: “Oh yeah, make sure you get December because the air quality is going to be really bad because of the way the weather changes and it's colder and things like that.” Incorporating these domain-specific temporal rhythms allowed the interface to visualize drift patterns and uncertainty bounds even when direct recalibration could not be verified.
- Missing calibrations in open datasets often stem from mundane physical disruptions, including missed field-maintenance schedules.
- Environmental parameters like humidity and seasonal temperatures correlate with sensor accuracy drops.
- Expert guidance identified December as a critical sampling window due to severe cold-weather air inversions and degraded air quality.
---
[56:32](https://www.youtube.com/watch?v=jT6aYMQ0Lqw&t=3392s) Hazards of E-Waste and Shifting to Woodworking Upcycling
The Q&A shifts to physical fabrication and circular design when an attendee inquires about practical applications for upcycling hardware, digital devices, and cyberware components. Williams notes that although research initiatives exist to reclaim sensors and electronic parts from discarded devices, the physical reality of processing electronic waste poses severe hurdles. “One of the challenges that I worry about with reclaiming these components from e-waste is we get into all of the occupational hazards that studies of e-waste in other countries have shown us,” Williams states, emphasizing that dismantled electronics release hazardous substances into the immediate environment.
Reclaiming electronic materials requires specialized techniques and personal protective gear to prevent workers from inhaling toxic solder dust or absorbing dangerous chemicals through touch. Because of these biohazards, Williams' research group intentionally pivoted their investigation toward reclaimed woodworking materials. Woodworking offers a safer, more tractable experimental model for studying how interactive fabrication systems can adapt to reclaimed materials with irregular structural flaws and embedded contaminants, without subjecting lab researchers to the severe toxicity found in electronics dismantling streams.
- E-waste processing introduces severe occupational hazards, including airborne solder particles and chemical toxicity.
- Manual component reclamation requires specialized protective controls, such as respirators, gloves, and targeted ventilation.
- Woodworking was chosen as an analogous experimental medium to investigate structural contamination and reclamation without toxic exposure.
---
[58:10](https://www.youtube.com/watch?v=jT6aYMQ0Lqw&t=3490s) Designing for Disassembly, Modularity, and Reappropriation
An audience member asks what product design decisions could make high-density consumer electronics—such as smartphones, tablets, or GPUs—easier to upcycle. Williams points out that modularity and reversible mechanical attachments are the most effective structural strategies. By eliminating permanent adhesives, chemical glues, and non-reworkable solder joints, hardware manufacturers can design circuit board layouts that allow high-wear components like batteries to be swapped out easily while retaining intact processing and sensor assemblies.
```mermaid
flowchart LR
accTitle: Modular Disassembly Versus Reappropriation Paradigms
accDescr: Comparison between standard modular circular design and cross-industry material reappropriation.
subgraph Modular["Standard Modular Repair"]
M1["Device Disassembly"] --> M2["Replace Failing Part (Battery)"]
M2 --> M3["Identical Second Life (Same Domain)"]
end
subgraph Reapp["Radical Reappropriation"]
R1["Extract Scarce Materials"] --> R2["Cross-Industry Distribution"]
R2 --> R3["Completely Divergent Second Life"]
end
```
Williams broadens the discussion from simple repairability to the richer concept of technological reappropriation within Human-Computer Interaction literature. She observes that most circular hardware research assumes a device's second life will replicate its initial function. Instead, she challenges the field to consider radical transformations: “What if we want a second life that looks altogether different? What does that transformation in supply chain need to look like?” Williams argues that reclaiming scarce natural resources may ultimately require cross-industry business models that route extracted materials into entirely new industrial sectors rather than keeping them locked within consumer electronics pipelines.
- Eliminating industrial glues and permanent solder in favor of mechanical fasteners enables component-level modularity.
- Modular architectures prioritize replacing perishable components, such as chemical batteries, while preserving compute boards.
- HCI reappropriation frameworks focus on transforming retired hardware into altogether different use cases rather than like-for-like repairs.
- Emerging circular business models may depend on redistributing reclaimed scarce resources across completely disparate industrial supply chains.
## Notable quotes
> [41:37](https://www.youtube.com/watch?v=jT6aYMQ0Lqw&t=2497s) We must grapple with how our user interfaces shape what can be known and what ideas can be generated. — Kristin Williams
> [45:01](https://www.youtube.com/watch?v=jT6aYMQ0Lqw&t=2701s) By embracing uncertainty as a central research question, we can allow for collective response and opportunities for community resolution. — Kristin Williams
> [10:38](https://www.youtube.com/watch?v=jT6aYMQ0Lqw&t=638s) So, part of the challenge with IoT's vision of automating the day-to-day is it doesn't really engage the messiness of home life. It doesn't account for the clutter and how that organizes the day-to-day. — Kristin Williams
## Mentioned
Air Quality Index (AQI), Android Auto, Aries, California Environmental Protection Agency, Embodied Interaction Lab (EMBI Lab), Environmental Protection Agency (EPA), Federal Reference Method (FRM), Hypothetical Outcome Plots (HOPs), Kriging, Kristin Williams, Lisa, Pittsburgh, Sheila, Stanford Online, Syed Ishtiaque Ahmed, UBench, University of Toronto, interactions magazine
## Video description
For more information about Stanford’s graduate programs, visit: https://online.stanford.edu/graduate-education
October 2, 2026
This lecture covers:
• Sensing uncertainty
• When a sensor may not be reporting on an event as it occurred
• How user interfaces (UIs) and their underlying technology shape epistemic position
• Embracing uncertainty as a central research question
To follow along with the seminar schedule, visit: https://hci.stanford.edu/
Kristin Williams is an Assistant Professor of Computer Science in Emory University's College of Arts and Sciences, where she directs the Embodied Interaction Lab (EMBI Lab).
Kristin Williams argues that sustainable human-computer interaction must confront the "low-carbon innovation paradox" and embrace sensing uncertainty, shifting interface design away from false precision and toward systems that support material upcycling, domestic realities, and probabilistic reasoning.
The Low-Carbon Innovation Paradox and Sensing Uncertainty (0:10)
Technological efforts to curtail emissions often produce an innovation paradox where the infrastructure built to monitor environmental impact counteracts the intended savings. Transitioning computing from desktops (roughly one device per person) to mobile devices (five to ten per person) and projected ambient IoT environments (50 to 100 devices per person) generates immense manufacturing, networking, and computational overhead. These expanding physical fleets strain electrical grids and generate soaring volumes of electronic waste while global warming targets aim to prevent surpassing a 2.5°C threshold.
Domestic IoT Fragility and Secondhand Material Upcycling (5:38)
In-home studies across ten Pittsburgh households revealed that families resist smart home interventions that introduce fragility, computational maintenance, or corporate dependencies into previously quiet, reliable routines. Everyday objects gain domestic value through provenance and wear, prompting Williams to examine upcycling—adding computing to existing artifacts—rather than replacing them with fragile commercial devices. However, using reclaimed material introduces non-standard physical flaws such as embedded nails, rot, and structural fissures.
Interactive Scaffolding on Reclaimed Timber via UBench (21:19)
To assist non-expert woodworkers in negotiating secondhand lumber, Williams’s lab engineered UBench, an augmented fabrication workbench. The system combines an overhead projector-camera unit with 3D-tracked sensing pens—incorporating inductive sensors for hidden metal fasteners and capacitive sensors for moisture pockets. By projecting visual annotations and design dialogue directly onto the timber surface, UBench externalizes expert craft heuristics and provides safety warnings, allowing makers to actively choose whether to highlight, repair, or excise defects without relying on external CAD monitors.
Communicating Air Quality Uncertainty Across Visual Modalities (29:15)
Addressing sensor drift and ambiguous data streams in environmental sensing, Williams evaluated nine visualization designs crossing three context types (sensor-only gauge, temporal radial plot, and spatial kriging map) with three interaction modes (static encodings, animated hypothetical outcome plots, and interactive sliders). A study with 103 participants revealed an unexpected trade-off: static displays yielded the highest accuracy for categorizing discrete Air Quality Index readings, whereas interactive designs made participants 1.7 to 2.1 times more likely to correctly evaluate sensor reliability. Spatial kriging maps halved assessment accuracy compared to temporal or gauge displays due to geographic smoothing obscuring local sensor readings.
Circularity, Modular Disassembly, and Epistemic Interfaces (43:05)
Because manual e-waste reclamation exposes workers to severe toxic hazards like chemical residues and solder dust, Williams’s lab initially focused on woodworking as a safer physical proxy for non-standard material reclamation. For digital electronics, she advocates for modular designs that replace industrial adhesives with reversible mechanical fasteners to enable battery replacement while retaining compute assemblies. Ultimately, she challenges sustainable computing to view user interfaces as epistemic tools that must honestly communicate aggregate uncertainty, rather than masking system noise behind artificial certainty.
Williams concludes that sustainable HCI cannot depend on converting the public into technical experts; instead, designers must construct epistemic interfaces that embrace ambiguity, account for sensory and material drift, and enable collective decision-making alongside uncertain, battery-free, or reclaimed technologies.
Source quotes
[41:37] Kristin Williams: We must grapple with how our user interfaces shape what can be known and what ideas can be generated.
[45:01] Kristin Williams: By embracing uncertainty as a central research question, we can allow for collective response and opportunities for community resolution.
[10:38] Kristin Williams: So, part of the challenge with IoT's vision of automating the day-to-day is it doesn't really engage the messiness of home life. It doesn't account for the clutter and how that organizes the day-to-day.
Original transcript
[0:10] I really like that uh framing of this is
[0:13] a conversation more about the questions
[0:15] we don't have answers to because I think
[0:16] that's a really good set setup um for
[0:19] talking u for particularly for this
[0:21] talk. Uh so this talk is loosely based
[0:25] off an article that uh just came out in
[0:27] interactions magazine for the September
[0:29] October issue that my colleagues and I
[0:31] wrote about sensing uncertainty in
[0:33] sustainable human computer action and it
[0:36] pulls together some threads of research
[0:38] that I think are important for tackling
[0:40] questions of sustainability.
[0:44] So as Michael said, we're accumulating
[0:47] lots of stuff and I love this picture.
[0:49] Um it's some field work from uh say
[0:53] Ishtak Amed's lab out of the University
[0:55] of Toronto where they've like went and
[0:58] worked with e-waste workers. So this is
[1:00] a real picture from fieldwork talking
[1:03] about the stuff that we are accumulating
[1:06] and um you know sustainability is not a
[1:09] hot new trendy topic. It's been around
[1:11] with us for a while. Um, I would argue
[1:13] at least 25 years, but it's slow burn, I
[1:17] think, is beginning to reach a critical
[1:19] juncture. We have mounds of e-waste that
[1:22] are growing at an unsustainable
[1:23] trajectory. Um, we also have
[1:26] collectively failed to curb global
[1:28] greenhouse gas emissions uh to keep the
[1:32] planet from warming the 2.5 degrees that
[1:35] climate scientists tell us is a very
[1:37] important target for avoiding some of
[1:38] the worst effects of climate change. And
[1:41] at the same time all of this is going
[1:43] on, we're seeing an unprecedented demand
[1:45] on our energy resources. So we're seeing
[1:48] a boom in data data center development
[1:50] and the growth of AI and this is um
[1:54] making a lot of uh municipalities and
[1:56] communities ask how do we u manage our
[1:59] scarce resources like water? How is this
[2:02] going to impact us? So while
[2:04] sustainability might not be trendy, I
[2:06] think a lot of people are starting to
[2:08] ask how do we design the computing
[2:10] industry to be more sustainable and
[2:12] particular from the vantage point of a
[2:14] computer scientist. How do we design
[2:16] from within?
[2:19] But when we actually try to do that, we
[2:21] come up against this paradox known as
[2:23] the lowcarbon innovation paradox. and
[2:26] that is the technologies that we get so
[2:28] excited about maybe this can help us
[2:30] tackle some of these sustainability
[2:32] questions might actually be contributing
[2:34] to the problem. So, one example that
[2:38] I've been thinking a lot about is the
[2:39] internet of things. And there's a lot of
[2:42] promise in putting an edge device at the
[2:45] point of energy consumption so that we
[2:47] can collect data. And maybe in
[2:49] collecting that data, we can analyze
[2:50] trends, make more informed decisions,
[2:52] and be better about our energy usage.
[2:55] But at the same time that we're doing
[2:57] this, we're also raising the ratio of
[3:00] devices per person. So we've already
[3:02] done this when we moved from desktop
[3:04] computing to mobile devices. Uh we went
[3:07] from one device per person. Now we're
[3:08] probably at five or 10 as people have
[3:10] adapted things like or adopted things
[3:13] like mobile phones, tablets, now they're
[3:16] using wearables. Now we're sitting at
[3:18] like something like five to 10 devices
[3:20] per person. But when we start to talk
[3:22] about IoT embedded in the built
[3:24] environment, we're actually talking
[3:26] about maybe 50 devices per person, 100
[3:28] per person. And so that ratio is
[3:31] increasing quite a lot.
[3:34] So the same technologies that we want to
[3:36] employ to address and manage and track
[3:39] lowering our carbon emissions may
[3:41] actually be increasing them by
[3:44] contributing to carbon and use emissions
[3:46] through their manufacturer, their
[3:48] networking, their data uh storage and
[3:50] collection and increasingly computation
[3:54] computationally intensive data analysis.
[4:00] So should we abandon this project
[4:02] altogether? I mean I think this is a
[4:04] real question that some people are
[4:05] asking. Uh I personally think no. I
[4:09] think instead we need a new way of
[4:11] working and we should be more
[4:12] comfortable with uncertainty.
[4:15] So in the literature on sustainable
[4:17] computing we often see uncertainty
[4:19] talked about in terms of near-term
[4:21] versus long-term benefits. This is often
[4:25] called the rebound effect. that is some
[4:27] of the short-term gains we might have
[4:29] through making um something more
[4:32] efficient in the long term actually
[4:34] increases in the aggregate as we make it
[4:35] easier to do.
[4:38] Um but I don't want to talk about that
[4:40] kind of uncertainty that has a lot to do
[4:42] with getting accurate projections in the
[4:44] long term and being able to judge the
[4:46] near-term versus long-term benefits. And
[4:48] that's been some welltrodden material.
[4:51] But I think that's not going to actually
[4:52] help us with the questions we are up
[4:54] against. Instead, I want to talk about a
[4:57] different kind, particularly sensing
[4:59] uncertainty. And that is the data we're
[5:02] using to make these decisions. Is it
[5:04] actually reliable?
[5:07] So, when I talk about sensing
[5:09] uncertainty, I'm talking about does this
[5:11] sensor actually report on an event as it
[5:14] occurred? Or really, do we need to think
[5:18] about this data as being misleading and
[5:20] need to approximate or understand how to
[5:22] cope with the fact that it might re the
[5:25] real value might lie within a range of
[5:27] possibilities. It might not be that
[5:29] that's reported by the sensor.
[5:32] And so we need to start to think about
[5:33] how do we characterize this range and
[5:36] how do we work with it.
[5:38] So in this talk I'll walk through a
[5:40] series of projects that my group has
[5:42] been involved in uh with dealing with
[5:44] uncertainty at different levels of the
[5:46] computing stack. I'm going to start
[5:48] first about the seeds of this project
[5:50] that Michael alluded to in the
[5:51] introduction that started in my
[5:53] dissertation work where I got really
[5:54] interested in upcycling. And this is
[5:56] because I was trying to work with the
[5:58] messy reality of day-to-day objects and
[6:01] how we might embed computing in them.
[6:04] But as I started to think about how do
[6:05] we use existing objects, I realized that
[6:08] we're actually going to have to grapple
[6:09] with some of the risk and problems that
[6:12] come with working with secondhand
[6:13] materials.
[6:15] And so then I'll talk about a second
[6:17] project where we started to understand
[6:19] how might user interaction cope with
[6:21] this kind of risk in secondhand
[6:23] materials. And we found that a lot of
[6:26] the challenges actually rely on noisy
[6:29] sensing data. And so we need to be able
[6:31] to make that noise and the uncertainty
[6:33] associated with it available at
[6:35] different levels of the computing stack
[6:37] and ultimately make it interpretable at
[6:39] the user interface.
[6:42] So I'll conclude this talk with some of
[6:45] the trade-offs we faced in trying to
[6:46] make uncertainty available at the user
[6:48] interface and how to help people make
[6:50] sense of it and some closing thoughts
[6:52] about how this might enable us to start
[6:54] to tackle questions of sensing
[6:56] uncertainty and sustainable human
[6:58] computer interaction and particularly
[7:00] how do we make sensing uncertainty ready
[7:02] to hand and available in the physical
[7:04] world.
[7:08] So several years ago, I started to get
[7:10] interested in upycling. I was working on
[7:13] a project to augment day-to-day objects
[7:15] with IoT services. And to do so, we
[7:18] wanted to be able to allow for IoT to be
[7:21] grafted on to existing objects in
[7:23] lightweight ways so that they might
[7:24] participate in the IoT ecosystem. But as
[7:28] I thought about transforming everyday
[7:29] objects, I came up with this question of
[7:31] how do we know the transformation is
[7:33] actually going to be to our benefit? How
[7:35] do we know it's not going to make us
[7:36] worse off? So upycling, this
[7:39] characterization points to the fact that
[7:41] after transformation, an artifact is
[7:44] supposed to have greater value than it
[7:45] did before transformation. And this is
[7:47] in contrast to something known as down
[7:49] cycling, where you can transform an
[7:51] object, but it actually has less value
[7:53] and less use than before you ever did
[7:56] the transformation.
[7:59] So a little background about IoT,
[8:02] particularly about the smart home. IoT
[8:05] envisions automating day-to-day life. So
[8:08] to adopt IoT, a lot of times we're
[8:10] asking homeowners to embed some
[8:14] electronics and sensors into their home
[8:16] by consulting with skilled contractors.
[8:20] But in doing so, IoT is displacing many
[8:23] perfectly functioning objects. So, we're
[8:26] moving from things like LED light bulbs
[8:28] to smart bulbs, uh, sound systems to
[8:32] smart speakers. And so, as in order to
[8:36] adopt IoT, owners are being asked to
[8:38] replace their many everyday objects with
[8:40] the IoT enhanced equivalents.
[8:44] But in doing so, we're finding
[8:45] repeatedly in research that owners are
[8:47] less attached to these digital devices
[8:49] than they were to their analog devices.
[8:52] We find repeatedly that they're
[8:55] struggling to inscribe meaning onto
[8:57] their day-to-day interactions in a way
[8:58] that they never did with their dumb
[9:00] objects.
[9:04] And so we thought, what if we allow
[9:06] people to use their existing objects as
[9:09] part of IoT? That way the past and
[9:12] history of an artifact can participate
[9:14] in the IoT ecosystem. And so to
[9:17] understand how we should design for this
[9:19] kind of IoT, we worked with 10 families
[9:22] in the Pittsburgh area over a week. So
[9:24] we collected about 7 to 10 hours of data
[9:27] per family.
[9:29] And I'm only going to talk about one
[9:30] part of this study. We went out to
[9:33] people's houses and we asked them to
[9:35] give us a tour of their home. And in
[9:36] particular, we asked them to show five
[9:38] rooms and in each room to choose three
[9:41] objects that they would want to add
[9:43] computing capabilities to and three
[9:45] objects that it would be important to
[9:47] keep in their current state.
[9:49] And what we found is that owners sorted
[9:52] their artifacts in their home into those
[9:54] that function reliably and those that
[9:56] constantly need upkeep and repair. So
[10:00] families felt little need to modify
[10:02] objects that quote do what they're
[10:04] supposed to. These objects were praised
[10:07] because they made the home function
[10:09] well. They supported day-to-day activity
[10:11] and they blended into the background. In
[10:14] contrast, owners worried that adding IoT
[10:18] risked the idea of introducing fragility
[10:20] into their home by automating home
[10:23] routines and introducing computational
[10:25] management. They worried they would
[10:27] become dependent on companies who might
[10:29] have a corporate strategy that was at
[10:30] odds with their home routines or that
[10:32] could be unreliable.
[10:35] So here's a picture of Sheila. One of
[10:38] the things that um I find fascinating
[10:40] about Sheila is that before she retired,
[10:42] she was a systems administrator and she
[10:45] brought this kind of mindset to her
[10:47] household. So to manage many day-to-day
[10:50] tasks, system built uh Sheila built
[10:52] these custom systems to track what
[10:54] medication her and her husband had taken
[10:56] to manage their bill pay and to
[10:59] determine who they should invite their
[11:01] to their parties to make sure their
[11:02] friends were being in constant rotation
[11:03] and they weren't leaving people out and
[11:05] they were seeing people regularly.
[11:08] But despite automating these, Sheila
[11:10] feels exhausted. She feels like in her
[11:12] retirement days, she's actually working
[11:14] all the time. and she tells me about how
[11:18] she uses the physical environment to
[11:20] track the state of breakdowns and things
[11:22] that constantly need her attention and
[11:24] repair. So, she tells me about how she
[11:27] bought a car at the end of May and she
[11:29] asked the company, "Please send me the
[11:31] owner's manual because it had a Android
[11:33] Auto system that she was unfamiliar with
[11:36] and they never sent it." So, she called
[11:38] them and the customer service agent told
[11:40] her, "Oh yeah, I'll send you the owner's
[11:42] manual." And still Sheila never received
[11:44] it. and she tells me. So I call again
[11:48] and still it's not here. And so that
[11:50] folder sits on the counter and waits
[11:52] until the company has fulfilled its
[11:54] promise to send her the owner manual.
[11:56] The folder tracks whether um they've
[11:59] actually succeeded.
[12:03] Sheila's husband tells me how sensitive
[12:05] into he is to the effort that she puts
[12:07] into managing household information and
[12:10] managing the day-to-day environment.
[12:12] They recently were asked to upgrade
[12:14] their operating system on their
[12:15] computing devices and they were hesitant
[12:18] to do so because they were afraid that
[12:19] Sheila's custom systems would be
[12:21] obsolete in this update and they would
[12:24] rather stick with the backward or the
[12:26] old system because they knew how it
[12:28] worked and it worked well.
[12:32] So families like Sheila's described how
[12:35] they invested in their everyday
[12:36] activities and objects as part of home
[12:38] life. They used an artifact's place and
[12:41] spatial arrangement to track breakdowns
[12:44] and needed repair. They also used these
[12:46] to coordinate handoff with others.
[12:51] One of the things that we found is that
[12:53] household artifacts have nuanced roles
[12:55] in family dynamics. So, this is partly
[12:59] shaped by the form factor, but it's also
[13:00] partly shaped by the history of the
[13:02] artifact. One participant described how
[13:05] she hates using recipes on an iPad. And
[13:08] when we asked her to tell us more about
[13:10] that, she said, 'Well, you can mark it.
[13:12] You've got history there. There are
[13:14] stains from the recipes I've used a lot.
[13:16] I can leave something for my kids. For
[13:19] Lisa, the affordances of the physical
[13:21] cookbook far outweighed the digital
[13:23] capabilities.
[13:26] Overall, we found that artifacts
[13:28] nurtured owners creativity and grounded
[13:31] their interest. So Lisa loves to cook
[13:34] and here she's showing how she would
[13:36] modify one of her rolling pins to better
[13:38] support her making crust for her baking.
[13:42] We also found that people used their
[13:44] control over rooms in order to nurture
[13:46] their interest and different family
[13:49] members would subdivide the household's
[13:50] rooms to others so that people had
[13:53] complete control of space for their own
[13:55] activities and inventions. For example,
[13:58] Lisa remodeled her kitchen in order to
[14:00] support her cooking and her the rest of
[14:03] her family was completely uh at ease
[14:05] with leaving that to her discretion as
[14:07] she was the cook of the family. So, it
[14:10] need it needed to suit her needs.
[14:15] So, part of the challenge with IoT's
[14:17] vision of automating the day-to-day is
[14:19] it doesn't really engage the messiness
[14:21] of home life. It doesn't account for the
[14:23] clutter and how that organizes the
[14:25] day-to-day.
[14:27] It it doesn't engage with how the
[14:28] clutter manages the state of projects,
[14:31] coordinates handoff to others, and
[14:32] externalizes people's mental models of
[14:35] their home. They have arranged these to
[14:38] support their daily life, nurture their
[14:40] identities, and support their developing
[14:42] interest.
[14:44] So, I got really interested in upycling
[14:46] because it could use these artifacts as
[14:49] a way of preserving this past history
[14:50] and preserving the network of social
[14:52] relationships that these objects were
[14:54] embedded in.
[14:56] And so by using an upcycled approach to
[14:59] IoT, we could allow for these artifacts
[15:01] to participate in an ecosystem.
[15:06] So in thinking about how to support
[15:08] existing objects, my lab has been
[15:10] looking at novel methods for
[15:12] understanding how we design within
[15:14] circular supply chains.
[15:16] So we found some interesting methods
[15:18] that we could borrow from the field of
[15:20] garbology. So this is an
[15:22] ethnoarchchaeological method that tries
[15:24] to uncover how people relate to the
[15:26] material culture and in particular how
[15:28] do they relate to waste.
[15:31] We're finding that there are substantial
[15:33] design challenges in this area. In
[15:35] particular, how do we allow for people
[15:37] to have customization techniques and the
[15:40] skills needed to work with these
[15:42] secondhand materials? How can we help
[15:44] people develop the substantial expertise
[15:46] that they would need in order to give
[15:49] these materials a second life?
[15:53] So to get in upcycled IoT to work, we
[15:55] need to grapple with challenges that
[15:57] come from these existing objects and
[15:59] specifically their constituent
[16:01] secondhand materials.
[16:03] Current prototyping and fabrication
[16:05] techniques assume raw and uniform
[16:08] characteristics of the material. But the
[16:11] earlier life cycle of a secondhand
[16:13] material often leaves material traces
[16:15] that complicate design and fabrication.
[16:18] So, for example, if we wanted to reclaim
[16:20] wood from an old piece of furniture, we
[16:22] have to contend with things like
[16:23] embedded metal through nails or toxic
[16:26] coatings that might have come from
[16:28] painting the furniture or even
[16:30] structural inconsistencies such as
[16:32] cracks.
[16:34] And so, to tackle this, we worked with
[16:36] secondhand woodworkers.
[16:39] We tried to tap into their special hand
[16:42] knowledge by working with uh four
[16:44] woodworkers who had over 10 years
[16:46] experience each of creating and
[16:49] producing secondhand um or upcycled wood
[16:52] products as part of owning their
[16:54] woodworking company.
[16:56] We conducted a contextual inquiry in
[16:58] their workshops and designed a system in
[17:00] response to these findings.
[17:03] We asked the woodworkers to recall their
[17:05] workflow of recently working with a
[17:06] secondhand wood in a project. And we
[17:10] then asked them to use a generative
[17:11] toolkit that was meant to elicit their
[17:13] tacit knowledge about how they inspect
[17:15] and confirm and assess secondhand
[17:17] materials. And finally, we asked them to
[17:20] complete a secondhand or a
[17:22] semi-structured interview where we asked
[17:24] them to reflect on how they use the
[17:26] inconsistencies and uh quirks of
[17:29] secondhand material to shape their
[17:31] design decisions.
[17:34] So I'm not going to go into the
[17:36] empirical findings from this work. And
[17:38] said, I just want to talk about the
[17:39] design rationale that came out of this.
[17:42] So, first we saw that we need to support
[17:45] awareness of the risk of working with
[17:47] secondhand materials.
[17:49] We also saw that a system needs to help
[17:52] people manage the decisions they've made
[17:54] when they've already decided on a
[17:56] strategy to cope with the risk. Third,
[17:59] we found that people wanted to work in
[18:01] situ. that is they didn't want to work
[18:03] in computer aided design or CAD models
[18:05] but wanted to work directly with the
[18:07] material itself.
[18:09] And finally, we saw from expert workers
[18:12] that we could embody some of these
[18:14] techniques in the tools themselves so
[18:16] that learners could embody expert
[18:18] practice and become more aware of how to
[18:21] work with defects in their design
[18:22] process. So I'll talk about each of
[18:25] these in turn.
[18:27] So without guarantees of quality,
[18:30] woodworkers and particularly those who
[18:31] are fairly new or learning um and
[18:34] deepening their practice often overlook
[18:36] material assessments. They can
[18:38] misinterpret conditions or make
[18:41] premature decisions that can lead to
[18:43] some um problematic outcomes. These
[18:46] could be unsafe. They could be wasteful
[18:48] or sometimes even designs that are
[18:50] infeasible.
[18:52] digital support could make these risks
[18:54] visible and understandable early so that
[18:57] users can make more informed decisions.
[19:01] Second, we found that tangible sensing
[19:04] based tools could help workers inspect
[19:07] and make decisions about imperfections
[19:09] in the material. Interactive dialogue
[19:12] could surface the implications of
[19:14] secondhand risk for structural
[19:15] integrity, safety, and fabrication.
[19:19] By revealing the implications of these
[19:21] issues for design, hands-on engagement
[19:24] could make de defectaware interaction
[19:26] supportive in deciding whether a region
[19:29] of the material should be featured,
[19:31] repaired, or otherwise discarded.
[19:39] We also saw that each wood piece had its
[19:42] own unique character. This could be the
[19:44] dimensions. It could also be the
[19:46] distribution of imperfections as well as
[19:48] shape. So design should happen on the
[19:51] material itself. Designing directly on
[19:54] the wood let woodworkers use this
[19:56] material condition to inform their
[19:58] design process and refine their ideas
[20:01] while accounting for how the material's
[20:02] imperfections may influence the outcomes
[20:05] they're looking for.
[20:06] This minimizes the effort needed to
[20:08] translate their idea to the material and
[20:11] the spatial distance needed in order to
[20:13] adapt their design ideas to the wood's
[20:16] character.
[20:19] Lastly, we found that upycling is
[20:21] largely a niche practice limited to a
[20:23] few experts and so support tools could
[20:26] democratize this practice and make it
[20:28] more widely available. But to do so,
[20:31] expert strategies should be ready to
[20:33] hand when designing with this material.
[20:36] That way, when design intentions
[20:38] intersect with material risk, then
[20:41] people have the awareness and
[20:43] wherewithal to work with the
[20:45] imperfections at hand. This help
[20:47] woodworkers develop their skills by
[20:49] embodying expert practice and
[20:52] decision-making. And in doing so, these
[20:54] techniques can sit can be situated in
[20:56] common woodworking practice such as
[20:59] joining, filling, cutting, and
[21:01] finishing.
[21:04] So, we've developed the system Ubench in
[21:06] response to these findings.
[21:09] It combines uh hands-on engagement with
[21:12] upycling through sensing based tools.
[21:15] This allows for defect detection,
[21:17] interactive learning of the risk posed
[21:19] by the defects and direct design on the
[21:22] workpiece to allow for defectaware
[21:24] feedback.
[21:27] So in Ubench, the woodpiece itself is
[21:30] the interactive surface so that
[21:32] assessment, interpretation, and design
[21:34] remain grounded in the physical
[21:35] material. An overhead projected camera
[21:38] unit allows for the wood to be assessed
[21:42] and then project back the defect
[21:45] information on the material itself. The
[21:48] system also allows for an inch situ
[21:50] design model so that the person can work
[21:52] with the material directly.
[21:56] So for a material assessment, we use a
[21:59] fine-tuned segmentation model that
[22:01] detects the wood's contour and visible
[22:03] defects such as cracks and knots. It
[22:06] also combines instrumented sensing pins
[22:09] to allow for people to detect hidden
[22:11] defects such as metal or moisture and to
[22:14] annotate the wood piece through the
[22:16] projection. Each pen is tracked in 3D
[22:19] using an attached fidial marker. So some
[22:22] of the pens that we used is this metal
[22:24] detection pen which uses an inductive
[22:26] sensor for detecting hidden metals like
[22:29] staples or nails and a moisture sensing
[22:32] pen which uses a capacitive sensor to
[22:34] determine whether there's risk of
[22:36] biological attack, fungal decay or other
[22:39] structural problems from moisture in the
[22:41] material.
[22:42] Conditions are annotated and projected
[22:44] back onto the wood itself so that deta
[22:47] defects remain spatially tied to the
[22:49] workpiece.
[22:51] So, I'm just going to show you a small
[22:52] video of a person using these um
[22:56] inspection pens to detect moisture and
[22:58] metal. So, here's an example of a person
[23:02] using uh a moisture detection pen. And
[23:05] once they've detected it, the system
[23:08] projects a annotation of the moisture
[23:11] and its shape on the material. Here he's
[23:15] using a metal detection pen and it
[23:17] carves out the piece of the wood that
[23:20] shows where that metal and the
[23:22] implicating um the areas around it that
[23:25] might be implicated if you were to cut
[23:27] around.
[23:32] So for support for insitu design we
[23:35] allow people to design directly on the
[23:36] wood. We provide a pen cap that can be
[23:39] tracked in 3D so that the person can use
[23:41] their own pen or pencil for designing
[23:43] directly on the material. They can then
[23:46] annotate the material with their design
[23:48] plans and um and the computer vision
[23:52] overhead allows for that to be an
[23:53] interactive dialogue uh between the
[23:56] system and the person's design intent.
[24:00] An inspection pen allows a person to
[24:02] select one of the annotated defect areas
[24:05] and that can pull up a dialogue
[24:07] explaining some of the risk of the
[24:08] defect for their design. So it can
[24:11] explain what might kind of safety
[24:13] concerns or structural integrity
[24:15] concerns might be an issue with the
[24:17] defect.
[24:19] When the user's design intent intersects
[24:21] with the defect, the system gives a
[24:24] contextual suggestion based off the
[24:25] defect type, the chosen strategy, and
[24:28] the design intent. And this suggestion
[24:30] is projected onto the wood to help the
[24:32] woodworker figure out how to work with
[24:34] the defect in their design.
[24:38] So, here's a small little demo of that
[24:40] process.
[24:45] So here the person is selecting an
[24:47] annotated defect and it pulls up the um
[24:50] defect management pan panel over on the
[24:53] right hand side. And here he's assigning
[24:55] a strategy about how he wants to manage
[24:57] it, whether he wants to feature it in
[24:59] the design, repair it, or otherwise
[25:01] discard it. Here he's saying that he
[25:04] wants a hole to be featured. And so the
[25:06] color of the defect changes in response
[25:08] to the strategy he's assigned to it.
[25:19] question.
[25:20] >> Yes.
[25:21] >> How would this person typically they
[25:24] just sketch on the wood?
[25:25] >> Yes. And so that was part of what we're
[25:28] trying to support is our experts do this
[25:32] all in their head. Um they sketch on the
[25:34] wood with pencil. They have a really um
[25:36] integrated idea of how those pieces are
[25:38] going to come together. Uh, and the
[25:40] challenge is that with woodworkers who
[25:43] probably have some experience, like a
[25:45] year, they just kind of avoid secondhand
[25:47] materials because they don't have the
[25:49] skill to work with these defects. So,
[25:52] what we're trying to do is externalize
[25:54] some of that expertise that our um,
[25:56] expert woodworkers have in the system
[25:58] and provide scaffolds for learning how
[26:00] to be aware of those risk and how to
[26:03] manage them in the design process.
[26:10] Um,
[26:11] let's see. I was going to show you a
[26:13] little example of
[26:15] where the design intent inner Yeah. So,
[26:19] here's an example where the person is
[26:21] just sketching on the material, but
[26:24] their planned cut line intersects with a
[26:26] number of the defects that contain
[26:28] metal. And so here the system is
[26:30] providing a warning in the corner about
[26:33] some of the issues that would h come in
[26:35] if they were to, you know, put a
[26:36] circular saw through this material.
[26:43] So we're currently evaluating how Ubench
[26:46] can support woodworking learners to
[26:48] develop their own awareness and
[26:50] expertise in working with secondhand
[26:51] materials.
[26:53] But in this project, we found that
[26:55] secondhand materials raise questions
[26:57] about how to handle automated
[26:59] interpretation of sensor data and
[27:01] supporting the user with assigning
[27:03] meaning to it. So this is largely a
[27:06] question for designing of user
[27:07] negotiation with interaction and
[27:10] specifically it qu it raises questions
[27:11] of how to cope with noisy sensing data
[27:13] and how to support users with reasoning
[27:16] it in the unit user interface and its
[27:18] implications.
[27:20] So to tackle this question, we focused
[27:21] on data visualization.
[27:24] Visualizations are becoming increasingly
[27:26] centric to informed decisionmaking.
[27:29] Never was this more apparent than during
[27:31] the CO 19 pandemic. So we saw a lot of
[27:34] geospatial visualizations make their way
[27:36] into the public zeitgeist as people
[27:38] turned to maps to figure out how they
[27:41] would go about their day-to-day, whether
[27:42] they would work from home, whether they
[27:45] would see their doctor, whether they
[27:46] would even go to the grocery store.
[27:49] However, the data underpinning many of
[27:51] these visualizations is usually
[27:52] uncertain. Uncertainty enters data at
[27:55] all stages. So, this can be from
[27:57] measurement and processing to later
[28:00] analysis and synthesis. Yet, the
[28:02] definition of data uncertainty is
[28:04] unsettled in the scientific community.
[28:06] So, for our purposes, we use an
[28:08] operational definition in line with
[28:10] prior work. So what we mean by
[28:12] uncertainty is the possible the
[28:14] possibility that an event did not occur
[28:16] as it is being reported by the sensor.
[28:19] And so it's likely that the data falls
[28:20] within a range of values rather than the
[28:23] one reported on.
[28:25] Air quality data in particular has
[28:27] problems with uncertainty in the sensor
[28:29] reading itself. So over time sensors are
[28:32] prone to what's called sensor drift.
[28:34] This can be due to buildup of
[28:36] contaminants on the sensor, uh
[28:38] environmental changes such as increased
[28:40] humidity from the weather or even
[28:42] mishandling of the equipment itself.
[28:45] Since air and quality uh sensing is
[28:47] errorprone, this can confuse decision
[28:49] makers and it can cause performance
[28:51] problems if it's not adequately
[28:53] addressed.
[28:56] One thing we noticed though is that
[28:58] interaction design can help with sensor
[29:00] uncertainty through a suite of
[29:01] techniques such as involving the user or
[29:04] getting more context to that data. And
[29:06] so this shaped our fundamental research
[29:08] question which is how can interaction
[29:10] design support uncertainty in air
[29:12] quality data.
[29:15] We created nine visualizations that
[29:17] depicted air quality uncertainty along
[29:19] two primary dimensions. The first was
[29:21] the level of interactivity that they
[29:23] supported and the second was the level
[29:25] of context that was used to show the
[29:27] data.
[29:29] This resulted in nine visualizations and
[29:32] across them all we converted particle
[29:34] mass or particle matter 2.5 or PM 2.5
[29:38] sensor readings to the air quality index
[29:40] following the US environmental
[29:42] protection ay's guidance.
[29:44] We use the EPA's guidance to apply their
[29:47] specified translation to the PM2.5
[29:49] concentration level and to map it on to
[29:51] the AQI or the air quality index using
[29:54] their color coding scheme.
[29:58] We contextualized air quality data using
[30:00] common context forms. So spatial,
[30:03] temporal, and sensor only. For spatial
[30:06] context, we use the Crigging algorithm
[30:09] and this interpolates among spatially
[30:11] interpolates among sparsely placed
[30:13] sensors. so that you can decide what a
[30:15] pixel should be colored at that location
[30:17] even if a sensor reading isn't available
[30:19] there. For temporal context, we showed
[30:22] seasonal variation that was averaged
[30:24] into monthly and seasonal bins and we
[30:27] showed it in a radial plot. For the
[30:30] sensor data, we used a gauge style plot
[30:35] to vary interactivity. We showed
[30:37] visualizations in static, animated, and
[30:40] interactive form. So for static
[30:42] visualizations, we use color and glyphs
[30:45] to show uncertainty. For animated
[30:47] visualizations, we use techniques from
[30:49] animated hypothetical outcome plots.
[30:52] These are techniques that use each frame
[30:54] of the animation to show one of a set of
[30:57] possible values that a uh a reported
[30:59] value could take on. And lastly, for our
[31:02] interactive visualization, we use the
[31:04] same techniques from animated
[31:06] hypothetical outcome plots, but here we
[31:08] had a slider that allowed you to step
[31:09] through each frame of the inter of the
[31:12] animation.
[31:15] To measure and encode uncertainty, we
[31:17] use the root mean square error using the
[31:19] EPA's 2.5 data collected in California
[31:23] and the reported data following the
[31:25] federal reference method as the gold
[31:27] standard. For each of our static
[31:29] visualizations, we encode uncertainty
[31:32] using glyphs, polar bar height, and
[31:34] needle fatness.
[31:36] We crowdsourced our study with 150
[31:39] participants, but based our data quality
[31:42] checks, we only retained data from 103.
[31:45] We found that these participants were
[31:46] mostly college educated.
[31:49] We used a within subjects design to
[31:52] deter to investigate whether animation
[31:55] supported more accurate interpretation
[31:56] of AQI. And how we measured that is that
[32:00] we used the AQI index in order to
[32:02] determine what the value should map to
[32:05] in their color-coded scheme and what the
[32:08] um semantic amount quality of that was.
[32:10] So bad bad air quality, medium air
[32:13] quality, things like that. Second, we
[32:17] investigated whether greater
[32:18] interactivity helped users understand
[32:20] uncertainty. So to measure that we asked
[32:23] participants, okay, comparing two
[32:25] sources of data from two different
[32:26] sensor streams, which is the more
[32:28] reliable and we gave them the option to
[32:30] say, I cannot determine a difference or
[32:33] I think they're the same.
[32:36] And third, we investigated whether
[32:37] greater context allowed for more
[32:40] confident and accurate decision-making.
[32:42] And we asked them the question to rate
[32:43] their confidence on a one to seven scale
[32:46] of um on their answer to the first two
[32:48] questions.
[32:51] So, as expected, we found that static
[32:53] visualizations supported more accurate
[32:55] interpretation of air quality data. But
[32:58] to our surprise, we found that people
[33:00] were more likely to be inaccurate than
[33:02] they were accurate using the interactive
[33:04] and the animated visualizations.
[33:08] In line with our expectations, we found
[33:10] that interactive visualizations
[33:12] supported more accurate comparison of
[33:13] data reliability between two sensors.
[33:16] Surprisingly, however, people were more
[33:19] likely to be inaccurate than they were
[33:21] accurate when using the animated or the
[33:24] static visualizations. And specifically,
[33:26] we found that participants were 1.7
[33:28] times more likely than animated and 2
[33:31] times one more likely than static to
[33:34] correctly interpret data reliability.
[33:38] Using a binomial regression with the
[33:40] logic link function, we found this
[33:42] difference to be significant. and to
[33:44] show the order in line with our
[33:46] hypothesis.
[33:49] Contrary to our expectations, however,
[33:51] the spatial condition supported less
[33:53] accurate answers than the temporal and
[33:55] sensor only conditions. We found a
[33:57] significant main effect of context on
[33:59] accuracy with participants half as
[34:01] likely to be accurate using spatial
[34:04] context than they were using temporal or
[34:06] static or sensor only context.
[34:12] Yes,
[34:13] >> these are very high baseline rates of
[34:15] inaccuracy. What do you think was going
[34:17] on there?
[34:18] >> Yeah. So um one of the things well so
[34:24] one question we have that we're
[34:27] undecided about is whether a um the
[34:32] gradient color scheme that we use
[34:34] actually facilitated understanding
[34:36] uncertainty or whether um if we had had
[34:39] more like hard divides between the
[34:41] colors. So the EPA uses a hard color
[34:44] bend scheme so that it's clearly one
[34:47] color versus another. And we've chosen
[34:48] to use gradients because we care about
[34:50] uncertainty. And so we want to show um
[34:53] that sort of in between state. And so
[34:55] one of the questions we have is whether
[34:57] um they're being less accurate because
[35:00] we've made that design decision.
[35:06] >> That sort of suggests if you show me
[35:08] this hue, does it map onto green or
[35:10] orange kind of thing? It might be
[35:12] interesting if you sort of if if you're
[35:14] right then what's going on is that
[35:16] people are interpreting the sort of like
[35:17] intermediate values as closer to the
[35:20] wrong bin or something like that.
[35:22] >> I wonder if you know some of these I
[35:26] don't know these color embedding spaces
[35:28] that are more perceptually uniform might
[35:30] help tease out what's going on there.
[35:32] >> Yeah.
[35:34] >> Um so what's interesting is when you H1
[35:37] versus H2 how it flipped for interactive
[35:41] And I'm curious when you were saying if
[35:43] they were like right or wrong, were they
[35:45] right or wrong within the uncertainty of
[35:48] what was there where like let's say it's
[35:51] 5 plus or minus 20% or whatever and they
[35:54] saying eight which is within like I
[35:57] guess the uncertainty of the data
[35:58] because that's what the interactive was
[35:59] showing which is
[36:02] wrong or not wrong depending on how you
[36:04] want to measure it. And then when it
[36:05] comes to uncertainty, so I'm just
[36:06] curious like how would the font like
[36:08] right versus wrong? Is it just getting
[36:09] the actual middle number that was
[36:11] pointed versus like actually being
[36:13] within the uncertainty band? If you
[36:15] could talk a little more.
[36:16] >> Yeah. So what we mean by accurate is
[36:19] whether they've mapped on to those like
[36:21] I think it's five to seven. I don't
[36:23] exactly remember the bins that the EPA
[36:26] gives us in the air quality index where
[36:27] they say this is low air quality, this
[36:29] is moderate, this is um bad air quality
[36:32] or whatever. So when we asked people, we
[36:35] didn't ask them to specify a value or to
[36:38] specify a color. We asked them to use
[36:41] those semantic anchors. And we provided
[36:44] um this uh map along the side reminding
[36:48] them what that range looks like and
[36:50] where those anchors lie. So that's where
[36:53] their accuracy. So they might have made
[36:55] that judgment of eight when you know the
[36:59] um the bin centers on five but we asked
[37:02] them in their um in their response to
[37:05] give what would be five in their answer.
[37:09] So that's where we're saying they're
[37:11] inaccurate.
[37:12] >> I see. And so if the uncertainty went
[37:14] across two bands, it would be whichever
[37:17] is I guess the middle.
[37:19] >> Yeah. We're asking them to force is this
[37:21] bad air quality or um moderate air
[37:24] quality in their choices. So they're
[37:26] having to make a judgment like yes
[37:28] they're looking at an uncertain value
[37:30] but which bin would they put it in?
[37:32] >> Is there do you have data on whether or
[37:35] not they were more inaccurate because it
[37:37] the uncertainty was larger and went
[37:39] across bins or do not collect.
[37:43] >> Um okay. [clears throat] So, if the
[37:45] uncertainty went across two different
[37:47] bins, um, and they chose one of them
[37:49] that was technically not the middle
[37:51] bend,
[37:53] >> um, do you have data on like, oh, most
[37:55] of the time they were wrong for inter
[37:56] interactive, it was because this
[37:58] uncertainty thing or I'm just curious
[38:00] because your data like because of that
[38:02] flip where it's saying, oh, it's much
[38:04] better to know the accuracy one if you
[38:05] have like the static and then versus
[38:08] interactive is better for uncertainty
[38:10] and was the reason that interactive was
[38:12] so bad for uncertainty is because they
[38:14] were seeing that uncertainty and they
[38:15] were making a judgment that was on a
[38:18] different end of uncertainty rather than
[38:20] >> I mean probably that's what that's what
[38:22] I would hope. So I think um what we're
[38:25] trying to say is there's probably a
[38:27] trade-off here. You know you can get
[38:28] people to be more accurate with using
[38:31] more static and you know clear coded
[38:34] bends but at the same time you're not
[38:36] telling them about the underlying
[38:37] uncertainty. And we got really
[38:39] interested in this particularly in the
[38:40] wake of COVID where you have a lot of
[38:42] backlash where people mistrust like I
[38:44] was shown this kind of black and white
[38:46] map and I made decisions based off that.
[38:49] But if the underlying data is uncertain
[38:50] and it's not being communicated then
[38:53] there's a lot of distrust that they've
[38:54] been lied to. So um so that's the hope
[38:59] is that they are understanding
[39:01] uncertainty. Um it's just that the way
[39:05] they would judge uncertainty is probably
[39:06] not in line with how experts would judge
[39:08] uncertainty. Um and so you know the way
[39:12] these things get designed really have a
[39:15] powerful influence on nudging them
[39:16] towards one or the other.
[39:22] Um we also had some exploratory
[39:24] findings. So we found that there was
[39:26] little to no correlation
[39:29] um sorry I thought you were between
[39:31] correct responses during the training
[39:33] task and participants confidence in
[39:35] their answers. So interestingly only 4%
[39:38] of trials indicated a lack of confidence
[39:40] in their response.
[39:42] Our survey question also asked three
[39:45] questions to indicate self-reported
[39:47] mathematical ability. And we would have
[39:50] expected participants with a high school
[39:51] level of education to be able to
[39:53] correctly do all three tasks. But only
[39:56] 85 of our 103 respondents reported being
[39:59] able to do at least one task and only 60
[40:03] reported being able to do two.
[40:07] Surprisingly, we also found a moderate
[40:09] negative correlation with the number of
[40:11] corrected response. correct responses
[40:13] and self-reported mathematical ability.
[40:18] So overall, we were quite surprised to
[40:20] find that map-based interactive
[40:22] visualizations had the greatest gap
[40:24] between correct and incorrect answers
[40:26] for interpreting AQI values. One
[40:29] explanation may be that spatial
[40:30] interpolation techniques uh crigging
[40:33] just may not be up to the task. So after
[40:36] using crigging air quality data as a
[40:38] specific location can be visually hidden
[40:41] due to neighboring data values. So
[40:43] consequently the AQI interpretation for
[40:45] a given location might not accurately
[40:47] reflect the actual PM2.5 concentration.
[40:51] We asked about a location that could
[40:53] have appeared green but instead appeared
[40:55] yellow using crigging. So improving the
[40:57] granularity of this technique for its
[41:00] communicative purpose might improve this
[41:02] issue.
[41:06] We found that there's a trade-off
[41:07] between supporting accurate air quality
[41:09] judgments and supporting understanding
[41:11] of the data uncertainty. Participants
[41:13] were accurately interpreting the AQI
[41:15] using static visualizations, but they
[41:17] were better at comparing uncertainty and
[41:19] data reliability between two sensors
[41:22] when using the interactive
[41:23] visualizations. So, this suggests that
[41:25] there may be a trade-off between
[41:26] accurately interpreting the AQI and
[41:28] understanding the uncertainty associated
[41:31] with the underlying data. Careful design
[41:33] is needed to balance these goals.
[41:37] So when we circle back to the initial
[41:39] ideas that animated these questions, we
[41:42] find that uncertainty and sustainable
[41:43] human computer interaction isn't a
[41:45] costbenefit analysis of near versus
[41:48] long-term trade-offs. Instead, we're
[41:50] grappling with issues of making
[41:51] uncertainty perceivable, ready to hand,
[41:54] and supportive of exploring complex and
[41:58] expert concepts.
[42:00] So this is the messy reality of
[42:01] embedding computing in our day-to-day
[42:03] environment. We must grapple with how
[42:05] our user interfaces shape what can be
[42:08] known and what ideas can be generated.
[42:12] So over this talk I've showed how a
[42:14] sustainable HCI research agenda should
[42:16] innovate on circular technologies
[42:18] through upycling and in doing so can
[42:20] reveal hidden material risk to support
[42:22] creative adaptation in design. But in
[42:26] doing so, this agenda needs to cope with
[42:27] uncertainty in system architectures,
[42:30] data communication, and tangible design
[42:32] or tangible interaction.
[42:36] There are many open questions such as
[42:37] how to responsibly communicate
[42:39] uncertainty, enable responsive and
[42:42] transparent interaction with new
[42:44] software and hardware, and account for
[42:46] the constraints of human intention and
[42:48] the limitations of our perceptual
[42:50] capabilities given our bodies.
[42:55] So our findings raise questions about
[42:58] novel visualizations in scientific
[43:00] communication. Unexpected presentation
[43:03] types could have negatively influenced
[43:05] people's perception. Familiar and more
[43:08] basic types might be more effective. And
[43:10] this is an important design dimension
[43:12] that we explored.
[43:14] One challenge here is how to give people
[43:17] a cumulative understanding of aggregate
[43:20] aggregate uncertainty but help make
[43:22] informed decisions. So the animation
[43:25] that were used in the animated
[43:26] hypothetical outcome plots or in the
[43:28] interactive visualizations might have
[43:30] helped people
[43:32] um go away from fixating on one
[43:35] particular data point and instead see
[43:36] the range of possibilities that that
[43:39] data might indicate. But at the same
[43:41] time, the interactive component might
[43:43] have allowed people to fixate on their
[43:45] favored interpretation of the data.
[43:48] So going forward, one challenge will be
[43:50] to grapple with how to balance these
[43:52] two.
[43:56] Second, there are emerging techniques in
[43:58] wireless networking and paperbased
[44:00] computing that can allow for us to
[44:02] remove the batteries from IoT devices.
[44:04] This would allow us to have less toxic
[44:06] residue in our um computing devices. But
[44:10] one of the problems is the sensors that
[44:11] these rely on are uncertain themselves.
[44:14] And so enable to cope with this kind of
[44:17] sensor and per certainty, we need to
[44:19] craft um we need to make roles for the
[44:23] user to have a an ability to help
[44:25] interpret and assign meaning to that
[44:27] noisy sensor data. And we also need
[44:30] techniques that robustly interpret this
[44:32] and make it available in um tangible
[44:35] interaction design.
[44:39] Lastly, one challenge with working with
[44:41] uncertainty is aligning people's mental
[44:43] models with what is um with the feedback
[44:45] in the underlying data. So, my lab has
[44:48] been taking a participatory approach in
[44:50] order to figure out how the affordances
[44:52] of an interactive system can help better
[44:54] align people's mental models with what
[44:56] the data shows.
[45:01] So, in conclusion, we cannot expect
[45:03] everyone to become a sustainability
[45:05] expert. Instead, we need new forms of
[45:07] interaction design that help people work
[45:09] with uncertainty.
[45:11] We need to imagine and design
[45:12] alternative sustainable futures and
[45:14] through prototyping and building the
[45:16] computer computing future we want to
[45:18] live in, experiment with how we might
[45:20] make these more sustainable.
[45:23] To face the lowcarbon innovation
[45:25] paradox, we need to critically grapple
[45:27] with what it means for uncertainty to be
[45:29] part of our design process and how we
[45:31] can substitute, replace, or imagine
[45:33] otherwise the materials that are part of
[45:36] our system. By embracing uncertainty as
[45:38] a central research question, we can
[45:40] allow for collective response and
[45:42] opportunities for community resolution.
[45:46] I also want to thank my faculty
[45:48] collaborators who've been a thrill to
[45:49] work with. And at this time with their
[45:51] skepticism about funding scientific
[45:53] curiosity, I want to thank the funders
[45:55] who continue to seed and prioritize new
[45:58] ideas that are driven by scientific
[46:00] findings and investigator creativity.
[46:03] So, thank you.
[46:05] [applause]
[46:10] >> All right, we got a few minutes for
[46:11] questions.
[46:14] Yes, you mentioned that you did some
[46:16] structured interviews as well. Um do you
[46:18] want to talk about some of the findings
[46:20] from that uh study?
[46:22] >> Um the first one in the home tours or
[46:25] the second the woodworking
[46:27] >> um
[46:28] >> okay um so I [snorts] can't talk about
[46:33] the woodworking that piece is under
[46:34] review so I don't [laughter] want to go
[46:36] there. Um, but for the home tours, uh, a
[46:41] lot of the findings that we found
[46:42] actually sort of reflect what I've
[46:44] already mentioned. Some of the themes
[46:45] are still there about worrying that if
[46:48] we augment these objects with IoT, um,
[46:51] there's a risk of fragility. Uh, things
[46:54] that I did not talk about that are in a
[46:58] paper I have on understanding family
[47:00] collaboration talks more about the
[47:02] dynamics that uh, tangible objects
[47:05] allow. So, one of the things we were
[47:08] looking at is how to allow for families
[47:09] to customize IoT to the home. And we
[47:12] were looking at how people might de um
[47:15] collaborate or dynamically exchange
[47:17] ideas where they converge on, oh yes, we
[47:20] want to modify this object or where they
[47:21] disagree and there's a bit of a tension
[47:23] about, oh, if we do that, then one
[47:25] person in this household is going to
[47:26] suffer. And so, we found that
[47:30] um
[47:32] there were a couple of processes these
[47:34] people used. Brainstorming is well known
[47:35] in the literature, but the ones that
[47:37] really interested us were things like
[47:39] defamiliarization. So we found that when
[47:42] people kind of have to live and work
[47:44] through an idea for like 24 hours in
[47:46] their home, they have a much better
[47:48] sense of how they would want to modify
[47:49] their home with IoT and also some of the
[47:52] consequences of doing so. So this
[47:54] ability to kind of live with the
[47:56] prototype and step back and critically
[47:58] reflect on it was very helpful for
[48:01] people to envision how that would
[48:02] unfold. Um, we also found that there
[48:06] were some households where one person
[48:08] was kind of the lead. They could imagine
[48:10] all kinds of uses for IoT, but the rest
[48:13] of the family was kind of like, "Okay,
[48:15] whatever you say, I'll just tag along."
[48:17] And this person was really the driving
[48:19] force. Um,
[48:22] we also found that just having physical
[48:25] artifacts like helped the same way you
[48:29] see in anthropological research where
[48:31] physical artifacts can serve as boundary
[48:33] objects. We saw that the physical object
[48:35] and thinking about I'm going to graft
[48:37] IoT onto this object served as a a way
[48:40] for people to negotiate tensions between
[48:42] their ideas um and to physically
[48:45] reference them in talking about how that
[48:47] idea would unfold. It made it more
[48:50] concrete and less of an abstract
[48:51] proposition.
[48:54] >> You're welcome. Yes.
[48:56] >> You had some related words saying that
[48:59] people were more attached to their nono
[49:03] stuff than the nono stuff um to motivate
[49:07] the previous. Could you talk a little
[49:10] bit about like was I quite understood
[49:12] what you mean for that and how that
[49:14] played out in the um in the interviews
[49:17] that you receive where people saying IoT
[49:20] versus
[49:21] >> Yeah. So there's several things. So in
[49:24] um I want to say it's digital or it's
[49:26] marketing research. There's this there's
[49:27] this notion of product attachment that
[49:29] people have been paying attention to for
[49:31] a long time. And um there was a a stream
[49:34] of research uh coming out about product
[49:37] attachment and finding that just people
[49:40] just aren't attached to digital devices
[49:43] the same way they are with their analog
[49:45] devices using very standardized measures
[49:47] of what product attachment looks like.
[49:49] Um, so part of what I was pointing to
[49:52] was that prior research um, in terms of
[49:55] how that played out in my work was just
[49:59] finding these unprompted responses. So
[50:03] we asked people like what is it
[50:05] important that you would add computing
[50:07] to what is it that has to stay in their
[50:09] current state? We weren't trying to
[50:11] probe for attachment and yet attachment
[50:13] came out. So we had people talk about oh
[50:16] don't add IoT to this um
[50:19] painting that my grandfather gave me
[50:22] like it's very important that stay the
[50:24] way it is and and that was part of the
[50:26] history of that object and the
[50:27] attachment people have developed both in
[50:30] terms of its provenence and its space in
[50:32] the living room or wall or whatever. So
[50:36] um so our findings add to that
[50:39] conversation where it's not just about
[50:40] product attachment. It's also talk about
[50:42] it's also an issue of material history
[50:45] and provenence of the artifact and the
[50:47] social network that it lives in.
[50:50] >> I could follow up on that.
[50:52] >> It feels like there's got to be
[50:53] [clears throat] a ton of functional
[50:54] fixation that's like playing in there
[50:57] where you know it would almost be like
[50:59] you know do you want to add a zipper to
[51:01] this or do you want to like you know add
[51:02] a button to that? It's like for what
[51:04] purpose? I'm not entirely sure. And
[51:07] without an articulation of what IoTizing
[51:10] something would do to it or how it would
[51:13] benefit me, it feels like I only see the
[51:15] downside
[51:16] >> or I or I can only imagine the upsides
[51:18] that are similar to like, oh well, my
[51:21] fridge can like, you know, attached to
[51:24] the to the internet, so it just tells me
[51:26] if I leave the door open, so maybe it'll
[51:27] do something like that. Like, how do we
[51:29] understand where someone would actually
[51:31] be willing to make that that upycling
[51:34] tradeoff without them understanding like
[51:36] what the benefit or the cost would be to
[51:38] them.
[51:40] >> Um
[51:42] >> yeah, so I remember several years ago we
[51:44] had this conversation about functional
[51:46] fixation. Um and and I I did talk to um
[51:51] some designers about methods that they
[51:53] use to even teach in their design
[51:55] classrooms to get um design students
[51:58] over functional fixation as just a
[52:00] process. Um, I've never actually run
[52:02] that with people. Uh, one we did use
[52:05] several methods where we tried to get
[52:08] people past a sort of static view of
[52:11] their artifact. So, I talk about the
[52:13] home tours and that's what we did on the
[52:15] first day we went out to their house,
[52:16] but we also did a diary study over five
[52:19] days where we asked them to like just
[52:20] attach a button to an artifact or not a
[52:23] button, a sticker to an artifact. And
[52:25] then um we gave them these little USB
[52:28] microphones where we asked them to sort
[52:30] of imagine how they would modify that
[52:32] object and to talk about the functional
[52:34] changes as opposed to like the form
[52:36] factor changes. Um and this is where we
[52:40] really did come to some conclusions
[52:42] about dysfunctional routines were the
[52:44] places where people wanted to modify the
[52:46] artifact to address the dysfunction of
[52:49] that routine. So we found some
[52:51] dysfunctions just among family dynamics
[52:53] that people were ready to to um to
[52:57] augment those objects to change that
[52:58] dynamic.
[53:02] to the other part of the talk very
[53:03] briefly [clears throat]
[53:04] the with the uncertainty visualization
[53:08] it seemed like the sort of general
[53:09] strategy there is kind of like smoothing
[53:12] like across multiple sensors essentially
[53:16] you know in your motivational example
[53:19] around you know AQI sensors and so on I
[53:22] think there's also this issue of like
[53:24] what if I only have one sensor like what
[53:26] if there's just like one camera staring
[53:28] at the thing or whatever. So then you
[53:31] have this issue not necessarily just of
[53:33] variance but of bias where like my
[53:34] sensor might just under reportports
[53:36] things or over report things. Do you
[53:38] think any of these results can help
[53:42] produce
[53:44] I guess better understandings and and
[53:46] calibrated predictions in that scenario
[53:49] where it's like I can't sort of cover
[53:51] for it by having a slider that
[53:52] interpolates between sensors but all
[53:54] I've got is just this one stream of
[53:56] numbers. So that's what the um temporal
[53:58] and the sensor only visualizations did.
[54:00] So only the um the spatial context or
[54:04] the map one was interpolating between
[54:05] multiple sensors. Um for the temporal
[54:09] um we were using one sensor. Um
[54:15] and um
[54:18] I guess it's a I was a little bit um I
[54:22] don't want to say the word misleading
[54:23] but a little bit fuzzy on this. So when
[54:25] we ask the question of like you're
[54:27] judging um two points on the temporal
[54:30] visualization, you're actually being
[54:32] asked to judge the same sensor at two
[54:34] points in time. Um
[54:36] >> and was it an actual sensor with a how
[54:38] did you sample the error?
[54:39] >> Um so we just pulled this data down from
[54:43] the EPA's website from California and we
[54:45] use their methods for the root screen uh
[54:48] root mean square error. So, um, the EPA
[54:53] has what's called the federal reference
[54:55] method that they basically report out to
[54:58] the public for exactly this purpose of
[54:59] sensor drift of this is where the sensor
[55:02] should have been on this day at this
[55:04] point in time. So that um sensors can be
[55:08] calibrated over time to address that.
[55:11] >> And what's the design technique you
[55:13] recommend if you don't know how much it
[55:14] might have drifted? Like if we don't
[55:15] have say a federal record,
[55:17] >> a gold standard to report. Yeah. Um,
[55:21] that's a really good question about So,
[55:25] you're asking how would I design a
[55:27] visualization if I can't figure out
[55:30] >> a bunch about how often it might be, but
[55:32] there's no way for it to self-calibrate.
[55:34] >> I mean, I think that that's essentially
[55:36] baked into the visualizations in the
[55:38] sense that we have no idea whether those
[55:41] sensor readings that we pulled down from
[55:42] the California website were calibrated
[55:45] or not. I suspect some of them were not
[55:47] just through human like somebody was
[55:49] sick the day they were supposed to go
[55:51] calibrate it or whatever. Um and so
[55:53] that's where we were really looking at
[55:55] things like if we bin it on seasonal
[55:57] variation. So if we know that censure
[55:59] drift is more likely to happen because
[56:01] of environmental conditions like
[56:02] humidity or something like that then
[56:04] that's going to show up in the seasonal
[56:05] variation that comes. And we were
[56:07] consulting, we had um Aries, who's an
[56:10] air quality expert, was on this paper
[56:11] and we were asking her about this and
[56:13] she was like, "Oh yeah, make sure you
[56:15] get December because the air quality is
[56:17] going to be really bad because of the
[56:19] way the weather changes and it's colder
[56:20] and um things like that." So that's
[56:23] where you saw in the temporal one very
[56:27] different um readings in the seasonal
[56:31] stuff.
[56:32] >> Thank you. One last question.
[56:33] >> I was going to say I saw one over here.
[56:36] Um I have a question about upycling. Um
[56:38] so
[56:40] some like specific applications or like
[56:43] specific examples of upycling for like
[56:46] digital products or technology like
[56:48] cyberware or hardware. How could you
[56:50] actually like
[56:52] transform?
[56:54] >> Yeah. I mean, so that I think that's one
[56:56] of those unknown questions and that's
[56:58] why we switched to something that's a
[57:00] little bit more tractable in terms of
[57:02] woodworking is there have been systems
[57:04] and efforts to try to reclaim digital or
[57:08] um sensors and components from e-waste
[57:10] in order to allow for them to be reused
[57:12] in a new product or something like that.
[57:15] Um that's ongoing work. One of the um
[57:18] challenges that I worry about with
[57:20] reclaiming these components from e-waste
[57:22] is we get into all of the occupational
[57:25] hazards that studies of e-waste um in
[57:28] other countries have shown us. So um the
[57:32] the chemicals and materials of e-waste
[57:35] are really toxic for the envir for the
[57:38] body and um so working with these
[57:40] requires specialized techniques. you
[57:42] need to know like if I pull this off the
[57:44] board, am I um sending solder into the
[57:47] air that I'm now breathing? Do I need to
[57:48] wear a mask? Do I need to wear gloves
[57:50] and stuff like that? So, that's why we
[57:52] switched over to asking about
[57:53] woodworking because we can um we're not
[57:57] uh immersing ourselves in the same
[57:59] hazardous context that we would with
[58:01] e-waste, but we're still grappling with
[58:03] some of the same issues of like how do
[58:04] we deal with material contaminants in
[58:06] the design process.
[58:10] >> Yes.
[58:10] >> Do you have like
[58:12] intuition on what design decisions has
[58:15] to be made let's say for a phone or an
[58:18] iPad to be a possible to be upcycled or
[58:22] maybe a GPU or whatever they may be.
[58:25] >> Yeah. I mean so some of the most
[58:26] compelling examples I've seen out there
[58:28] is looking at modularity and um
[58:31] attachment techniques that allow for you
[58:33] to detach very easily without getting
[58:36] into glue or solder and things like
[58:38] that. Um there's a couple of companies
[58:41] out there that have really experimented
[58:43] with phones and with laptops, which I'm
[58:45] blanking on their names at the moment,
[58:47] but u that sounds familiar. Um where
[58:51] they've started to try to understand
[58:53] like what does the layout of this board
[58:55] need to look like for um replacing very
[58:58] common uh components that are going to
[59:00] die like batteries or something like
[59:02] that, but maybe the other components in
[59:04] this device are viable. So I think that
[59:07] focusing on that kind of modularity and
[59:10] um disassembly question is a really
[59:13] promising approach. Um but I think one
[59:17] of the things that fascinates me is
[59:19] there's this long history in HCI
[59:21] literature about reappropriation which
[59:24] is this idea that we've used a device
[59:26] for something it wasn't intended for. So
[59:29] a lot of that work about modularity and
[59:31] dis disassembly is assuming that the
[59:33] second life is going to be very similar
[59:35] to the first life. Um and so u my
[59:38] questions are more about like what if we
[59:40] want a second life that looks altogether
[59:42] different? What does that transformation
[59:44] in supply chain need to look like?
[59:46] Especially um when we're starting to
[59:48] talk about reclaiming scarce natural
[59:50] resources, then there's all kinds of
[59:52] things we might want to put those um
[59:54] materials to use for. Um, and we might
[59:57] want to, it might be a more effective
[59:59] business model to redistribute them to
[60:02] different companies and supply chains
[60:04] than rather keeping them concentrated in
[60:06] the same sector where they were
[60:07] reclaimed from.