Hans Rosling Data Shows Global Wealth and Health Gap Closes
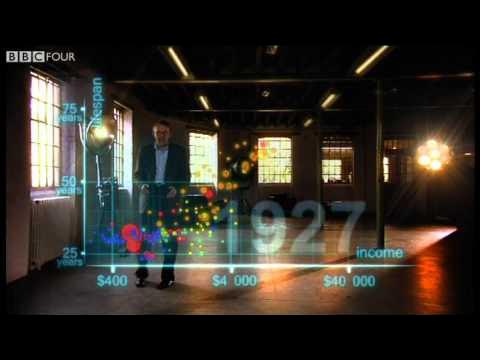
Hans Rosling's 200 Countries, 200 Years, 4 Minutes - The Joy of Stats - BBC — BBC

BBC

Two centuries of global data show that post-colonial health gains and economic growth are closing the historic developmental chasm between Western nations and the rest of the world.

AI-assisted summary of Hans Rosling's 200 Countries, 200 Years, 4 Minutes - The Joy of Stats - BBC — original source. Check the original for full context.

Source published:

Key ideas

  • In 1810, all 200 surveyed countries were clustered in the poor and sick quadrant, with life expectancy uniformly below 40 years worldwide. (0:04)
  • Global inequality reached its historical peak around 1948, creating a massive developmental chasm between Western nations and the rest of the world. (1:32)
  • Most of the modern world has transitioned into the middle tier of income and health, closing the historical gap between the West and emerging economies. (2:50)
  • National averages conceal deep internal inequalities, illustrated by China where Shanghai equals Italy in wealth and health, while rural Guizhou mirrors Ghana. (2:50)

Detailed notes

## Background Published by the BBC on YouTube on November 26, 2010, this video is an excerpt from the programme 'The Joy of Stats'. It showcases global health professor Hans Rosling using augmented reality animation and sports-commentator-style delivery to chart the development of 200 countries over 200 years using 120,000 data points.

## TL;DR Hans Rosling maps global life expectancy against per-capita income starting in 1810, when every nation was trapped in poverty and poor health with life expectancies under 40 years. Following the trajectory through the Industrial Revolution, world wars, and peak global disparity in 1948, he demonstrates how decolonization and rapid economic growth in Asia and Latin America triggered a massive catch-up. While showing that significant inequalities still persist—exemplified by disassembling China into provinces ranging from Shanghai's Italian living standards to rural Guizhou's resemblance to Ghana—Rosling highlights that the historical gap between the West and the rest is actively closing. He concludes that with aid, trade, green technology, and peace, every country has a viable path to reach the rich and healthy corner of the chart.

## Atmosphere & style The presentation carries an infectious, electrifying energy, driven by Rosling's signature blend of academic precision and breathless sports-commentary enthusiasm. Striding through a dynamic, augmented-reality studio where colorful country bubbles float, plunge, and soar around him, he transforms dry statistics into a gripping historical drama. The emotional arc moves from the grim, crowded poverty of the 19th century through catastrophic wartime shocks to a triumphant, deeply optimistic vision of global convergence and human progress.

## Bulletin - [00:04](https://www.youtube.com/watch?v=jbkSRLYSojo&t=4s) In 1810, all 200 surveyed countries were clustered in the poor and sick quadrant, with life expectancy uniformly below 40 years worldwide. - [01:32](https://www.youtube.com/watch?v=jbkSRLYSojo&t=92s) Global inequality reached its historical peak around 1948, creating a massive developmental chasm between Western nations and the rest of the world. - [02:50](https://www.youtube.com/watch?v=jbkSRLYSojo&t=170s) Most of the modern world has transitioned into the middle tier of income and health, closing the historical gap between the West and emerging economies. - [02:50](https://www.youtube.com/watch?v=jbkSRLYSojo&t=170s) National averages conceal deep internal inequalities, illustrated by China where Shanghai equals Italy in wealth and health, while rural Guizhou mirrors Ghana.

## Key takeaways - [00:04](https://www.youtube.com/watch?v=jbkSRLYSojo&t=4s) Hans Rosling uses augmented reality to map 120,000 data points tracking life expectancy against income per capita across 200 countries over 200 years. - [00:04](https://www.youtube.com/watch?v=jbkSRLYSojo&t=4s) In 1810, virtually the entire world lived in poverty and poor health, with no nation exceeding an average life expectancy of 40 years. - [01:32](https://www.youtube.com/watch?v=jbkSRLYSojo&t=92s) The Industrial Revolution initially benefited Western Europe, pulling it upward in wealth and health while colonized regions remained behind. - [01:32](https://www.youtube.com/watch?v=jbkSRLYSojo&t=92s) World War I and the 1918 Spanish flu inflicted severe downward shocks on global life expectancy. - [01:32](https://www.youtube.com/watch?v=jbkSRLYSojo&t=92s) Despite the Great Depression, Western economies maintained their long-term trajectory toward higher income and longer life expectancy. - [01:32](https://www.youtube.com/watch?v=jbkSRLYSojo&t=92s) By 1948, global inequality reached its widest margin in history, separating wealthy Western leaders like the United States from impoverished Asian and African populations. - [02:50](https://www.youtube.com/watch?v=jbkSRLYSojo&t=170s) Post-war decolonization spurred rapid gains in basic public health and life expectancy across former colonies. - [02:50](https://www.youtube.com/watch?v=jbkSRLYSojo&t=170s) Beginning in the 1970s, emerging economies in East Asia and Latin America experienced economic takeoffs, narrowing the gap with the West. - [02:50](https://www.youtube.com/watch?v=jbkSRLYSojo&t=170s) Progress in parts of Sub-Saharan Africa was severely disrupted by civil conflicts and the HIV epidemic. - [02:50](https://www.youtube.com/watch?v=jbkSRLYSojo&t=170s) The majority of the global population today resides in the middle tier of health and wealth rather than extreme poverty. - [02:50](https://www.youtube.com/watch?v=jbkSRLYSojo&t=170s) Country-level statistics mask severe domestic disparities, as seen when comparing China's coastal cities with its rural inland provinces. - [02:50](https://www.youtube.com/watch?v=jbkSRLYSojo&t=170s) With ongoing support through aid, fair trade, green technology, and peace, it is fully achievable for all nations to reach the healthy and wealthy quadrant.

## Detailed walkthrough ### [00:04](https://www.youtube.com/watch?v=jbkSRLYSojo&t=4s) Setting the Stage: Health, Wealth, and the World in 1810

Hans Rosling opens by emphasizing that data visualization lies at the very core of his profession teaching global health. Simply possessing raw statistics is never sufficient; the figures must be presented in a manner that allows audiences to genuinely understand and enjoy them. Stepping into an open studio space, Rosling undertakes an experiment he has never tried before: bringing dynamic statistical data to life in augmented three-dimensional space with the technical assistance of the television production crew.

Rosling establishes the coordinates of the graph around him. The vertical axis represents health, calibrated in life expectancy from 25 years up to 75 years. The horizontal axis measures wealth in terms of income per person, marked out at $400, $4,000, and $40,000. Under this framing, the bottom-left corner signifies nations that are poor and sick, while the top-right corner represents those that are rich and healthy. Rosling then winds the clock back 200 years to 1810, populating the space with floating, color-coded bubbles whose sizes reflect country populations: brown for Europe, red for Asia, green for the Middle East, blue for Sub-Saharan Africa, and yellow for the Americas.

Looking at the cluster gathered in 1810, Rosling observes how crowded and uniformly dire the situation was. Every nation was trapped in the poor and sick sector, and across the entire globe, average life expectancy did not exceed 40 years. Only the United Kingdom and the Netherlands stood marginally apart from the pack, though even their advantage was slight.

- **Axes Definitions**: Vertical axis measures life expectancy (25 to 75 years); horizontal axis measures income per capita ($400, $4,000, and $40,000). - **Quadrant Meaning**: Bottom-left is poor and sick; top-right is rich and healthy. - **Bubble Color Coding**: Europe (brown), Asia (red), Middle East (green), Sub-Saharan Africa (blue), Americas (yellow). - **Bubble Volume**: Scaled directly to national population size. - **Quote**: “I know having the data is not enough. I have to show it in ways people both enjoy and understand.”

```mermaid flowchart LR accTitle: The Health and Wealth Chart Setup accDescr: Mapping life expectancy against income per person across two centuries. subgraph Axes ["Chart Coordinates"] Y["Vertical: Life Expectancy<br/>(25 to 75 Years)"] X["Horizontal: Income per Person<br/>($400 - $4,000 - $40,000)"] end subgraph Baseline ["World in 1810"] BL["Bottom-Left Corner<br/>(Poor & Sick)"] TR["Top-Right Corner<br/>(Rich & Healthy)"] Pop["All nations life expectancy < 40<br/>UK & Netherlands slightly ahead"] end Axes --> Baseline BL -.->|"Goal of Development"| TR ```

[01:32](https://www.youtube.com/watch?v=jbkSRLYSojo&t=92s) The Industrial Revolution, World Wars, and the 1948 Divide

Rosling sets the world in motion, tracing how the Industrial Revolution began pulling Western European nations upward and to the right, widening the gulf between them and the rest of humanity. Colonized regions across Asia and Africa remained pinned down in poverty and illness, while Western nations steadily advanced in longevity and economic output. Rosling briefly slows the simulation to illustrate the sharp downward shocks caused by the First World War and the Spanish flu epidemic, remarking on the sheer scale of the devastation.

Accelerating through the 1920s and 1930s, the visualization reveals that despite the severe economic disruption of the Great Depression, Western nations continued forging upward toward greater wealth and longevity. Japan and a handful of other countries attempted to follow in their wake, but the vast majority of the world's population remained clustered at the bottom.

Pausing the animation in 1948—shortly after the catastrophic events of the Second World War—Rosling marks the year with personal nostalgia: the global conflict had ended, Sweden had finished first in the medal count at the Winter Olympics, and Rosling himself was born. Yet, as he highlights, the disparity among nations had reached an unprecedented peak. The United States stood far out in the lead, Japan was mounting a recovery, Brazil trailed far behind, and oil revenues were beginning to raise income in Iran without yet transforming its low life expectancy. Meanwhile, the populous Asian giants—China, India, Pakistan, Bangladesh, and Indonesia—remained languishing in deep poverty and poor health.

- **Major Historical Disruptions**: The 1918 Spanish flu and World War I caused massive, immediate dips in global life expectancy. - **Western Resilience**: Western nations maintained their long-term trajectory toward wealth and health despite the Great Depression. - **1948 Benchmark**: Marked peak historical inequality between the Western world and colonized or recently freed territories. - **Quote**: “1948 was a great year the war was over Sweden topped the medal table at the Winter Olympics, and I was born But the differences between the countries of the world was wider than ever.”

[02:50](https://www.youtube.com/watch?v=jbkSRLYSojo&t=170s) The Great Catch-Up, Modern Disparities, and a Converging World

Resuming the timeline across his own lifetime, Rosling charts the transformative effects of decolonization. As former colonies secured their independence, their populations finally began experiencing sustained, dramatic improvements in health. By the 1970s, countries across Asia and Latin America transformed into dynamic emerging economies, closing the historical distance with Western powers. While parts of Africa mirrored this upward movement, others saw their momentum crippled by the onset of civil wars and the devastating spread of the HIV epidemic.

Turning to present-day data, Rosling demonstrates that the global center of gravity has shifted entirely: the majority of humankind now resides in the middle tier rather than the bottom corner. Nevertheless, massive divides persist both between nations and within them. To prove that country-wide averages conceal stark domestic realities, Rosling disassembles the bubble for China into its constituent provinces. Coastal Shanghai matches the health and wealth standards of Italy, whereas the impoverished inland province of Guizhou aligns closely with Pakistan, and its remote rural areas mirror the living standards of Ghana.

Despite these internal divides, Rosling argues that the broad arc of the past two centuries shows indisputable, dramatic advancement. The long-standing developmental chasm separating the West from the rest of the globe is actively closing, giving rise to an interconnected, converging world. Looking ahead, Rosling expresses confidence that through targeted development assistance, fair trade, investments in green technology, and the maintenance of peace, every nation has a realistic path to join the healthy and wealthy corner.

- **The Post-Colonial Surge**: Independence unlocked rapid gains in basic healthcare and life expectancy, followed in the 1970s by economic takeoff across East Asia and Latin America. - **Within-Country Disparities**: Splitting China reveals that Shanghai reaches Italian levels of wealth and longevity, while Guizhou reflects Pakistan, and rural Guizhou resembles Ghana. - **Dataset Scope**: The entire presentation synthesizes 120,000 distinct data points across 200 countries over a span of 200 years. - **Quote**: “That huge historical gap between the west and the rest is now closing we have become an entirely new Converging world and I see a clear trend into the future with aid trade green technology and peace It's fully possible that everyone can make it to the healthy wealthy corner.” - **Quote**: “Well what you have seen in the last few minutes is a story of two hundred countries shown over two hundred years and Beyond it involves plotting a 120,000 numbers pretty neat.”

## Notable quotes > [00:04](https://www.youtube.com/watch?v=jbkSRLYSojo&t=4s) I know having the data is not enough. I have to show it in ways people both enjoy and understand. — Hans Rosling

## Mentioned Hans Rosling, The Joy of Stats, BBC, United Kingdom, Netherlands, Sweden, United States, Japan, Brazil, Iran, China, India, Pakistan, Bangladesh, Indonesia, Shanghai, Italy, Guizhou, Ghana, Industrial Revolution, World War I, Spanish flu, Great Depression, World War II, Winter Olympics

## Video description Subscribe and 🔔 to the BBC 👉 https://bit.ly/BBCYouTubeSub Watch the BBC first on iPlayer 👉 https://bbc.in/iPlayer-Home More about this programme: http://www.bbc.co.uk/programmes/b00wgq0l Hans Rosling's famous lectures combine enormous quantities of public data with a sport's commentator's style to reveal the story of the world's past, present and future development. Now he explores stats in a way he has never done before - using augmented reality animation. In this spectacular section of 'The Joy of Stats' he tells the story of the world in 200 countries over 200 years using 120,000 numbers - in just four minutes. Plotting life expectancy against income for every country since 1810, Hans shows how the world we live in is radically different from the world most of us imagine.

#bbc

[Source](https://www.youtube.com/watch?v=jbkSRLYSojo)

中文简报

汉斯·罗斯林数据揭示全球财富与健康差距正在缩小 两个世纪的全球数据表明,后殖民时期的健康改善与经济增长正在弥合西方国家与世界其他地区之间历史性的发展鸿沟。 汉斯·罗斯林绘制了始于1810年的全球预期寿命与人均收入关系图。当时所有国家都深陷贫困与健康状况不佳的困境,预期寿命均低于40岁。追溯工业革命、世界大战以及1948年全球差距达到顶峰的历程,他展示了去殖民化以及亚洲和拉丁美洲的快速经济增长如何引发了一场大规模的赶超。尽管他指出显著的不平等仍然存在——例如将中国拆分为各省来看,从达到意大利生活水平的上海到宛如加纳的贵州乡村均有分布——但罗斯林强调,西方与世界其他地区之间的历史性差距正在切实缩小。他总结道,通过援助、贸易、绿色技术与和平,每个国家都有一条可行的路径通往图表中富裕且健康的区间。 1810年,所有接受调查的200个国家都聚集在贫困与疾病的象限内,全球预期寿命普遍低于40岁。 (0:04) 全球不平等在1948年左右达到历史峰值,在西方国家与世界其他地区之间形成了巨大的发展鸿沟。 (1:32) 现代世界的大多数国家已过渡到收入和健康的中等梯队,缩小了西方与新兴经济体之间的历史性差距。 (2:50) 国家平均水平掩盖了内部深层的不平等,以中国为例,上海在财富和健康方面与意大利相当,而贵州乡村则与加纳相仿。 (2:50)

Reading summary

Global health professor Hans Rosling visualizes two centuries of international health and income data to demonstrate that the long-standing development divide between Western powers and the rest of the world is rapidly closing, moving the majority of humanity into an emerging middle tier. Framework of the Two-Century Global Health Map (0:04) Rosling maps 120,000 statistical data points across 200 countries by plotting life expectancy (calibrated from 25 to 75 years) against income per capita ($400, $4,000, and $40,000). At the 1810 baseline, all nations were clustered in the bottom-left corner of the chart, representing poor and sick populations with life expectancies universally below 40 years. Only the United Kingdom and the Netherlands exhibited a marginal advantage, establishing that universal deprivation was the baseline state of humanity two centuries ago. Industrial Divergence and the 1948 Inequality Peak (1:32) The Industrial Revolution pulled Western European nations upward and to the right on the chart, creating a massive gap as colonized territories in Asia and Africa remained pinned in low life expectancy and poverty. Despite temporary downward shocks from the First World War and the 1918 Spanish flu epidemic, as well as economic disruption during the Great Depression, Western nations sustained their long-term advance in wealth and health. By 1948, Rosling identifies an unprecedented peak in worldwide disparity. While the United States occupied a commanding lead and Japan mounted an economic recovery, populous Asian nations including China, India, Pakistan, Bangladesh, and Indonesia remained clustered in deep poverty and poor health. Decolonization, Convergence, and Internal Domestic Divides (2:50) The post-World War II era initiated a significant global catch-up, beginning with life expectancy gains following decolonization and expanding into economic surges across East Asia and Latin America during the 1970s, despite setbacks in parts of Africa caused by civil wars and the HIV epidemic. While the global center of gravity has shifted from the bottom tier to the middle, Rosling cautions that country-wide averages obscure wide internal variations. Disaggregating China's national data reveals that coastal Shanghai matches Italy in wealth and longevity, whereas the province of Guizhou aligns with Pakistan, and its rural areas reflect conditions in Ghana. Rosling asserts that the historic divide between the West and the rest is actively closing into a converging world. He projects that with the support of green technology, fair trade, development aid, and sustained peace, it is realistic for all nations to eventually reach the wealthy and healthy quadrant.

精炼阅读摘要

公共卫生学者汉斯·罗斯林(Hans Rosling)通过动态三维数据可视化展示了跨越200年、涵盖200个国家及12万个数据点的全球演进史,指出人类社会已从1810年普遍陷于疾病与贫困的状态,发展为西方与非西方差距逐步收窄的趋同世界。 数据框架与1810年全球的均质困境 (0:04) 罗斯林在演播室空间内设立了三维坐标系,纵轴衡量健康程度(预期寿命25岁至75岁),横轴衡量人均收入(设定为400美元、4,000美元与40,000美元刻度),气泡大小对应人口规模,色彩区分大洲。在该坐标下,左下角代表“贫困且多病”,右上角代表“富裕且健康”。 回溯至1810年基准点,全球所有国家均挤在左下角,平均预期寿命均未突破40岁。当时仅有英国和荷兰略微脱离群体中心,但整体优势极为微弱,整个人类社会在健康与经济层面上处于近乎一致的恶劣境地。 工业革命分化与1948年历史性鸿沟 (1:32) 工业革命拉开了全球分化的序幕,驱动西欧国家向健康与财富兼备的高位跃升,而被殖民的亚洲与非洲地区则长期滞留在贫病状态。尽管第一次世界大战、1918年西班牙流感和经济大萧条对西方社会造成了剧烈的经济波动与寿命骤降,但西方国家的长期上升趋势未被扭断。 罗斯林将坐标定格在二战结束后的1948年,指出当时的全球差距扩至历史峰值:美国遥遥领先,日本正在复苏,巴西大幅落后,伊朗虽因石油收入提升了财富却未能同步改善健康。与此同时,中国、印度、巴基斯坦、孟加拉国及印度尼西亚等人口密集的亚洲巨头依然深陷底层。 战后趋同演进与国家内部的发展撕裂 (2:50) 非殖民化浪潮使新独立国家普遍迎来基础医疗和预期寿命的跨越式改善;到了1970年代,亚洲与拉美地区多国转变为充满活力的新兴经济体,大幅拉近与西方强国的距离。尽管非洲部分国家因内战与艾滋病(HIV)蔓延遭遇波折,但全球多数人口已从底层迁入中等发展地带。 针对国家整体平均数容易遮蔽国内发展不均的问题,罗斯林拆解了中国的数据气泡作为论据:沿海省份上海的健康与财富水准已比肩意大利,而内陆的贵州省与巴基斯坦相当,其偏远农村地区更是接近加纳的生存水准。 罗斯林总结表示,两百年的演进证明历史性鸿沟正在逐步填补,全球已迈入互联趋同的新格局。他展望认为,若能持续协同推进发展援助、公平贸易、绿色技术应用与和平维护,所有国家在未来均有切实路径跨入健康且富裕的行列。

Detailed notes — zh

## Background 该视频由BBC于2010年11月26日发布在YouTube平台上。视频内容选自BBC纪录片《统计的乐趣》(The Joy of Stats),记录了全球健康学者汉斯·罗斯林(Hans Rosling)借助增强现实(AR)动画技术,以体育解说般生动的风格,在短短4分钟内利用12万个数据点梳理全球200个国家在过去200年间的健康与财富演变史。 ## TL;DR 汉斯·罗斯林通过构建以“人均预期寿命”为纵轴、“人均收入”为横轴的动态演播空间,回顾了自1810年以来全球两百年的发展轨迹。1810年时全人类普遍处于极度贫困与短寿状态,工业革命打破了这一平衡并让西方国家率先脱颖而出,使世界不平等在1948年达到历史峰值。二战后原殖民地独立与新兴经济体崛起推动全球绝大多数人口摆脱底层并迈向中位区间,尽管地区内部及国与国之间的落差依然显著,但整体历史趋势正由割裂走向聚合,展现出全人类共同迈向健康与富足的客观潜力。 ## Atmosphere & style 整段演说充满激情、节奏紧凑,汉斯·罗斯林以宛如体育赛事解说般的澎湃活力在实景演播室中穿梭互动,将原本冰冷晦涩的12万个统计数据转化为波澜壮阔的人类史诗。叙事弧线在战争与大萧条的沉重挫败、战后新生的幽默调侃,以及新兴经济体追赶的昂扬势头之间起伏交错,既直面残酷的不平等现实,又洋溢着无可辩驳的事实乐观主义,给观众带来极具震撼力与顿悟感的视听体验。 ## Bulletin - [00:04](https://www.youtube.com/watch?v=jbkSRLYSojo&t=4s) 汉斯·罗斯林通过增强现实(AR)动态演播技术,在4分钟内利用12万个数据点可视化了全球200个国家在过去200年间的健康与财富演变轨迹。 - [00:04](https://www.youtube.com/watch?v=jbkSRLYSojo&t=4s) 1810年全球所有国家的平均预期寿命均低于40岁,全人类普遍处于极度贫困与疾病交加的状态,各国之间差距极小。 - [01:32](https://www.youtube.com/watch?v=jbkSRLYSojo&t=92s) 工业革命与殖民扩张导致东西方差距在1948年达到历史峰值,美国等西方国家遥遥领先,而亚洲人口大国仍深陷底层泥潭。 - [02:50](https://www.youtube.com/watch?v=jbkSRLYSojo&t=170s) 当今世界绝大多数人口已摆脱极度贫困跃升至中游水平,但国家内部失衡显著,例如中国上海的发展水平已比肩意大利,而贵州乡村则与加纳相当。 ## Key takeaways - [00:04](https://www.youtube.com/watch?v=jbkSRLYSojo&t=4s) 数据可视化不仅在于拥有海量数据,更在于通过生动直观的形式让公众乐于接受且易于理解。 - [00:04](https://www.youtube.com/watch?v=jbkSRLYSojo&t=4s) 罗斯林构建了以人均预期寿命(25至75岁)为纵轴、人均收入(400至40,000美元)为横轴的二维宏观分析框架。 - [00:04](https://www.youtube.com/watch?v=jbkSRLYSojo&t=4s) 1810年全球各国高度聚集在图表左下角,预期寿命普遍不足40岁,即使英荷等领先国也未拉开质的差距。 - [01:32](https://www.youtube.com/watch?v=jbkSRLYSojo&t=92s) 19世纪工业革命驱动欧洲及西方国家率先突围起飞,而被殖民的亚非地区则停滞不前,全球发展严重分化。 - [01:32](https://www.youtube.com/watch?v=jbkSRLYSojo&t=92s) 20世纪初的第一次世界大战与西班牙流感大流行对全球预期寿命造成剧烈冲击,带来重大倒退。 - [01:32](https://www.youtube.com/watch?v=jbkSRLYSojo&t=92s) 经历了全球大萧条与第二次世界大战后,世界国家间的发展鸿沟在1948年扩大至历史最高峰。 - [02:50](https://www.youtube.com/watch?v=jbkSRLYSojo&t=170s) 二战后随着殖民体系解体,原殖民地国家普遍在公共卫生与国民寿命方面迎来了快速改善期。 - [02:50](https://www.youtube.com/watch?v=jbkSRLYSojo&t=170s) 1970年代起,亚洲与拉美新兴经济体启动经济赶超,打破了以往非西方国家无法崛起的定势。 - [02:50](https://www.youtube.com/watch?v=jbkSRLYSojo&t=170s) 非洲部分国家虽取得显著进展,但局部地区仍因内战与HIV疫情冲击而发展受阻。 - [02:50](https://www.youtube.com/watch?v=jbkSRLYSojo&t=170s) 当代全球绝大多数人口已摆脱极端贫困并聚集在中部地带,世界格局不再是简单的贫富两极对立。 - [02:50](https://www.youtube.com/watch?v=jbkSRLYSojo&t=170s) 国家内部发展高度不均衡,以中国为例,沿海经济中心上海可比肩意大利,而中西部农村仍接近撒哈拉以南非洲水平。 - [03:59](https://www.youtube.com/watch?v=jbkSRLYSojo&t=239s) 纵观200年历史,西方与非西方之间的历史鸿沟正加速弥合,全人类呈现向健康富裕区域聚合的趋势。 - [03:59](https://www.youtube.com/watch?v=jbkSRLYSojo&t=239s) 依托国际援助、公平贸易、绿色技术以及和平稳定的国际环境,全球所有国家均有希望迈入高健康与高财富的理想彼岸。 ## Detailed walkthrough ### [00:04](https://www.youtube.com/watch?v=jbkSRLYSojo&t=4s) 数据可视化的全新尝试与二维图表框架搭建 数据可视化处于全球健康学者汉斯·罗斯林(Hans Rosling)教学与研究的核心。他开宗明义地指出,仅仅掌握数据是远远不够的,关键在于以一种既令人愉悦又能让人轻松理解的方式呈现出来。为此,在摄制组的技术协助下,他决定尝试一种此前从未涉足的新形式——在现实空间中通过增强现实(AR)对数据进行实景动态演示。 罗斯林在演播厅中勾勒出坐标轴的轮廓:纵轴代表“健康”,以人均预期寿命衡量,范围从25岁跨越至75岁;横轴代表“财富”,以人均收入衡量,分别标注了400美元、4,000美元以及40,000美元三个数量级。依照这一架构,图表的左下角代表“贫困且多病”,而右上角则代表“富裕且健康”。在将时钟拨回200年前的1810年时,世界各国的气泡纷沓而至。各大洲被赋予鲜明的色彩标识:欧洲为棕色、亚洲为红色、中东为绿色、撒哈拉以南非洲为蓝色、美洲为黄色,而气泡的物理尺寸则对应着各国的人口规模。 1810年的全球景象极为紧凑而沉重:几乎所有的国家都拥挤在图表的左下角。当时全球各国的平均预期寿命均在40岁以下,即使是处于相对领先地位的英国和荷兰,状况也仅是稍显优越,并没有拉开本质差距。针对数据呈现的重要性,汉斯·罗斯林强调:“拥有数据是远远不够的,我必须以人们既喜欢又能理解的方式将其展现出来。”(“And I know having the data is not enough. I have to show it in ways people both enjoy and understand.”) - **纵轴指标(健康)**:人均预期寿命,25岁至75岁。 - **横轴指标(财富)**:人均收入,400美元、4,000美元至40,000美元(对数分布趋势)。 - **区域颜色编码**:棕色代表欧洲,红色代表亚洲,绿色代表中东,蓝色代表撒哈拉以南非洲,黄色代表美洲。 - **气泡大小**:直观反映国家的人口总量。 - **1810年基准特征**:所有国家预期寿命均低于40岁,全人类普遍处于极度贫困与健康匮乏的状态。 --- ### [01:32](https://www.youtube.com/watch?v=jbkSRLYSojo&t=92s) 工业革命到二战结束:两百年的分化与世界动荡 随着历史进程的齿轮启动,工业革命让欧洲及西方少数国家率先脱颖而出,向图表的右上角大步迈进。然而,亚洲和非洲的被殖民地区却依然被牢牢禁锢在贫弱的泥潭之中,东西方差距迅速撕裂。伴随西方世界健康水平的逐步积累,历史推进到了20世纪初。此时罗斯林放缓了动画速度,呈现出第一次世界大战与西班牙流感大流行的毁灭性冲击,气泡在动荡中剧烈下挫,罗斯林不禁感叹那是一场何等惨烈的灾难。 进入1920年代和1930年代,尽管遭遇了大萧条的沉重打击,西方国家依然凭借内在动能逆势前行,朝着更加富足与健康的方向迈进。当时日本等少数国家试图紧紧跟随,但绝大多数非西方国家依旧在底层挣扎。在经历了第二次世界大战的浩劫后,世界来到了1948年的重要节点。罗斯林在此风趣地回顾道,1948年是一个了不起的年份——世界大战终于宣告终结,瑞典在冬季奥运会奖牌榜上高居榜首,而他自己也恰好在这一年呱呱坠地。 然而,1948年的全球不平等程度达到了历史峰值:美国一马当先,日本正在全力追赶,巴西落在较远后方,伊朗依靠石油财富稍微走高但寿命依然很短;至于亚洲的几大人口巨头——中国、印度、巴基斯坦、孟加拉国以及印度尼西亚,依然被深困在贫困与疾病交加的底层角落。回顾这一时期的巨大割裂,汉斯·罗斯林评价道:“1948年是个伟大的年份:战争结束了,瑞典登顶冬奥会奖牌榜,我也出生了;但当时世界各国之间的差距比以往任何时候都更加悬殊。”(“1948 was a great year: the war was over, Sweden topped the medal table at the Winter Olympics, and I was born; but the differences between the countries of the world was wider than ever.”) ```mermaid flowchart TD accTitle: 1810年至1948年全球演进路径 accDescr: 展现从1810年全球贫困到工业革命西方崛起、两次大战冲击及1948年巨大分化的演进阶段。 subgraph Phase1["1810年:起点"] A["全球所有国家<br/>(预期寿命低于40岁,收入极低)"] end subgraph Phase2["19世纪:工业革命的分化"] B["西方工业国<br/>(健康与财富快速拉升)"] C["亚非殖民地国家<br/>(滞留底层泥潭)"] end subgraph Phase3["20世纪前半叶:动荡与冲刺"] D["一战与西班牙流感<br/>(预期寿命剧烈下滑)"] E["大萧条与二战<br/>(西方依然坚挺,日本尝试跟随)"] end subgraph Phase4["1948年:差距峰值"] F["领跑梯队:美国领先,日本追赶"] G["滞后梯队:中印等亚洲巨头依然贫弱"] end A --> B A --> C B --> D D --> E E --> F C --> G ``` --- ### [02:50](https://www.youtube.com/watch?v=jbkSRLYSojo&t=170s) 战后独立、新兴经济体崛起与当今世界的贫富分化 进入罗斯林有生之年的战后岁月,原殖民地国家纷纷赢得民族独立,随之而来的是其国民健康指标呈现出持续而强劲的改善。到了1970年代,亚洲与拉丁美洲的国家开始加速追赶西方阵营,演变为充满活力的新兴经济体。尽管非洲部分国家也逐步跟进,但部分地区深陷内战漩涡,随后又遭到艾滋病(HIV)疫情的重创,前进之路步履蹒跚。 在当今最新的统计数据中,世界的分布结构发生了根本转变:全球绝大多数人口已经不再处于极度贫困的底层,而是生活在居中的位置。然而,国家与国家之间的落差依然触目惊心,且国家内部的地区发展失衡同样剧烈。为了揭示国家平均数据所掩盖的真相,罗斯林现场将代表中国的大气泡拆解为具体的省份数据:领跑的上海在健康和财富指标上已经完全媲美当今的意大利;而相对贫困的内陆省份贵州则与巴基斯坦相当;若进一步深入贵州的乡村地区,其生活水平则与非洲的加纳相差无几。 - **去殖民化红利**:赢得独立后,发展中国家率先在公共卫生与人均寿命上实现突破。 - **1970年代转折**:新兴经济体在亚拉地区广泛崛起,启动追赶西方的经济起飞。 - **非洲分化态势**:部分国家保持进步,部分地区受困于内战与HIV疫情的双重打击。 - **中国区域内部拆解**: - 上海:健康与财富水平等同于欧洲发达国家意大利。 - 贵州:整体水平等同于南亚国家巴基斯坦。 - 贵州农村:发展状态等同于西非国家加纳。 --- ### [03:59](https://www.youtube.com/watch?v=jbkSRLYSojo&t=239s) 历史差距缩小与走向聚合未来的趋势 尽管当今世界内部依然横亘着巨大的贫富与健康鸿沟,但纵观整整200年的历史长河,人类社会所取得的进步堪称奇迹。过去西方世界与非西方世界之间那道看似不可逾越的历史性天堑,正在以肉眼可见的速度合拢闭合。整个世界正在摆脱两极对立的旧格局,大步迈入一个彼此趋同聚合的新纪元。 罗斯林展望未来时满怀乐观。他指出,只要依靠持续有效的国际援助、公平的对外贸易、绿色清洁技术以及持久的和平环境,全人类所有国家完全有可能携手迈进既富裕又健康的理想彼岸。在短短四分钟内,通过实景AR演播的方式,他带领观众纵览了200个国家在200年间的沧桑变迁,整场演示依托了对12万个繁复数据点的精准绘制,将原本枯燥晦涩的宏大统计史诗转化为鲜活透彻的人类史画卷。针对人类未来的发展走势,汉斯·罗斯林坚定地断言:“凭借国际援助、对外贸易、绿色科技与和平环境,所有人完全有可能共同迈入既健康又富裕的右上角。”(“With aid, trade, green technology, and peace, it's fully possible that everyone can make it to the healthy wealthy corner.”) ## Notable quotes > [00:04](https://www.youtube.com/watch?v=jbkSRLYSojo&t=4s) 拥有数据是远远不够的,我必须以人们既喜欢又能理解的方式将其展现出来。 — 汉斯·罗斯林 > [03:59](https://www.youtube.com/watch?v=jbkSRLYSojo&t=239s) 凭借国际援助、对外贸易、绿色科技与和平环境,所有人完全有可能共同迈入既健康又富裕的右上角。 — 汉斯·罗斯林 ## Mentioned 汉斯·罗斯林, BBC, The Joy of Stats, 英国, 荷兰, 美国, 日本, 巴西, 伊朗, 中国, 印度, 巴基斯坦, 孟加拉国, 印度尼西亚, 瑞典, 上海, 贵州, 意大利, 加纳 ## Video description Subscribe and 🔔 to the BBC 👉 https://bit.ly/BBCYouTubeSub Watch the BBC first on iPlayer 👉 https://bbc.in/iPlayer-Home More about this programme: http://www.bbc.co.uk/programmes/b00wgq0l Hans Rosling's famous lectures combine enormous quantities of public data with a sport's commentator's style to reveal the story of the world's past, present and future development. Now he explores stats in a way he has never done before - using augmented reality animation. In this spectacular section of 'The Joy of Stats' he tells the story of the world in 200 countries over 200 years using 120,000 numbers - in just four minutes. Plotting life expectancy against income for every country since 1810, Hans shows how the world we live in is radically different from the world most of us imagine. #bbc [Source](https://www.youtube.com/watch?v=jbkSRLYSojo)

Source quotes

[0:04] 汉斯·罗斯林: 拥有数据是远远不够的,我必须以人们既喜欢又能理解的方式将其展现出来。 [3:59] 汉斯·罗斯林: 凭借国际援助、对外贸易、绿色科技与和平环境,所有人完全有可能共同迈入既健康又富裕的右上角。

Source quotes

[0:04] Hans Rosling: I know having the data is not enough. I have to show it in ways people both enjoy and understand.

Original transcript

[0:04] Visualization is right at the heart of my own work - I teach global health [0:10] And I know having the data is not enough. I have to show it in ways people both enjoy and understand [0:17] Now, I'm going to try something I've never done before [0:19] Now, I'm going to try something I've never done before [0:22] animating the data in real space [0:25] With a bit of technical assistance from the crew [0:30] So here we go first an axis for health life [0:34] Expectancy from 25 years to 75 years and down here an axis for wealth [0:41] income per person [0:42] four hundred four thousand and [0:45] $40,000 so down here is poor and sick and up here is rich and healthy [0:53] Now I'm going to show you the world 200 years ago in [0:59] 1810 [1:00] here come over countries Europe Brown Asia [1:03] Red Middle East Queens Africa south of sahara blue and the americas yellow [1:08] And the size of the country bubbles showed the size of the population and in 1810 [1:14] It was pretty crowded down there wasn't it all countries were sick and poor life [1:19] Expectancy were below 40 in all countries and only the UK and the Netherlands were slightly better off [1:26] But not much, and now I start the world [1:32] The Industrial Revolution [1:33] makes countries in Europe and elsewhere [1:36] Move away from the rest, but the colonized countries in Asia and Africa. They are stuck down there and [1:43] eventually the Western countries get healthier and healthier [1:47] And now we slow down to show the impact of the First World War and the Spanish flu epidemic [1:55] What a catastrophe? [1:57] and now I speed up through the [2:00] 1920s and the 1930s and in spite of the Great Depression Western countries forge on towards greater wealth and health [2:07] Japan and some others try to follow [2:09] But most countries stay down here now [2:12] After the tragedies of the Second World War we stop a bit to look at the world in 1948 [2:19] 1948 was a great year the war was over [2:23] Sweden topped the medal table at the Winter Olympics, and I was born [2:27] But the differences between the countries of the world was wider than ever [2:32] The United States was in the front Japan was catching up [2:36] Brazil was way behind Iran was getting a little richer from oil, but still had short lives and the Asian giants [2:44] China India Pakistan Bangladesh and Indonesia they were still poor and sick down here [2:50] But look what is about to happen here. We go again in my lifetime [2:55] former colonies gained independence, and then finally they started to get healthier and healthier and healthier and in the [3:03] 1970s then countries in Asia Latin America started to catch up with the Western countries they became the [3:09] Emerging economies some in Africa follows some Africans were stuck in civil war and others hit by HIV [3:15] And now we can see the world today in the most up-to-date statistics [3:22] Most people today live in the middle [3:25] But there are huge difference at the same time between the best of countries and the worst of countries and there are also huge [3:32] Inequalities within countries these bubbles show country averages, but I can split them take China [3:39] I can split it into provinces [3:41] There goes Shanghai [3:44] It has the same wealth and health as Italy today, and there is the poor in line problems [3:50] Why show it is like Pakistan, and if I split it further the rural parts are like Ghana in Africa [3:57] and [3:59] Yet despite the enormous disparities today. We have seen 200 years of remarkable progress [4:06] That huge historical gap between the west and the rest is now closing we have become an entirely new [4:13] Converging world and I see a clear trend into the future with aid trade green technology and peace [4:20] It's fully possible that everyone can make it to the healthy wealthy corner [4:27] Well what you have seen in the last few minutes is a story of two hundred countries [4:33] shown over two hundred years and Beyond it involves plotting a [4:39] 120,000 numbers pretty neat