Jancovici Says Slashing Energy Use Contracts GDP and Destroys Jobs
Jean-Marc Jancovici
Because energy-driven machines perform the physical work of hundreds of laborers, contracting energy throughput inevitably shrinks output and destroys employment rather than returning workers to manual jobs.
AI-assisted summary of Jancovici : Can we save energy, jobs and growth at the same time ? 08/01/2018 — original source. Check the original for full context.
Source published:
Key ideas
- Energy is fundamentally a physical measure of environmental transformation rather than a monetary line item, meaning machines provide roughly 200 times the mechanical power of global human labor. (6:50)
- GDP growth is strictly coupled to primary energy consumption at the planetary level, rendering promises of perpetual economic growth and full employment impossible under energy contraction. (36:28)
- European fossil fuel supplies peaked between 2000 and 2006, directly driving regional economic stagnation, structural unemployment, and geopolitical friction such as Brexit. (48:45)
- Adhering to the IPCC 2°C climate target requires dividing global fossil fuel consumption by three within roughly 35 years, implying an unavoidable voluntary reduction in physical economic output and material consumption. (61:06)
Detailed notes
## Background This conference was recorded on January 8, 2018, at the École Normale Supérieure in Paris and published on YouTube by Jean-Marc Jancovici on January 30, 2018. According to the page description, Jancovici presents a physical approach to economics, arguing that natural resource depletion and climate imperatives make perpetual GDP growth impossible, necessitating a framework for managing the scaling back of the world economy.
## TL;DR Engineer and energy consultant Jean-Marc Jancovici argues that modern economic theories are fatally flawed because they treat energy and natural resources as negligible or free inputs rather than the physical foundation of production. Because machines provide hundreds of times more mechanical work than human bodies, gross domestic product and employment are directly bound to primary energy throughput. As European fossil fuel supplies deplete and international climate commitments demand drastic cuts in emissions, voluntary or involuntary economic contraction becomes inevitable. Consequently, governments cannot simultaneously sustain energy cuts, full employment, and classical economic growth without accepting profound material sobriety.
## Atmosphere & style The lecture is delivered with dry, incisive wit and an uncompromising, pedagogical rigor that steadily strips away political wishful thinking. Speaking to an academic audience, Jancovici uses straightforward arithmetic, sharp humor, and provocative historical comparisons to make complex macroeconomic realities feel brutally concrete. The atmosphere carries a calm yet urgent gravity as he dismantles mainstream assumptions about green growth and dematerialized services, leaving listeners with an unsettling clarity about the physical boundaries governing the modern world.
## Bulletin - [06:50](https://www.youtube.com/watch?v=wGt4XwBbCvA&t=410s) Energy is fundamentally a physical measure of environmental transformation rather than a monetary line item, meaning machines provide roughly 200 times the mechanical power of global human labor. - [36:28](https://www.youtube.com/watch?v=wGt4XwBbCvA&t=2188s) GDP growth is strictly coupled to primary energy consumption at the planetary level, rendering promises of perpetual economic growth and full employment impossible under energy contraction. - [48:45](https://www.youtube.com/watch?v=wGt4XwBbCvA&t=2925s) European fossil fuel supplies peaked between 2000 and 2006, directly driving regional economic stagnation, structural unemployment, and geopolitical friction such as Brexit. - [01:01:06](https://www.youtube.com/watch?v=wGt4XwBbCvA&t=3666s) Adhering to the IPCC 2°C climate target requires dividing global fossil fuel consumption by three within roughly 35 years, implying an unavoidable voluntary reduction in physical economic output and material consumption.
## Key takeaways - [00:03](https://www.youtube.com/watch?v=wGt4XwBbCvA&t=3s) Political promises and frameworks like the UN Sustainable Development Goals are mutually incompatible because they ignore the physical constraints of physics and thermodynamics. - [02:32](https://www.youtube.com/watch?v=wGt4XwBbCvA&t=152s) Treating energy as negligible because it represents only a small percentage of GDP is an economic fallacy akin to ignoring the human brain because it accounts for 2% of body weight. - [06:50](https://www.youtube.com/watch?v=wGt4XwBbCvA&t=410s) Under the first law of thermodynamics, humans cannot create energy; consuming energy strictly means operating machines that transform natural resources into goods and services. - [13:58](https://www.youtube.com/watch?v=wGt4XwBbCvA&t=838s) Fossil fuels outcompeted human labor and slavery because machines perform equivalent physical work for ten to one hundred times less cost than human wages. - [19:17](https://www.youtube.com/watch?v=wGt4XwBbCvA&t=1157s) Renewable energy sources are diffuse and intermittent, requiring extensive storage and capital that prevent them from supporting modern consumer standards for seven billion people. - [22:46](https://www.youtube.com/watch?v=wGt4XwBbCvA&t=1366s) Historical energy transitions have stacked new primary energy sources on top of legacy ones rather than replacing them, leaving modern civilization 80% reliant on fossil fuels. - [27:41](https://www.youtube.com/watch?v=wGt4XwBbCvA&t=1661s) Classical economics errs by following Jean-Baptiste Say's assumption that nature is infinite and free, modeling production purely on labor and capital while ignoring natural resource bottlenecks. - [36:28](https://www.youtube.com/watch?v=wGt4XwBbCvA&t=2188s) Energy consumption and GDP exhibit a direct linear correlation across history, with Granger causality showing that energy throughput drives economic output. - [42:17](https://www.youtube.com/watch?v=wGt4XwBbCvA&t=2537s) Human jobs in modern economies exist primarily to steer machines; contracting the energy available to machines reduces GDP and destroys employment rather than revitalizing manual labor. - [52:03](https://www.youtube.com/watch?v=wGt4XwBbCvA&t=3123s) European physical indicators—including industrial production, construction, and freight volume—peaked around 2007 following constraints in regional oil and natural gas supplies. - [55:47](https://www.youtube.com/watch?v=wGt4XwBbCvA&t=3347s) Under thermodynamic limits on energy efficiency, maintaining employment while energy supply contracts requires stabilizing or reducing individual real wages. - [01:01:06](https://www.youtube.com/watch?v=wGt4XwBbCvA&t=3666s) The 1.5°C climate warming threshold is physically unattainable, and staying below 2°C requires contracting global energy supply by 3% to 4% annually. - [01:10:45](https://www.youtube.com/watch?v=wGt4XwBbCvA&t=4245s) GDP accounts solely for annual transaction flows while ignoring the rapid liquidation and depletion of finite planetary natural capital. - [01:16:48](https://www.youtube.com/watch?v=wGt4XwBbCvA&t=4608s) The idea of a dematerialized service economy is an illusion, as digital networks and modern services depend heavily on physical hardware, industrial manufacturing, and high per capita energy consumption. - [01:20:51](https://www.youtube.com/watch?v=wGt4XwBbCvA&t=4851s) Apparent decoupling between GDP and domestic energy in open economies like Denmark occurs because cross-border trade shifts fuel combustion outside domestic reporting boundaries.
## Detailed walkthrough ### [00:03](https://www.youtube.com/watch?v=wGt4XwBbCvA&t=3s) Introduction: Connecting Economics and Physics
Jean-Marc Jancovici opens his lecture at the École Normale Supérieure (ENS) by noting that he was given total freedom to choose his topic. He chose to focus on a theme he considers severely neglected by modern analysis: the fundamental link between economics and physics. He warns the audience about the uncomfortable nature of this perspective: “What I'm going at—the conclusion to which I am going to draw you in, in a way, is that when you put physics into economics, you come up with results that are not very easy to sell in an election.”
He contrasts this physical reality with conventional political rhetoric, which promises that society can accomplish every goal simultaneously without any trade-offs. As an example, he points to the United Nations, an institution supposedly dedicated to serious matters, and its 17 Sustainable Development Goals (SDGs). Jancovici describes the vision created by stacking all 17 goals together as an absolute fairy tale: “If you pile them one on top of the other, it's close to Alice in Wonderland.” Under that narrative, every conceivable group is satisfied at once—economists, doctors, educators, feminists, water drinkers, city mayors, industrial leaders, consumers, and environmentalists alike. Jancovici equates this universal reassurance to a standard pre-electoral slogan: “Vote for me and I'm going to bring you happiness, whoever you are, whatever your goal is.”
Jancovici punctures this fantasy immediately: “The short answer is no, so we can all go out and have a drink.” However, to give the longer, substantive explanation, he turns to the concept of energy.
[02:32](https://www.youtube.com/watch?v=wGt4XwBbCvA&t=152s) The Misconception of Energy as Just a Bill
Jancovici highlights the widespread misunderstanding of what energy actually is, pointing out that France has had a dedicated minister in charge of energy matters for a very long time. Despite this institutional focus, he offers to wager with anyone in the lecture hall: “I'm ready to bet with about anybody in the room that if I asked to the minister in charge what is energy exactly, I will get anything but the right answer.” In a democracy, both the minister and the general public share the same everyday misconception, viewing energy merely as a financial bill—an expense paid for electricity, residential natural gas heating, or gasoline at the fuel pump.
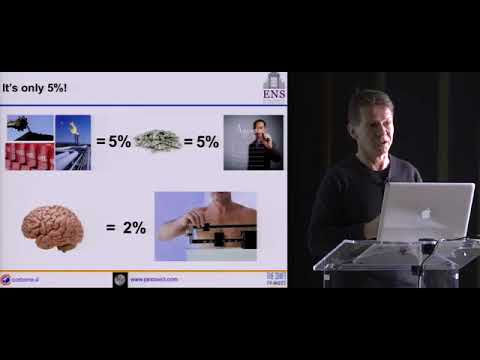
Jancovici argues that reducing energy to a bill means adopting the flawed worldview of mainstream economists. Looking purely at monetary expense reveals why conventional economics ignores energy: it represents an almost negligible fraction of total spending. Except during historical oil shocks, global spending on primary energy sources—oil, gas, and coal (which itself generates roughly 65% of global electricity)—accounts for only a couple of percent of total revenues.
In everyday life, housing absorbs one-third of average revenue in France, while food accounts for around 10% (down from three or four times that level historically). In fact, the average person spends roughly the same small amount of money on calling a friend to say they will be late as they spend on energy. Because energy is such a tiny monetary line item, the mindset of *Homo economicus* naturally assumes it deserves very little attention:
- Energy expenses represent only a couple percent of global revenues. - Housing takes approximately 33% of household income in France. - Food takes about 10% of income. - Telecom expenses (phoning friends) roughly match the fraction spent directly on energy.
Under this logic, economic planners assume they can dedicate 2% of their time to energy, assign a minister to handle it without fuss—or as Charles de Gaulle famously phrased it, *l'intendance suivra* ("the supply lines will follow")—and spend the remaining 98% on "serious" matters like jobs, politics, and pensions.
```mermaid flowchart TD accTitle: The Economic Fallacy of Treating Energy by Monetary Weight accDescr: Diagram contrasting the flawed economic view that equates energy importance to its 2% monetary share with the biological reality of vital 2% subsystems like the brain. subgraph EconomicView["Economic Thinking (Homo economicus)"] A["Energy = ~2% of Total Spending"] --> B["Allocate ~2% of Attention & Policy"] B --> C["Assume Rest of Economy Runs Independently"] end subgraph BiologicalAnalogy["The Physical Reality (Coupled System)"] D["Human Brain = ~2% of Body Weight"] --> E["Cutting Half the Brain (-1% Weight)"] E --> F["Destroys the Entire Organism, Not 1% of Function"] end ```
Jancovici illustrates the absurdity of this economic assumption with a biological parallel: saying energy is negligible because it represents 2% of expenditures is as senseless as claiming that because the human brain accounts for 2% of body weight, one can care for the brain 2% of the time, delegate it away, and ignore it the rest of the day. The human body is a tightly coupled system; removing half the brain does not merely reduce body weight and physical capacity by 1%—it destroys the entire organism. Energy plays the exact same vital role in human society: its actual physical importance has nothing to do with what it costs.
[06:50](https://www.youtube.com/watch?v=wGt4XwBbCvA&t=410s) Energy as the Physical Measure of Change and Machines as Converters
Jancovici turns to another common reflex: assuming energy is fundamentally something to be saved. He refutes this idea, explaining that society's current standard of living exists precisely because humanity did not save energy over the past two centuries. Without the massive consumption of energy driving modern machines, humanity would consist of 500 million peasants working the land, and the lecture hall would not be filled with students who have the leisure to listen to lectures instead of spending their days growing potatoes.
Moving away from economic definitions, Jancovici observes that the definition given by a poet—feeling full of energy on a great morning—is actually the closest to scientific truth. In physics, energy is defined as the measure of change in an environment:
> “Energy is by definition in physics what quantifies change. So if you are packed up with energy, you are packed up with the ability to change your environment, and that is you are packed up with the ability to master your destiny.”
By the first law of thermodynamics (the conservation of energy), humans cannot actually "produce" energy; they can only extract existing primary energy from the environment—such as oil, gas, coal, biomass, waterfalls, or wind—and channel it through a converter to generate useful work.
Historically, humanity relied solely on chemical energy in the form of food (such as hunting a mammoth), using the human body as the only available converter to maintain internal temperature at 37 °C and move around to secure more sustenance. Modern civilization was transformed when thinkers like Nicolas Léonard Sadi Carnot helped society develop mechanical converters: machines.
Jancovici stresses that humans do not literally consume primary energy directly: - Nobody drinks crude oil. - Nobody breathes natural gas. - Nobody eats coal.
Consuming energy really means operating machines that transform external primary energy into physical transformations of the physical world. Therefore, saying humanity uses more and more energy simply means society is deploying more and more machines to reshape the environment. The physical output of these machine converters vastly exceeds what the human body can deliver through muscular effort alone. To demonstrate this massive difference, Jancovici sets up a calculation based on mountain climbing: an individual weighing 80 kilograms with a 10-kilogram pack climbing the stairs of the Eiffel Tower 6.5 times before breakfast.
[11:50](https://www.youtube.com/watch?v=wGt4XwBbCvA&t=710s) The Physical Ridiculousness of Human Muscle Power
Using the elementary high school physics formula for potential energy, $E = mgh$, Jean-Marc Jancovici demonstrates the minuscule mechanical energy output of the human body. If a person uses their legs to make a massive, day-long physical effort—such as climbing 2,000 meters up a mountain—the total mechanical work produced amounts to a mere half kilowatt-hour (0.5 kWh). If that effort is sustained regularly, such as climbing roughly 1,000 meters every day or every two days, an individual can deliver around 100 kWh of mechanical energy over the course of an entire year.
If one tries to work with their arms instead, such as by shoveling dirt, the result is ten times worse: arms can only deliver about 0.05 kWh of mechanical work across a year. Jancovici highlights how utterly tiny this human physical capacity is when contrasted with fossil energy. A single liter of gasoline holds about 10 kWh of thermal energy. Even after accounting for thermal engine losses via Carnot efficiency, an internal combustion engine extracts 2 to 4 kWh of net mechanical energy from that single liter. Consequently, just one liter of fuel encapsulates the transformative mechanical power of 10 to 100 days of grueling human manual labor.
```mermaid flowchart LR accTitle: Human Labor vs Gasoline Mechanical Energy accDescr: Comparison of annual human arm and leg mechanical output against a single liter of gasoline. subgraph Human["Human Mechanical Output"] Arms["Arms Shoveling (1 Year)<br/>~0.05 kWh"] Legs["Legs Climbing (1 Year)<br/>~100 kWh"] LegDay["Peak Daily Leg Climb (2,000 m)<br/>~0.5 kWh"] end subgraph Fuel["Fossil Fuel Equivalent"] Gas["1 Liter of Gasoline<br/>10 kWh thermal"] Engine["Internal Combustion Engine<br/>(Carnot efficiency yield)"] Mech["2 to 4 kWh Mechanical Work<br/>= 10 to 100 Days of Hard Labor"] Gas --> Engine --> Mech end ```
- A hard day of leg climbing (2,000 meters) yields roughly 0.5 kWh of mechanical work. - An entire year of rigorous leg work delivers about 100 kWh. - Arm labor (shoveling earth) over a full year produces only 0.05 kWh. - Despite having a largely nuclear electrical grid, France consumes approximately 1,000 liters of gasoline per capita every year. - One liter of gasoline contains 10 kWh of thermal energy, converting to 2–4 kWh of usable mechanical work.
---
[13:58](https://www.youtube.com/watch?v=wGt4XwBbCvA&t=838s) The Economics of Substitution: Wage Labor, Slaves, and Machines
Translating this stark physical reality into financial terms explains modern economic history. Hiring a laborer at minimum wage to deliver one kilowatt-hour of physical work costs anywhere from several hundred to several thousand euros. In sharp contrast, a machine powered by fuel accomplishes the exact same physical transformation for a marginal cost of approximately 10 cents, leaving out the capital cost of the machine itself. By substituting human muscle with engines, civilization divided the cost of physical tasks—such as pouring concrete, erecting a square meter of housing, transporting freight, manufacturing furniture, or harvesting crops—by a factor of several hundred to several thousand. Jancovici insists that modern living standards, research budgets, and real wages did not surge because managers became benevolent, but entirely because machines scaled physical productivity for two centuries.
Jancovici then turns to the institution of slavery. Even if a slave is not paid a wage, the master must incur heavy expenses: capturing them against their will, clothing and feeding them, preventing them from escaping, and guarding against revolt (“prevent him from slaughtering you, if you have seen *Django*, etc.”). When tallying the overhead of maintaining human bondage, a slave still costs 10 to 100 times more than an engine. Jancovici argues that slavery was phased out across the developed world not because human morality suddenly evolved, but because fossil-powered machinery made slave labor economically obsolete and absurdly inefficient. As Jancovici points out:
> “The difference is that it doesn't make any sense to bother with slaves that want to slaughter you and flee when the machine that doesn't have all these inconvenience and can work all day around or all year round and all day around for ten to a hundred times less money.”
---
[17:05](https://www.youtube.com/watch?v=wGt4XwBbCvA&t=1025s) The Free Nature of Natural Resources and the Flaw of Economics
Jancovici brings up an image of crude oil, professing his admiration for it: “This is oil. It's pretty, no? No, it's beautiful. I like oil, actually.” Petroleum is the product of oceanic microorganisms that lived 10 to 500 million years ago. Upon dying, these carbon-rich organisms accumulated on the sea floor, mingled with mineral sediments and dust, were buried deep underground by plate tectonics, and were cooked over millions of years by geothermal heat in an anoxic environment. This natural distillation turned sediments into rock and formed subterranean oil reservoirs.
The crux of the matter is that humanity never paid a single cent for any of that immense geological preparation. By foundational convention, the economic system treats all primary natural resources—sunlight, wind, oil, coal, natural gas, wood, and metal ores—as completely free gifts of nature. In standard economics, price reflects only human extraction labor, equipment, and capital returns to shareholders, ignoring the depletion of the asset itself. Jancovici cautions that any private enterprise operating on the assumption that its underlying capital inventory is free would immediately go bankrupt, which is precisely the trajectory of the modern planetary economy:
> “The things without which we wouldn't be on this earth are free by convention in the economic system; it's a major flaw, it's a major flaw.”
---
[19:17](https://www.youtube.com/watch?v=wGt4XwBbCvA&t=1157s) Physics vs. Renewables: The High Cost of Dilute Energy
Because natural fossil stocks were prepared, concentrated, and pressurized by nature free of charge, history saw humanity shift *from* renewables *to* fossil fuels, not the reverse. To illustrate why, Jancovici compares wind energy to oil. Consider a volume of air roughly the size of the lecture hall—a 10-meter cube—blowing through a wind turbine at 80 km/h. At a 40% conversion efficiency, the entire kinetic energy captured from that volume equals a microscopic 3 milliliters of crude oil.
Furthermore, wind is intermittent and diffuse: “On the left, the train leaves the station when there is wind. On the right, the train leaves the station when you have decided that the train is going to leave the station.” Concentrating and storing diffuse ambient energy requires vast quantities of human labor and material capital, raising the cost per kilowatt-hour to 20 to 50 cents once storage is included, compared to a fraction of a cent for oil, whose storage is inherently built in. Jancovici dismisses as pure fantasy the idea that 7 billion people can sustain today's Western consumer lifestyle—two cars per household, 40 square meters of climate-controlled space per person, and grocery stores stocked with global goods—solely on renewables. While a fully renewable world supported 500 million people two centuries ago, retaining present-day consumption on renewables alone is physically impossible. As Jancovici puts it:
> “I don't believe a single second that we are going to remit to keep the standard of living that we have today on earth with seven billion people and just renewables; you can just forget that, it will never happen, never.”
```mermaid flowchart TD accTitle: Oil vs Wind Energy Density and Costs accDescr: Physical comparison between highly concentrated oil and diffuse wind power. subgraph WindPower["Wind Energy (Diffuse & Intermittent)"] AirVol["1,000 m³ air at 80 km/h (40% turbine yield)"] AirOutput["Energy yield = 3 mL of oil equivalent"] WindCost["High capital, storage & labor overhead:<br/>20–50 cents/kWh stored"] AirVol --> AirOutput --> WindCost end subgraph OilPower["Crude Oil (Dense & Dispatchable)"] GeoPrep["Millions of years of geological concentration (Free)"] OilOutput["Liquid, extremely dense, dispatchable on demand"] OilCost["Low marginal extraction cost:<br/>Fraction of a cent/kWh (storage included)"] GeoPrep --> OilOutput --> OilCost end ```
---
[22:46](https://www.youtube.com/watch?v=wGt4XwBbCvA&t=1366s) The Stacking of Energy Converters
Examining long-term historical trends, Jancovici clarifies that humanity has never actually substituted one energy source for another; instead, it has systematically piled newer, higher-grade energy sources on top of existing ones. Every newly tapped resource introduced superior physical properties and dedicated converters. Humanity moved from wood to coal, and then from coal to oil, because crude oil represents an unrivaled energy carrier: it is an exceptionally energy-dense liquid that can be transported and stored at ambient temperatures with minimal effort, powering compact internal combustion engines that can be mass-produced cheaply by the millions. Historical charts of global energy consumption per capita over the past 150 years do not show transitions away from fuels, but rather an unrelenting accumulation of machines driven by increasingly concentrated energy supplies.
[23:51](https://www.youtube.com/watch?v=wGt4XwBbCvA&t=1431s) The Energy Mix, Coal Realities, and Mechanical Slaves
Historical energy consumption shows a stacking pattern: on top of wood, whose use slowly declined, humanity added coal. Today, two-thirds of all coal mined is consumed to generate electricity. Across the planet, roughly 2,000 gigawatts of coal-fired power plants are in operation. To remain within the 2°C global warming threshold, all 2,000 gigawatts must be decommissioned within the next 35 years—before the youngest students attending the lecture reach Jean-Marc Jancovici's age. On top of coal, humanity subsequently stacked oil for mobility, natural gas, hydroelectricity, nuclear power, and finally "new renewables" (wind, solar, tidal, geothermal, biogas, and marine currents).
Despite popular belief that new renewables can seamlessly replace the fossil fuel foundation while preserving existing living standards and low energy prices, Jancovici sharply dismisses this expectation:
> “The reality today is that 80% of the energy we use on earth is fossil fuels.”
Furthermore, coal has accounted for the largest absolute increase in global electricity generation over the past decade.
```mermaid flowchart TD accTitle: Primary Energy Historical Stacking accDescr: Sequential layers of energy sources stacked on top of wood throughout industrial history. subgraph Stacking["Global Energy Layers"] Wood["Traditional Wood"] --> Coal["Coal (2/3 for electricity; 2,000 GW)"] Coal --> Oil["Oil (Mobility)"] Oil --> Gas["Natural Gas"] Gas --> HydroNuclear["Hydroelectricity & Nuclear"] HydroNuclear --> Renewables["New Renewables (Solar, Wind, Biogas, etc.)"] end ```
The underlying reason society resists decreasing its primary energy consumption lies in human biomechanics. A healthy human body can deliver roughly 100 kilowatt-hours of mechanical work per year using legs, and ten times less using arms. Dividing the current average global energy consumption of 20,000 kilowatt-hours per capita per year by this metabolic output yields an equivalent of 200 "mechanical slaves" per human being. Without fossil fuels, achieving identical living standards would require an imaginary exoplanet populated by 1,400 billion people constantly pedaling to supply mechanical energy. In France, an individual earning the minimum wage commands the physical work equivalent of 500 to 600 mechanical slaves, while members of the wealthier classes—such as the academics and researchers in the room—command well over 1,000:
> “All these machines combined together they represent the equivalent of 1,000 slaves working all year round for you that's the physical reality of a modern world brought by this and now you understand that when we want to get rid of all this in the name of preserving a stable climate system about everybody says yes but no.”
- Total global coal power capacity: 2,000 GW, required to phase out in 35 years to meet climate targets. - World energy mix: fossil fuels account for 80% of total primary supply. - Work capacity: 1 human year of manual labor = ~100 kWh of mechanical work. - Global per capita energy: 20,000 kWh/year = 200 mechanical slaves per human. - France distribution: 500–600 mechanical slaves for a minimum-wage worker; >1,000 for upper-income and academic demographics.
---
[27:41](https://www.youtube.com/watch?v=wGt4XwBbCvA&t=1661s) The Flawed Economic Foundations: Jean-Baptiste Say vs. Physical Reality
The widespread conviction that continuous economic growth can coexist with drastic emissions cuts stems from early classical economics. Two centuries ago, French economist Jean-Baptiste Say established foundational principles in his work *Traité d'économie politique*, asserting that natural resources are by convention free. Say's initial assumption was an acceptable first-order approximation for his era: global population stood at only 500 million, life expectancy at birth was 25 years, and per capita output was low. If society needed firewood to heat cities or iron ore to forge primitive tools, the physical availability of trees and ore was not the limiting factor. The only constraint was procuring laborers to fell trees, mine ore, and transport materials to Paris.
Because nature appeared virtually boundless, classical theory modeled the depletion of natural stocks as zero, effectively treating nature mathematically as an infinite reservoir:
> “So he says depletion of natural stocks is zero two centuries be after we've gone from half a billion to 7 billion we've increased the individual consumption by anything between thirty to a hundred and we still consider that the first order approximation is nature is zero of course it's not valid but thinking like this has led to modern economics which reason this way.”
Modern macroeconomic frameworks preserve this blind spot by considering only two exogenous factors of production: labor and capital. In these models, labor and capital interact to generate GDP, which then fills the supermarket shelves. Energy is treated endogenously as a simple consumer commodity purchased only after GDP is realized. Jancovici points out that even the climate community falls into this circular logic:
> “I mean physicist has spent decades setting up models that try to represent correctly the reality or that account correctly for the physical reality of the climate system and you feed these models with hypotheses that are totally I mean out of the real world totally out of the real world.”
- World conditions during Say's era: ~500 million people, ~25-year life expectancy at birth. - Modern expansion: population reached >7 billion; per capita resource consumption grew by a factor of 30 to 100. - Standard economic theory treats capital and labor as exogenous drivers, and energy as a mere endogenous byproduct/commodity.
---
[31:59](https://www.youtube.com/watch?v=wGt4XwBbCvA&t=1919s) Charles Dupin and the Physical Bottleneck of Energy
Jancovici argues that economics took the wrong turn by following Say instead of Charles Dupin, a French mathematician and engineer from École Polytechnique. In 1827, Dupin evaluated France's productive forces by calculating the mechanical labor equivalent of the population alongside non-human power sources. Dupin weighted adult men, women (counted as one-half), and children (counted as one-third or one-fourth) to establish a baseline human labor force. He then added the biological muscle power of draft animals, demonstrating that livestock contributed four times the mechanical force of all working humans in French agriculture. Extending this method to industry, Dupin incorporated watermills and windmills, recognizing early on that economic output is governed by men working alongside machines.
From a biophysical standpoint, raw materials and primary energy dictate production. Goods cannot materialize in a supermarket without extracting atoms of copper and other elements from the periodic table:
> “So if nature are not created for us and for free the 92 elements of the table of Mendeleev we wouldn't have any scent of GDP but that's free okay so we need resources to transform and we need the ability to transform these resources namely human beings at the beginning and now machines and the food of their own that is energy which account for 200 if humanity accounts for one and there you see that the bottleneck which is going to have the importance of the first order is not do we have enough men but do we have enough energy that's the true bottleneck it's the only one to look at.”
```mermaid flowchart LR accTitle: Physical Flow of Production accDescr: Biophysical model where raw resources and energy feed machines and labor to produce capital and consumer goods. subgraph Inflows["Environmental Inflows"] NatRes["Natural Resources (Periodic Table Elements)"] Energy["Primary Energy (Machine Fuel)"] end
subgraph Transformation["Productive Engine"] Machines["Machines (200x)"] Labor["Human Labor (1x)"] end
subgraph Outflows["Physical Output"] CapitalGoods["Capital Goods (Durable: Buildings, Machines)"] ConsumerGoods["Consumer Goods (Rapidly Destroyed)"] end
NatRes --> Transformation Energy --> Machines Labor --> Transformation Transformation --> ConsumerGoods Transformation --> CapitalGoods CapitalGoods -.->|"Internal Feedback Loop"| Machines ```
In this framework, capital does not act as an independent primary factor; it is an internal feedback loop. Manufacturing capital goods (like industrial machinery or office buildings) requires the exact same physical transformation of environmental resources via machines and human guidance as making ordinary consumer items (like eyeglasses). The distinction is operational: consumer goods are consumed rapidly, whereas capital goods endure to assist future production. Consequently, if energy inflows contract—whether through resource depletion or deliberate emissions mitigation policies—the mechanical work delivered by machines falls, inevitably forcing a contraction in physical production.
[36:28](https://www.youtube.com/watch?v=wGt4XwBbCvA&t=2188s) The Energy–GDP Linear Model and the Myth of Price Elasticity
Jancovici argues that on a macroeconomic level, the most accurate model relating energy consumption to economic production is not complex econometrics, but a straightforward linear correlation. On the horizontal axis lies energy—which physically represents the aggregate work done by machines—and on the vertical axis is the total economic counterpart of these transformed physical flows: gross domestic product (GDP). Because machines are collectively several hundred times more powerful than human muscle, production scales with machine capacity rather than monetary abstraction.
```mermaid flowchart LR accTitle: Physical Machine Flow to GDP Correlation accDescr: Physical energy feeds machines to transform resources into economic value. A["Energy Supply (Machine Fuel)"] --> B["Machines at Work"] B --> C["Transformation of Physical Matter"] C --> D["Economic Output (GDP)"] ```
Addressing economists in the audience, Jancovici disputes the conventional concept of long-term price-volume elasticity for commodities like oil. Standard economic theory posits that an increase in supply lowers the price, while scarcity raises it. However, a historical scatter plot of global crude oil production against nominal barrel prices from 1921 through 2015 shows no such continuous, bijective relationship. Instead, the data reveals distinct, orthogonal inelastic regimes: phases where volume expands dramatically while price remains static, followed by phases where prices fluctuate violently around an almost fixed output ceiling.
> “So anybody who is using—and I know economists that do use an elasticity, a long-term elasticity, because you have a short-term elasticity, but a long-term elasticity between prices and volumes regarding energy or actually any commodity in a model—is bound to give you a result which is false, because there is no such relationship.”
- The global macroeconomic relationship between energy and GDP is represented as a direct straight line. - The historical oil price vs. volume dataset spans from 1921 to 2015 (excluding pre-1921 points for visual clarity). - Historical dynamics show step-like regime shifts rather than a smooth price-elastic curve.
---
[39:34](https://www.youtube.com/watch?v=wGt4XwBbCvA&t=2374s) Men Directing Machines: The Enormous Disparity in Physical Power
Modern production is fundamentally misunderstood when framed as humans aided by tools. In reality, modern production consists of powerful machines directed by humans. The tractor driver does not plow the soil; the tractor plows the soil while the driver merely supplies guidance and control. If the human driver is replaced by autonomous software, production remains unchanged; but if the machine is removed and only the human remains, output collapses.
```mermaid flowchart TD accTitle: Contrast Between Human Work and Machine Substitution accDescr: Replacing drivers with software preserves output, whereas losing machines drops output sharply. subgraph Machine Dominant M1["Tractor + Software"] --> P1["Full Agricultural Output"] end subgraph Labor Substitution Failure M2["300 Men with Hand Tools"] --> P2["Exorbitant Cost / Inefficient Output"] end ```
The physical scale difference between human muscles and powered industrial machinery is massive: - A standard agricultural tractor exerts mechanical power equivalent to roughly 600 pairs of human legs. - Heavy public works machinery provides the mechanical equivalent of roughly 1,000 pairs of human arms. - A modern train operates with the motive power of 100,000 pairs of human legs (or roughly 100 times the legs of all passengers on board combined). - Commercial airplanes operate an order of magnitude higher in power density because they must overcome gravity to achieve lift. - A single modern steel mill, operated by a single technician at a console, would require the entire population of Île-de-France swinging manual hammers all day to match its physical throughput.
Jancovici points out that this immense mechanical leverage is the sole reason high-rise buildings like those in La Défense can be constructed in a single year, whereas medieval cathedrals like Notre-Dame de Paris required an entire century of muscle labor. He remarks that “cheap housing is machines; no machines, no cheap housing—very simple,” noting that the very existence of a modern bourgeois lifestyle is a direct consequence of cheap surplus energy.
---
[42:17](https://www.youtube.com/watch?v=wGt4XwBbCvA&t=2537s) Why Energy Contraction Destroys Employment Rather Than Creating Jobs
A common misconception is that if energy becomes scarce, economies will simply substitute human labor for machines, thereby solving unemployment. Jancovici calls this “a wrong answer.” Because a single machine performs the physical work of hundreds of laborers while costing only the equivalent of a couple of workers' wages, direct economic substitution is impossible. If energy constraints take half of a fleet of machines offline, replacing their output with hundreds of human workers would make production prohibitively expensive.
Consequently, when energy contracts, the high-productivity capital base shrinks, causing aggregate GDP to fall. Because human jobs in an industrialized economy exist primarily to steer, maintain, and support machines, a reduction in machine throughput leads directly to widespread job destruction rather than a surge in manual employment.
> “With the tremendous difference between the productivity of a machine and the productivity of men, what we do today if we contract the energy supply in the first order is that we are going to contract at the same time the GDP and the job.”
---
[43:58](https://www.youtube.com/watch?v=wGt4XwBbCvA&t=2638s) Case Studies in Energy Peak and Economic Contraction: Spain, Greece, and Portugal
Jancovici presents national empirical data from Southern Europe to validate this physical mechanism. Spain's primary energy supply peaked in 2007, an event driven by the 2006 global peak in conventional crude oil extraction (excluding unconventional shale oil and oil sands). While media attention focused daily on new wind turbine installations, the drop in Spain's oil-dominated energy base went largely unnoticed.
| Country | Primary Energy Peak / Plateau | Economic Consequence | Metric Observed | |:--- |:--- |:--- |:--- | | **Spain** | Peaked in 2007 (following 2006 conventional oil peak) | Protracted drop in employment ratio and GDP; minor rebound matching 2014 energy uptick | Employment-to-population ratio (age 15+) | | **Greece** | Contracted sharply post-2006 | Sustained collapse in employment and national GDP | Energy supply contraction vs. debt crisis | | **Portugal** | Plateaued around 2002–2003 | Stagnant overall job count and gradual decline in employment-to-population ratio | Flatlining machine energy flows |
To assess labor realities accurately, Jancovici rejects standard headline unemployment statistics in favor of the physical employment-to-population ratio (the percentage of the population aged 15 and older currently working). Unemployment rates can be manipulated by discouraging job seekers, moving people into training programs, or redefining labor force participation—noting wryly that about half of the reported reduction in US unemployment was achieved simply because discouraged individuals ceased looking for work.
In Spain, the employment-to-population ratio plunged along with the contraction of energy supplies in 2007 and remained far below pre-crisis levels despite claims of recovery. When Spanish energy consumption experienced a modest uptick in 2014, jobs and GDP followed in lockstep. The same direct coupling of energy consumption, employment, and GDP is evident in Greece following 2006, as well as Portugal's economic stagnation after its energy consumption plateaued around 2002–2003.
Jancovici concludes that political promises tied to sustained economic growth can be evaluated through a single parameter:
> “If you want to know whether electoral promises that depend on the GDP are going to be fulfilled or not, there is a single thing to do—not two, a single thing to do: look at the provisional supply of energy in the country. If it goes up, you can believe in the promises; if it goes down, just don't believe in the promises. It is as simple as this.”
Despite these physical constraints, policymakers continue to ignore energy fundamentals because energy ministries typically account for only a small percentage of direct budget spending. Jancovici laments that when he presents this thermodynamic reality to politicians, they treat him as though he were speaking Hebrew or simply insane.
[48:45](https://www.youtube.com/watch?v=wGt4XwBbCvA&t=2925s) The Depletion of European Fossil Fuel Supplies
When examining Europe at large, its energy supply is fundamentally rooted in fossil fuels, starting with oil. Europe’s oil availability is a combination of domestic production from the North Sea—which peaked in 2000—and global imports, which peaked in 2006. As a result, Europe's overall oil supply has dropped by 16 percent since 2006. Although production saw a brief rebound driven by soaring oil prices between 2008 and 2014—which catalyzed massive investments in upstream extraction—the system is now shifting into reverse. Crashing oil prices have led to slashed upstream capital expenditures, inevitably driving production back down.
Turning to natural gas, Jean-Marc Jancovici remarks that while most people instinctively think of Russia, 60 percent of Europe's gas historically came from the North Sea, which peaked in 2005. Gas imports remain essentially flat in volume because developing major gas infrastructure is a multi-decade affair: the Nord Stream pipeline required 30 years of development, while projects like South Stream never got off the ground before being abandoned. Even the hypothetical extraction of European shale gas would barely set an upper ceiling on supply rather than serve as a game-changer. Coal tells a similar story: long before it became a climate villain, domestic European coal production had already collapsed by a factor of three over three decades because Europe was the first continent to exploit its reserves. Today, European coal is nearly exhausted, leaving behind only low-quality German lignite, while importing coal requires massive, dedicated logistical networks of specialized harbors and rail systems that cannot simply materialize overnight. With domestic coal, oil, and gas peaked, and nuclear power having "peaked in the mind of people," Europe has boxed itself into a corner where renewable sources cannot physically replace the fossil base that built its economy.
> “So the oil supply in Europe has decreased by 16 percent since 2006 and the trend after a short rebound which is due to the tremendous increase in the price of oil between 2008 and 2014 which has triggered tremendous investments in the upstream part which has triggered a rebound in production now we are going to witness the exact reverse the exactly reverse process low prices of oil slashing in the upstream investment decreasing in the production of oil so this is going to go down again.” — Jean-Marc Jancovici
- **North Sea Oil:** Peaked in 2000; European crude imports peaked in 2006. - **European Oil Supply:** Contracted by 16% between 2006 and the lecture date. - **North Sea Natural Gas:** Supplied 60% of European gas before peaking in 2005. - **Coal Production:** Plunged by two-thirds over three decades due to natural resource exhaustion, leaving predominantly lignite in Germany. - **Nuclear and Renewables:** Nuclear is politically marginalized while alternative renewables cannot match the scale of the declining fossil complex.
---
[52:03](https://www.youtube.com/watch?v=wGt4XwBbCvA&t=3123s) Physical Indicators, Stagnation, and the Energy Origins of Brexit
The physical contraction of Europe's energy envelope directly mirrors its broader economic activity. Industrial production climbed steadily until 2007, fell sharply, and saw only a modest post-2014 rebound. The European construction index exhibits the exact same trajectory, passing its all-time high in annual square meters constructed in 2007 before slumping. Freight volume transported by trucks peaked in 2007, and the employment-to-population ratio followed suit, cushioned only slightly by the stabilizing size of Europe's public sector relative to the United States.
Examining per capita GDP growth over the past half-century shows three distinct epochs. Prior to the 1970s oil shocks, rapid growth in energy per capita yielded annual GDP per capita growth rates near 5 percent. Between the 1979 shock and the mid-2000s, per capita energy consumption leveled off, keeping the per capita machine count constant; economic expansion slowed to an average of roughly 2 percent per year, driven almost entirely by machine efficiency gains. Since Europe's 2007 energy peak, per capita GDP growth has ground to an effective halt. In an economic zone where total output is capped by energy, opening borders creates zero-sum friction: with Western European wages three to four times higher than Eastern European wages, free movement acts like an electrical potential difference, creating a current of workers—such as the proverbial "Polish plumber" moving to London—that depresses local wages in the west while boosting them in the east.
> “So the Brexit is a direct consequence of the fact that the energy supply has begun to decrease in Europe in 2006 and the economic convention believes that it's of no importance it's a conjunction of the two.” — Jean-Marc Jancovici
```mermaid flowchart TD accTitle: Physical Energy Limits to Economic and Political Shifts accDescr: Diagram illustrating how declining European energy inputs cap physical output and spark zero-sum wage friction that culminated in Brexit.
subgraph EnergySupply ["Physical Primary Energy Constraints"] A["European Fossil Fuels Peak (2000-2007)"] B["Net Energy Inflow Decreases (-1% / year)"] A --> B end
subgraph MacroIndicators ["Real Physical Economy (Peaks in 2007)"] C["Industrial Production Peak"] D["Building Construction Peak"] E["Road Truck Freight Peak"] B --> C B --> D B --> E end
subgraph EconomicConsequence ["Socio-Political Repercussions"] F["Zero-Growth Economic Envelope"] G["Western Wage Pressure & Zero-Sum Migration"] H["Political Backlash (e.g., Brexit)"] C & D & E --> F F --> G G --> H end ```
- **Pre-1973 Oil Shocks:** Per capita GDP grew at ~4–5% per year alongside accelerating primary energy supplies. - **1979–2005 Period:** Energy supply per capita flatlined; GDP per capita growth halved to an average of ~2% per year. - **Post-2007 Era:** Aggregate energy supply declined; per capita GDP growth plateaued. - **Zero-Sum Free Movement:** Western European wages were 3 to 4 times Eastern European wages, creating labor migration that suppressed UK wages in a non-expanding pie, directly stoking the political fires of Brexit.
---
[55:47](https://www.youtube.com/watch?v=wGt4XwBbCvA&t=3347s) The Job Equation: Physical Limits, Energy Efficiency, and Wages
To rigorously analyze how employment interacts with physical limits, Jancovici breaks down the volume of employment using a foundational identity: total jobs can be multiplied and divided by GDP, and again by energy. This breaks the labor market into three linked terms: the reverse of revenue per worker (Jobs/GDP), the energy efficiency of the economic system (GDP/Energy), and total primary Energy. The middle term, GDP per unit of energy, represents how much added monetary value can be extracted when transforming the natural environment by one kilowatt-hour—such as refining raw iron ore into a functional table fork. However, this term is rigidly bounded by physical laws, including Carnot efficiency limits in thermal heat engines and the stoicheometric chemical requirements of carbon atoms needed to reduce iron oxide ($\text{Fe}_2\text{O}_3$). Energy efficiency cannot be improved indefinitely.
Looking at Europe's actual balance sheet over the preceding decade, total primary energy supplies have shrunk by approximately 1 percent per year, while energy efficiency has improved by about 1.5 percent per year, leaving a net expansion margin of only 0.5 percent. Because European population grows at roughly 0.4 percent annually, sustaining a stable employment-to-population ratio requires all available surplus. In a world where mechanical power prescribes the size of the GDP cake, any demand for an increase in individual wages or revenue automatically shrinks the denominator of how many workers can be funded, directly creating unemployment elsewhere in the system. The talk then pivots to how this rigid physical reality collides head-on with the emissions reductions mandated by the Paris climate agreement.
> “So today to keep the number of jobs constant sorry the job to population ratio constant I must not grant any increase to people that work it is very simple it's not necessarily pleasant but it is very simple so every time somebody gets more money for his job he's creating a small unemployment somewhere because it doesn't work that if you have more people into the economy that work you have more GDP again it's going the other way around we're in excess of people that want to work today the limiting factor is the mechanical power and therefore the energy.” — Jean-Marc Jancovici
- **The Macroeconomic Identity:** $$\text{Jobs} = \left(\frac{\text{Jobs}}{\text{GDP}}\right) \times \left(\frac{\text{GDP}}{\text{Energy}}\right) \times \text{Energy}$$ - **$(\text{Jobs} / \text{GDP})$:** Inversely related to wages and revenues per employed worker; raising average compensation mechanically lowers the number of jobs accommodated by a fixed GDP. - **$(\text{GDP} / \text{Energy})$:** Energy efficiency, bounded by physical principles such as the Carnot cycle and reduction chemistry (e.g., carbon requirements for reducing iron oxide). - **Recent European Rates:** Primary energy supplies down ~1.0% per year; energy efficiency up ~1.5% per year; net growth margin of +0.5% per year. - **Population Dynamic:** European population expands at ~0.4% annually, leaving zero room for overall real wage gains without inducing job losses.
[01:01:06](https://www.youtube.com/watch?v=wGt4XwBbCvA&t=3666s) The IPCC Carbon Budget and the 2°C Objective
Jean-Marc Jancovici presents a slide sourced from the technical summary of the latest IPCC (Intergovernmental Panel on Climate Change / GIEC) report. He checks how many people in the room know or do not know what the IPCC is, reminding them that it is the United Nations body created in 1988 to assess peer-reviewed scientific literature and provide state-of-the-art knowledge on human impacts on the climate system.
```mermaid flowchart LR accTitle: Linear relation between cumulative emissions and temperature rise accDescr: Diagram showing historical cumulative emissions leading to current commitments and the strict cap required for 2 degrees Celsius. subgraph Past ["Pre-industrial to 2015"] A["Cumulative Emissions: ~2,000 Gt CO2e"] --> B["Committed Warming: > 1°C"] end subgraph Budget ["2°C Ceiling (Pre-industrial to 2100)"] C["Total Budget: ~3,000 Gt CO2e"] D["Remaining Budget: ~1,000 Gt CO2e"] C -.-> D end Past -->|"Leaves"| Budget ```
The graph displays a fundamentally linear relationship between accumulated greenhouse gas emissions since pre-industrial times (taken around 1850 or 1870) up to 2100 and the resulting global mean surface temperature increase. By the end of 2015, humanity had already accumulated roughly 2,000 gigatons of $\text{CO}_2$ equivalent, which commits the planet to well over one degree of warming. Jancovici bluntly dismisses the lower aspirational target from the Paris Agreement:
> “And as most probably all humanity is not going to die tomorrow and stop emitting tomorrow it means one third thing is that you can forget the 1.5 degree in is that was in the previous agreement this is about as sound as if I said when I'm 30 I'm going to do this nobody reacts okay I can say it if I want to okay it's of no practical use.”
If humanity aims to stay below the 2°C ceiling, the maximum allowable cumulative budget between pre-industrial times and 2100 is roughly 3,000 gigatons of $\text{CO}_2$ equivalent. Subtracting the 2,000 gigatons already emitted leaves a strict balance of roughly 1,000 gigatons. If emissions follow a continuous and differentiable path rather than an abrupt shutdown, staying within this budget requires dividing global emissions by a factor of three between today and the time his children reach his age.
[01:05:09](https://www.youtube.com/watch?v=wGt4XwBbCvA&t=3909s) The Physical Impossibility of Decoupling Growth from Contraction
Reconnecting this climate constraint to his core energy equation, Jancovici highlights that the vast majority of primary energy today comes from fossil fuels. Replacing fossil fuels one-for-one with nuclear power and renewables within the next 35 years is not strictly physically impossible, but it borders on it because the public acceptance requirements—such as having virtually the entire workforce redirect its efforts solely into that deployment program—are unrealistic.
Consequently, cutting fossil fuel consumption by three means dividing overall energy supply by nearly three as well. Compounding that requirement implies that the global energy supply must contract by between 3% and 4% each year. Historically, the energy intensity of GDP has fallen very slowly (less than 1% per year globally, and slightly above 1% in Europe), bounded firmly by the laws of thermodynamics (Carnot's theorem) despite major shocks like the 1970s oil crises. If energy availability contracts at 3–4% annually while global population continues to expand, sustaining traditional economic expansion is physically unviable:
> “If you want to say the climate people have to accept which is actually the economic counterpart of the fact that we are going to contract the physical flows and therefore contract production and therefore decrease the purchasing power that's what it means and it means also that then people must accept that what the earth is got going to increase you're after Europe but decrease you're after here sobriety in other word in other words is something that when you look at this simple rule of three translates in an obvious way into economics.”
- **Global energy reduction needed**: 3% to 4% per year continuously. - **Historical energy intensity improvements**: Under 1% globally per year. - **Economic implications**: Contraction of physical flows dictates a contraction of production, purchasing power, and standard consumer wages.
[01:08:04](https://www.youtube.com/watch?v=wGt4XwBbCvA&t=4084s) A Time of Choosing: The Blind Spot of Economics
Jancovici concludes his lecture by asserting that society has arrived at a fork in the road rather than an era where the United Nations Sustainable Development Goals can all be simultaneously achieved by a miracle. Society faces two coherent, mutually exclusive options. The first option is to let the "fireworks" continue for as long as they can—whether that is 5, 10, or 20 years—without regard for what happens afterward; while morally questionable, it possesses its own internal logic. The second logical path is to ensure humanity survives as long as possible under acceptable living conditions, which explicitly requires deliberately contracting the economy.
```mermaid flowchart TD accTitle: Society's two choices accDescr: Choice between continuing resource depletion until collapse or voluntarily contracting the physical economy. Choice["Time of Choosing"] --> PathA["Continue the Fireworks"] Choice --> PathB["Sustain Humanity Long-Term"] PathA --> ImpactA["Deplete resources for 5–20 years, disregard future collapse"] PathB --> ImpactB["Voluntarily contract the physical economy and accept sobriety"] ```
When this physical necessity is presented to mainstream economists, Jancovici observes that almost all of them treat the speaker as if they were mad. This divergence stems from the foundational doctrine laid down by Jean-Baptiste Say and his successors, who conceived of an economic framework devoid of physical limits:
> “And the reason why today in a way the the worst enemies preserving the environment are the economists it's because taking into account the physical limits that come from the environment would oblige them to throw away two centuries of accumulated thinking and go back to zero and they will never do that thank you.”
While physical theories explicitly define boundaries—such as knowing that traveling the circumference of the Earth returns you to the exact starting point after $\pi \times 12,000\text{ km}$—economic theories contain no mathematical ceiling halting GDP at an arbitrary dollar figure. Acknowledging ecological constraints would invalidate two centuries of traditional macroeconomic dogma.
[01:10:45](https://www.youtube.com/watch?v=wGt4XwBbCvA&t=4245s) Q&A: GDP as a Flow vs. Stock and the True Price of Nature
An audience member opens the question-and-answer period by acknowledging that the correlation between energy and GDP is convincing, but challenges the use of GDP as a metric for human well-being. The questioner points out that while per capita energy consumption has increased roughly fourfold over the last century or two, human quality of life seems to have increased by far more than a factor of four. He asks whether lifestyle changes, greater efficiency, and alternative choices could decouple high well-being from high energy throughput, sustaining quality of life with far less energy.
Jancovici responds that the question conflates distinct concepts, beginning with the accounting difference between flows and stocks: - **GDP is purely a flow metric**, measuring annual transactions, whereas real quality of life relies heavily on accumulated natural and physical **stocks**. - Historical GDP growth was achieved by systematically liquidating non-renewable natural capital: depleting marine fish populations, burning off fossil fuel deposits, and extracting high-grade mineral ores without recording any capital depreciation in standard national accounts.
To illustrate how poorly market pricing captures what nature provides, Jancovici cites the International Space Station (ISS). The ISS carries a total construction and operating price tag of approximately $100 billion—working out to roughly $15 billion per person for its crew of six. For that astronomical expenditure, all that technology achieves is: 1. Atmospheric pressure of 1 bar (supplied on Earth for free). 2. Breathable oxygen (supplied on Earth for free). 3. Zero gravity (whereas natural Earth gravity is supplied for free). 4. A rudimentary water recycling system where astronauts must re-drink treated urine. 5. Basic thermal insulation from the freezing space environment.
GDP only measures the frantic, expensive human industrial efforts to reproduce a sliver of the life-support services that Earth’s natural stock provides humanity at zero monetary cost.
[01:13:19](https://www.youtube.com/watch?v=wGt4XwBbCvA&t=4399s) Valuing the Earth vs. Burning Capital
Jean-Marc Jancovici extends his comparison between the Earth and the International Space Station (ISS) to illustrate how conventional economics systematically misprices natural resources. If keeping a handful of astronauts alive in the ISS costs billions, the Earth system can easily be priced at a bare minimum of $15 billion per capita, given that Earth freely provides soil to grow potatoes, oceans full of fish, breathable air, and self-regulating ecosystems that the ISS lacks entirely. Meanwhile, critical natural assets—arable land, forests, fish stocks, mineral ores, and fossil fuels—are depleting at rates generally exceeding 0.1% per year (fossil fuels deplete at roughly 1% annually).
Applying a conservative 0.1% annual amortization rate to an asset valued at $15 billion per capita yields a natural depreciation of at least $15 million per person each year. Against this, current global GDP per capita stands around $15,000—a full one thousand times smaller. Jancovici argues that treating the resulting economic activity as true wealth generation is an illusion:
> “So what we are doing right now, you say we're improving our standard of living, I say we're burning the capital.”
He likens modern society to an heir squandering their family inheritance at a casino roulette table to fund a temporary lifestyle high, or a company reporting profits while bleeding capital every single year. While humanity has physically expanded life expectancy, population size, and housing space, it has sacrificed long-term security. A member of the audience asks whether one could simply choose not to play the roulette, relax on the beach, and enjoy the sunset. Jancovici responds that choosing genuine ecological sobriety means accepting radical material limits—sharing living space and living with drastically less:
> “The equation today is if we want to last for longer we have to consume less, it's about this.”
- **Minimum estimated Earth asset value**: ≥ $15,000,000,000 per capita. - **Natural resource depletion rates**: Typically > 0.1% per year across critical stocks; ~1% per year for fossil fuels. - **Amortization of natural capital**: ≥ $15,000,000 per capita per year at a 0.1% degradation rate. - **Global GDP per capita**: ~$15,000 per year (a 1:1,000 mismatch compared to natural capital loss).
---
[01:16:48](https://www.youtube.com/watch?v=wGt4XwBbCvA&t=4608s) The Myth of Dematerialized Services
Jancovici addresses the claim that GDP can decouple from physical constraints through a shift toward a service-oriented economy. Far from being dematerialized, services are fundamentally anchored to physical flows of matter and energy. Transportation, categorized as a service, is notoriously energy-intensive. Information technology—another supposed pillar of the intangible economy—has a physical footprint so immense that manufacturing computers and network infrastructure annually consumes as much energy and resources as the entire global fleet of trucks. Across nations, plotting energy consumption per capita against the service share of economic output reveals a very strong positive correlation.
```mermaid flowchart TD accTitle: Coupling of Industrial Goods and Service Sectors accDescr: Diagram showing how physical manufacturing enables services like finance and insurance, while IT and banking reinforce industrial flows.
subgraph PhysicalBase["Physical & Industrial Base"] Cars["Automobile Manufacturing<br/>& Fleet Operations"] ITEquip["Hardware Manufacturing<br/>(Computers, Servers, Networks)"] end
subgraph ServiceSector["Coupled Services"] AutoServices["Auto Insurance,<br/>Bank Auto Loans, Driving Schools"] DigitalServices["Banking, Telecommunications,<br/>Software Logistics"] end
Cars -->|"Generates need for"| AutoServices DigitalServices -->|"Enables & optimizes"| Cars ITEquip -->|"Physical backbone of"| DigitalServices ```
Jancovici insists that modern services cannot exist as an autonomous layer detached from industrial machinery:
> “And another reason why is that in order to have large, a large fraction of services you need huge amounts of physical flows because otherwise you do not need these services.”
If a society manufactured only one car a year, entire accompanying service industries—auto insurance companies, auto loan desks at banks, driving schools, and roadside assistance—would vanish instantly. Conversely, if global digital infrastructure were unplugged tomorrow morning, industrial manufacturing and logistics would collapse, as modern banking itself is little more than computer operations. GDP was originally designed to count physical output like tables, chairs, and vehicles. When stripped of uncounted asset price inflation, it simply tracks the volume of physical transformations society can afford:
> “So the idea that dematerialized services replace material services is totally false when you look at the physical reality, actually most of the time they help the industrial sector to thrive.”
- **IT manufacturing impact**: Emits and consumes roughly as much annually as the entire global fleet of trucks. - **Services vs. energy correlation**: Higher domestic service-sector proportions correlate positively with elevated per capita energy use. - **Nature of GDP growth**: Much of the recorded growth over recent decades reflects asset inflation not properly captured in standard inflation discounting.
---
[01:20:51](https://www.youtube.com/watch?v=wGt4XwBbCvA&t=4851s) Denmark, Trade Boundaries, and Energy Efficiency
An audience member challenges Jancovici's linear GDP-energy link by pointing to Denmark, where GDP has doubled since the 1970s while domestic energy consumption remained flat. Jancovici explains that this apparent decoupling is an artifact of territorial accounting boundaries. Domestic energy statistics count only what is burned within Denmark’s borders, whereas Danish GDP captures corporate revenues generated across the globe.
> “When Maersk operates a boat that goes from Brazil to let's say South Africa, part of the revenues that come from operating this boat are located into Denmark, but the energy consumption that allows this revenue to exist is located outside Denmark.”
For small, open trading economies such as Denmark, Sweden, and Switzerland, money flows inward while the physical energy consumption driving those financial streams occurs offshore. In contrast, at the planetary scale, the relationship between energy and GDP remains strictly linear because the Earth does not trade with Mars—the physical and financial boundaries are perfectly identical.
```mermaid flowchart LR accTitle: Domestic Accounting vs Global Footprint in Open Economies accDescr: Flow diagram showing how corporate activities abroad funnel GDP into small nations while keeping energy consumption abroad.
subgraph GlobalOps["Global Operations (e.g., High Seas / Overseas)"] Fuel["Bunker Fuel / Energy<br/>(Combusted outside Denmark)"] Shipping["Maersk Vessel Route<br/>(e.g., Brazil to South Africa)"] Fuel --> Shipping end
subgraph DomesticDK["Domestic Denmark Accounting"] DK_Energy["Domestic Energy Stats<br/>(Flat / Decoupled)"] DK_GDP["National GDP<br/>(Boosted by Global Revenues)"] end
Shipping -->|"Repatriated profits"| DK_GDP ```
Jancovici notes that rapid economic shocks—such as those experienced by Spain, Portugal, and Greece—make the direct link between energy drops and GDP contractions immediately visible because trade patterns cannot rebalance overnight. Furthermore, the belief that economies naturally become more energy-efficient over time is empirically incorrect:
> “And in the non-OECD zone, the energy efficiency of the economy has changed by only 5% during the last 50 years—5% overall, not per year.”
While some advanced economies post apparent efficiency gains through offshoring, efficiency in countries like Spain, the Philippines, Thailand, Vietnam, and Turkey has degraded over past decades. As Jancovici finishes addressing the trade boundary issue, another attendee steps forward to ask a follow-up question regarding the energy-GDP curve presented for Spain.
[01:24:29](https://www.youtube.com/watch?v=wGt4XwBbCvA&t=5069s) The Direction of Causality Between Energy and GDP
An audience member raises a two-part question concerning the graph displayed during the presentation around the time of the 2008 financial crisis. First, they question the direction of causality between the decline in GDP and the decrease in energy consumption—asking whether the slowdown in economic activity caused the energy drop rather than the reverse. Second, they ask about the shape of the curve representing this relationship, pointing out that near the peak, the trajectory shows an unusual, counter-intuitive curving pattern.
Jean-Marc Jancovici resolves the question by dissecting the chronological sequence of the data points shown on the graph. The inflection point for energy occurs in 2007, whereas the maximum peak for GDP on the vertical axis appears in 2008. The visual impression of the curve "turning left" illustrates that energy availability slows down first, followed by the economic deceleration. Jancovici notes that plotting both energy and GDP as normalized time series makes this delay obvious: “If I had shown two curves, energy and GDP, both normalized, because I had that also, you will have seen that there is one year lag between the peak of the energy and the peak of GDP.”
```mermaid flowchart LR accTitle: Causality between Energy and GDP accDescr: Diagram illustrating the feedback loop between energy supply and GDP, highlighting energy as the primary driver.
subgraph PrimaryDriver["Primary Physical Driver"] E["Energy Supply<br/>(Peaks in 2007)"] M["Machine Power<br/>(~200x Human Labor)"] end
subgraph EconomicOutput["Economic Consequence"] GDP["Global GDP<br/>(Peaks in 2008, 1-yr lag)"] INV["Capital Investment"] end
E -->|"Powers"| M M -->|"Drives physical production"| GDP GDP -.->|"Reinvested to extract faster"| INV INV -.->|"Feedback loop"| E ```
Jancovici explains that while the economy functions as a coupled feedback system—higher energy availability enables more transportation and output, while higher GDP provides the financial capital to extract remaining energy deposits faster—the fundamental physical driver is energy. Statistical Granger causality tests demonstrate that energy consumption predominantly drives GDP growth over time. He underlines this with the core physical fact of modern civilization: human workers are augmented by machines with an aggregate power roughly 200 times greater than human muscle. He concludes the conference by emphasizing that: “With that 200 ratio between the power of machines and the power of men, you can easily understand that if you deprive machines of energy, you will deprive the GDP of part of what it was.”
- The inflection point where energy begins to plateau and drop occurred in 2007, while global GDP reached its pre-crisis peak in 2008. - A one-year lag exists between the peak in primary energy consumption and the corresponding contraction in GDP. - Granger causality testing confirms that energy drives GDP over time, rather than GDP autonomously driving energy consumption. - Because machines provide approximately 200 times the mechanical power of human bodies, throttling machine energy inputs inevitably forces a contraction in physical economic output.
## Notable quotes > [06:50](https://www.youtube.com/watch?v=wGt4XwBbCvA&t=410s) Energy is by definition in physics what quantifies change. So if you are packed up with energy, you are packed up with the ability to change your environment, and that is you are packed up with the ability to master your destiny. — Jean-Marc Jancovici
> [17:05](https://www.youtube.com/watch?v=wGt4XwBbCvA&t=1025s) The things without which we wouldn't be on this earth are free by convention in the economic system; it's a major flaw, it's a major flaw. — Jean-Marc Jancovici
> [01:16:48](https://www.youtube.com/watch?v=wGt4XwBbCvA&t=4608s) So the idea that dematerialized services replace material services is totally false when you look at the physical reality, actually most of the time they help the industrial sector to thrive. — Jean-Marc Jancovici
> [01:13:19](https://www.youtube.com/watch?v=wGt4XwBbCvA&t=4399s) The equation today is if we want to last for longer we have to consume less, it's about this. — Jean-Marc Jancovici
> [01:13:19](https://www.youtube.com/watch?v=wGt4XwBbCvA&t=4399s) So what we are doing right now, you say we're improving our standard of living, I say we're burning the capital. — Jean-Marc Jancovici
> [43:58](https://www.youtube.com/watch?v=wGt4XwBbCvA&t=2638s) If you want to know whether electoral promises that depend on the GDP are going to be fulfilled or not, there is a single thing to do—not two, a single thing to do: look at the provisional supply of energy in the country. — Jean-Marc Jancovici
> [42:17](https://www.youtube.com/watch?v=wGt4XwBbCvA&t=2537s) With the tremendous difference between the productivity of a machine and the productivity of men, what we do today if we contract the energy supply in the first order is that we are going to contract at the same time the GDP and the job. — Jean-Marc Jancovici
## Mentioned Jean-Marc Jancovici, École Normale Supérieure, United Nations, Charles de Gaulle, Nicolas Léonard Sadi Carnot, Eiffel Tower, Jean-Baptiste Say, Traité d'économie politique, Charles Dupin, École Polytechnique, Dmitri Mendeleev, La Défense, Notre-Dame de Paris, Spain, Greece, Portugal, North Sea, Nord Stream, South Stream, IPCC, International Space Station, Maersk, Denmark, Sweden, Switzerland, OECD, Granger causality
## Video description Jancovici's conference in ENS School of Paris - 08/01/2018
To download the Presentation : https://fr.slideshare.net/JoelleLeconte/jancovici-presentation-of-the-conference-can-we-save-energy-jobs-and-growth-at-the-same-time The depletion of natural resources, with oil to start with, and the need for a stable climate, will make it harder and harder to pursue economic growth as we know it. It has now become urgent to develop a new branch of economics which does not rely on the unrealistic assumption of a perpetual GDP increase. In this Colloquium, I will discuss a "physical" approach to economics which aims at understanding and managing the scaling back of our world economy. Biography : Jean-Marc Jancovici, is a French engineer who graduated from École Polytechnique and Télécom, and who specializes in energy-climate subjects. He is a consultant, teacher, lecturer, author of books and columnist. He is known for his outreach work on climate change and the energy crisis. He is co-founder of the organization "Carbone 4" and president of the think tank "The Shift Project".
Original video : https://www.youtube.com/watch?v=ey7_FwUeE6Q
Facebook page : https://www.facebook.com/jeanmarc.jancovici/ Website : https://jancovici.com/
[Source](https://www.youtube.com/watch?v=wGt4XwBbCvA)