Azul Fixes Java Pauses via Custom Silicon as Hardware TM Falls Short
Java on a 1000 Cores - Tales of Hardware / Software CoDesign — Google TechTalks

Google TechTalks

Hardware-assisted garbage collection read barriers successfully eliminate pause times across massive enterprise heaps, whereas hardware transactional memory fails to deliver real-world performance gains because application throughput is bottlenecked by data dependencies and I/O rather than lock contention.

AI-assisted summary of Java on a 1000 Cores - Tales of Hardware / Software CoDesign — original source. Check the original for full context.

Source published:

Key ideas

  • Azul Systems developed custom Vega RISC processors scaling up to 864 cache-coherent cores in a flat Uniform Memory Access (UMA) topology, explicitly rejecting NUMA due to the lack of spatial data locality in enterprise Java workloads. (0:00)
  • Hardware-assisted garbage collection read-barriers and custom user-mode trap vectors enabled concurrent, pauseless collection across heaps up to 600 GB with allocation rates of 35 GB/s, capping pause times to 10–15 milliseconds. (44:54)
  • Hardware transactional memory (HTM) for automatic lock elision yielded negligible real-world performance gains because enterprise bottlenecks were overwhelmingly dominated by I/O, databases, and serialization on shared counters. (10:21)
  • A specialized Cache Line Zero (CLZ) instruction eliminated read misses when allocating memory into uninitialized addresses, cutting memory bus bandwidth consumption by a measurable 30%. (12:00)

Detailed notes

## Background This talk was delivered by Dr. Cliff Click of Azul Systems, presented at a Google Tech Talk on August 12, 2009, and published by Google TechTalks on YouTube on September 8, 2009. The presentation focuses on the hardware and software co-design principles behind Azul's custom multicore systems, detailing how tailored silicon and runtime integration solved massive garbage collection pause times and scalability bottlenecks for enterprise Java applications.

## TL;DR Dr. Cliff Click outlines the design philosophy and technical evolution of Azul Systems' custom Vega processor architectures, which scaled up to 864 coherent RISC cores to execute massive enterprise Java workloads. He details key architectural innovations, including hardware-assisted read barriers, fast user-mode traps, cache-line zeroing, and a flat Uniform Memory Access (UMA) topology, which collectively enabled pauseless garbage collection across heaps spanning hundreds of gigabytes. The talk candidly covers early hardware bring-up disasters—such as severe silicon defects, third-party IP failures, and exploding power supplies—and contrasts these realities with industry experiments in hardware transactional memory. Click concludes by examining the practical performance tradeoffs between custom silicon and commodity x86 architectures, explaining why targeted runtime features in silicon consistently trump brute-force hardware complexity.

## Atmosphere & style The presentation carries the gritty, irreverent vibe of a seasoned systems veteran recounting war stories straight from the engineering trenches. Dr. Click speaks with rapid-fire enthusiasm, blending deep technical rigor with sharp, self-deprecating humor as he mocks broken silicon, third-party IP blunders, and vendor hesitation. Watching the talk feels like sitting in on an unfiltered, master-level postmortem where immense pride in genuine engineering triumphs stands shoulder-to-shoulder with candid admissions of what failed.

## Bulletin - [00:00](https://www.youtube.com/watch?v=5uljtqyBLxI&t=0s) Azul Systems developed custom Vega RISC processors scaling up to 864 cache-coherent cores in a flat Uniform Memory Access (UMA) topology, explicitly rejecting NUMA due to the lack of spatial data locality in enterprise Java workloads. - [44:54](https://www.youtube.com/watch?v=5uljtqyBLxI&t=2694s) Hardware-assisted garbage collection read-barriers and custom user-mode trap vectors enabled concurrent, pauseless collection across heaps up to 600 GB with allocation rates of 35 GB/s, capping pause times to 10–15 milliseconds. - [10:21](https://www.youtube.com/watch?v=5uljtqyBLxI&t=621s) Hardware transactional memory (HTM) for automatic lock elision yielded negligible real-world performance gains because enterprise bottlenecks were overwhelmingly dominated by I/O, databases, and serialization on shared counters. - [12:00](https://www.youtube.com/watch?v=5uljtqyBLxI&t=720s) A specialized Cache Line Zero (CLZ) instruction eliminated read misses when allocating memory into uninitialized addresses, cutting memory bus bandwidth consumption by a measurable 30%.

## Key takeaways - [00:00](https://www.youtube.com/watch?v=5uljtqyBLxI&t=0s) Enterprise Java business logic lacks predictable spatial locality, making NUMA architectures counterproductive and justifying a flat Uniform Memory Access (UMA) interconnect with memory hashed across controllers. - [06:01](https://www.youtube.com/watch?v=5uljtqyBLxI&t=361s) Uncontended synchronization speed is paramount, as over 99% of locks in real-world Java applications experience no contention. - [10:21](https://www.youtube.com/watch?v=5uljtqyBLxI&t=621s) Hardware Transactional Memory (HTM) confined to L1 caches failed to provide significant application-level scaling because true data dependencies and non-CPU bottlenecks routinely serialize execution. - [19:52](https://www.youtube.com/watch?v=5uljtqyBLxI&t=1192s) Direct hardware bytecode execution was rejected in favor of a clean 3-address RISC microarchitecture optimized specifically as a target for JIT compilers. - [12:00](https://www.youtube.com/watch?v=5uljtqyBLxI&t=720s) The Cache Line Zero (CLZ) instruction eliminates read requests over the memory bus during object allocation, reducing total memory bus bandwidth consumption by 30%. - [14:21](https://www.youtube.com/watch?v=5uljtqyBLxI&t=861s) Optimistic runtime escape detection outperforms static escape analysis on massive enterprise codebases, achieving 60% to 70% stack allocation versus 20% to 30% statically. - [18:01](https://www.youtube.com/watch?v=5uljtqyBLxI&t=1081s) Embedding object metadata directly into the unused upper bits of 64-bit pointers enables speculative subclass checks and method dispatches without dereferencing object headers. - [19:52](https://www.youtube.com/watch?v=5uljtqyBLxI&t=1192s) Azul applied a core co-design philosophy: implement fast detection mechanisms in silicon while delegating complex recovery and fixup logic to software. - [24:11](https://www.youtube.com/watch?v=5uljtqyBLxI&t=1451s) A stateless custom operating system eliminated swap space and legacy drivers while providing bulk virtual-to-physical memory remapping and instant core de-configuration on hardware faults. - [34:17](https://www.youtube.com/watch?v=5uljtqyBLxI&t=2057s) First silicon from TSMC suffered critical defects from faulty licensed third-party IP, requiring limp-home mode, voltage adjustments, and an emergency metal-mask respin utilizing spare substrate transistors. - [56:42](https://www.youtube.com/watch?v=5uljtqyBLxI&t=3402s) Hardware-assisted user-mode read-barrier traps eliminate operating system intervention, patching stale pointers in 40 to 50 CPU cycles and self-healing memory to prevent repeated traps. - [47:08](https://www.youtube.com/watch?v=5uljtqyBLxI&t=2828s) The Pauseless Garbage Collector runs entirely without manual tuning flags, treating sub-par performance or pausing issues as internal collector bugs rather than customer configuration errors. - [01:00:32](https://www.youtube.com/watch?v=5uljtqyBLxI&t=3632s) Safepointing thousands of threads within milliseconds is achieved via hardware-broadcast status bits that force backward branches and poll points into fast user-mode traps. - [01:02:47](https://www.youtube.com/watch?v=5uljtqyBLxI&t=3767s) Azul processors provide symmetric 1-clock uncontended volatile reads and writes, contrasting with x86 where volatile writes require expensive multi-hundred-cycle memory fences.

## Detailed walkthrough ### [00:00](https://www.youtube.com/watch?v=5uljtqyBLxI&t=0s) Introduction and the Azul Systems Architecture

At Google TechTalks, Dr. Cliff Click—Chief JVM Architect at Azul Systems and previously the lead architect on Sun Microsystems' HotSpot server compiler—is introduced to speak about building custom hardware and software for massive concurrency. Presenting slides originally prepared for an ECOOP keynote, Click outlines Azul's approach: designing proprietary chips manufactured by TSMC (Taiwan Semiconductor Manufacturing Company) and assembling coherent systems specifically targeted at running business Java applications.

Azul's architecture fits 54 custom cores per die and connects up to 16 dies into a single cache-coherent system, yielding an 864-core machine. Rather than using Non-Uniform Memory Access (NUMA)—the standard industry choice for high-core-count computers—Azul built a flat, Uniform Memory Access (UMA) architecture. Click explains that business Java performs highly irregular computations where data layout cannot be planned in advance to guarantee cache locality. Instead of having memory that is sometimes fast and sometimes slow depending on physical proximity, Azul chose a design where all memory accesses run at a uniform, predictable speed backed by supercomputer-class interconnect bandwidth (placing them on the top-20 supercomputer bandwidth rankings).

```mermaid flowchart TD accTitle: Azul Systems Die Cache and Memory Hierarchy accDescr: Diagram illustrating 54 cores grouped into clusters of 9 sharing L2 caches, connected to coherent uniform memory.

subgraph Die["Azul Processor Die (54 Cores Total)"] subgraph Cluster1["Core Cluster 1"] C1["9 x RISC Cores<br>(16KB L1 I-Cache + 16KB L1 D-Cache per core)"] L2_1["Shared 2MB L2 Cache"] C1 --> L2_1 end subgraph Cluster6["Core Clusters 2 through 6"] C6["45 x RISC Cores<br>(in 5 clusters of 9 cores)"] L2_6["5 x Shared 2MB L2 Caches<br>(10MB Total)"] C6 --> L2_6 end end

subgraph SystemMem["Uniform Memory Subsystem"] MC["Coherent Interconnect<br>(Up to 16 Dies / 864 Cores)"] DRAM["Commodity 64-bit DRAM<br>(Uniform Memory Access)"] L2_1 --> MC L2_6 --> MC MC --> DRAM end ```

The individual processing cores are simple, classic 3-address RISC engines without replicated execution units or complex branch prediction, operating at lower clock frequencies than standard x86 processors to conserve die area and power. Caches are structured hierarchically: - Each core carries its own 16 KB L1 instruction cache and 16 KB L1 data cache. - Every group of 9 cores shares a 2 MB L2 cache (amounting to 6 L2 caches, or 12 MB total L2 cache per 54-core die). - Individual cores can keep multiple cache-missing loads in flight, while each L2 sustains several concurrent prefetches. - Across a fully loaded 864-core box, well over 2,000 outstanding memory references can remain in flight concurrently without saturating memory bus bandwidth.

---

[03:24](https://www.youtube.com/watch?v=5uljtqyBLxI&t=204s) Business Drivers: The Death of COBOL and the Multicore Era

Click contextualizes Azul's founding around the turn of the century, driven largely by enterprise transitions following the Y2K scare. Enterprise organizations realized their legacy COBOL systems were unmaintainable and aging out, prompting widespread migrations to Java for mission-critical core systems. This created tens of millions of lines of enterprise Java code structured around application servers, Enterprise JavaBeans (EJB), WebLogic, WebSphere, and JBoss. The concurrency model of these workloads was characterized by transaction- and task-level parallelism implemented using thread pools and worklists.

Concurrently, chip designers ran straight into the thermal "power wall." Increasing clock frequencies drove power consumption and heat dissipation to unsustainable levels. Click highlights that as clock scaling stalled—settling around 2.5 GHz for server parts and up to 3.5 GHz for consumer gaming chips—increasing performance required packing more cores onto a die rather than bloating single-thread caches. While this industry trend made a multi-threaded, multicore machine the natural solution for enterprise transactions, Azul faced a demanding commercial hurdle.

> “You must have like a really, really good reason to buy custom hardware for the obvious X86 solution. And, you know, a merely 5x price performance kind of gain is not really good enough to make people jump ship there.”

To justify custom silicon against commodity x86 hardware, Azul had to engineer features directly targeting the core pain points of managed runtimes: - **64-bit Heaps:** Enterprise business applications were already exhausting 32-bit address spaces, so Azul bypassed 32-bit entirely to natively support massive 64-bit heaps. - **Hardware-Assisted Garbage Collection:** Building on ideas dating back 20 years to Symbolics Lisp machines, Azul incorporated dedicated read- and write-barriers directly into the CPU instruction set. - **Commodity DRAM Alignment:** Although software architects requested an extra hardware tag bit per memory word to identify object references, hardware engineers rejected the proposal: “Must have commodity DRAMs, must be 64-bit DRAMs. Cannot have the 5th—65th bit there.”

---

[06:01](https://www.youtube.com/watch?v=5uljtqyBLxI&t=361s) Memory Models, Cache-Speed CAS, and Lock Elision via HTM

Azul also focused on concurrency synchronization. In theory, hardware transactional memory (HTM) was championed in academic circles as an alternative to complex locking schemes, which developers struggled to write correctly without scattering defensive `synchronized` statements throughout codebases. Because businesses will not rewrite massive enterprise applications for speculative language primitives without industry momentum, Azul adapted HTM specifically to perform transparent Java lock elision.

Beyond transactions, Click points out that 99% of locks encountered in real workloads are completely uncontended, making uncontended synchronization latency paramount: - **L1 Cache-Hit Compare-and-Swap (CAS):** On commodity CPUs, an atomic CAS is paired with an expensive bus locking protocol or memory fence that incurs heavy pipeline penalties. Azul designed their memory model so that an uncontended CAS hits directly in the L1 data cache and completes in a single clock cycle. - **Fence-Free CAS Operations:** In standard HotSpot on third-party CPUs, CAS instructions enforce strict memory ordering, often in the wrong location relative to Java monitor enter semantics, forcing the JVM to emit a second separate fence. Azul decoupled ordering from atomicity, providing a fence-free CAS that executes in one pipeline clock. This instruction accelerates lock-free data structures, concurrent collectors, and high-frequency performance counters. - **Explicit Memory Fences:** The architecture adopts a memory model significantly weaker than x86 or SPARC TSO (Total Store Order), allowing aggressive instruction reordering while relying on explicit compiler-emitted fences to conform strictly to the Java Memory Model specification.

```mermaid flowchart TD accTitle: HTM Speculative Execution and Software Fallback Flow accDescr: Flowchart showing how HTM executes speculative operations in L1, commits silently, or aborts to software fallback.

Start["Enter Critical Section"] --> Spec["Execute SPECULATE Opcode<br>(Set L1 spec-read / spec-write bits)"] Spec --> Exec["Run Speculative Critical Section<br>(L2 Cache remains completely unaware)"]

Exec --> Conflict{"L1 Line Eviction<br>or Core Conflict?"}

Conflict -- "No Conflict" --> Commit["Execute COMMIT Opcode<br>(Clear spec bits, make writes permanent)"]

Conflict -- "Conflict / Eviction" --> Abort["Execute ABORT Opcode"] Abort --> Flush["Invalidate Speculative L1 Cache Lines<br>(All pending writes discarded)"] Flush --> Fallback["Software Recovery Handler<br>(Retry transaction or acquire heavyweight OS lock)"] ```

Azul integrated HTM support from day one via three dedicated instructions: `speculate`, `commit`, and `abort`. The hardware engineering team placed strict architectural constraints on where HTM could touch the design:

> “The L2 is a—what Intel calls the LLC, the Last Level Cache. It’s the point of coherency between the hundreds of hundreds CPUs in the system. That is already one of the most complicated parts in the system. There’s no freaking way you’re going to go in there and add some new weird-ass thing that no one knows if it’s going to help or not.”

Consequently, HTM is implemented strictly inside the L1 cache using speculative read and write tracking tag bits, leaving the shared L2 coherency fabric completely unaware of ongoing transactions: - When a core runs the `speculate` instruction, subsequent cache line reads and writes mark speculative tag bits in the L1. - If a tagged line is invalidated, evicted due to capacity, or contested by another core, the transaction immediately aborts. - On abort, all speculatively written lines in L1 are thrown out, and the core jumps to a software recovery routine. - The software handler can retry the speculative section or fall back to acquiring a heavyweight lock.

Although the hardware reliably executes speculative transactions lasting thousands of instructions, Click concludes with a candid realization: in real-world deployments, lock elision failed to yield significant speedups on legacy "dusty-deck" enterprise code.

[10:21](https://www.youtube.com/watch?v=5uljtqyBLxI&t=621s) The Limits of Transactional Memory and the Reality of GC Pauses

Cliff Click explains that while hardware transactional memory sounds appealing in theory, in large concurrent programs it rarely delivers the breakthrough of allowing more threads to run in parallel. The fundamental roadblock is the presence of true data dependencies. More often than not, these dependencies are caused by trivial code artifacts: an unread global performance counter that gets incremented inside an otherwise isolated transaction instantly forces serialization. Because no transactional memory system—hardware or software—can magically bypass a true data dependency, developers are ultimately forced to go into the codebase and manually refactor it. Cliff points out the irony of that requirement: once a team is already willing to alter their source code to make it transactional-memory friendly, they might as well invest that effort into standard fine-grained locking instead. Cliff notes that he already open-sourced practical concurrency alternatives in his `high-scale-lib` library.

Furthermore, transactional memory fails to address the actual operational bottleneck of massively parallel enterprise architectures. On high core-count machines, application scaling is bounded by garbage collection rather than locking. As workloads scale and heap sizes grow, stop-the-world GC pause times become intolerable, leaving teams with no choice but to chop their applications into clusters of smaller JVM instances rather than scaling vertically on big iron. Cliff contrasts Azul’s transactional hardware support with contemporary efforts like Sun Microsystems’ Rock processor. While Azul's implementation was far more robust than Rock—Azul did not abort transactions for nested locks, function calls, or TLB misses—Cliff remains pragmatic about its overall impact on enterprise workloads. As Cliff puts it:

> “It's not going to save the world.”

- Incremented shared counters represent true data dependencies that break transaction commit pipelines across concurrent threads. - Sun’s Rock processor notoriously aborted hardware transactions on standard operations such as TLB misses, nested locks, and basic function calls. - GC pause times, rather than lock contention, represent the primary driver forcing enterprise Java architectures into clustered deployments.

---

[12:00](https://www.youtube.com/watch?v=5uljtqyBLxI&t=720s) Tackling the Memory Bandwidth Bottleneck: Cache-Line Zeroing and Loose Ordering

Looking back to the 2000–2002 architectural design phase, the Azul team faced a glaring hardware constraint: memory bandwidth saturation. If a chip packs dozens of cores (such as 54 cores), each core generates its own distinct working set, suffers its own L1 cache misses, and competes for the bus. To keep the memory pipeline from collapsing under standard Java memory patterns, Azul introduced dedicated hardware features. In standard bump-pointer garbage collectors, the thread continuously allocates into brand-new addresses that have not been referenced by that core since the prior collection cycle. Normally, writing to a new object triggers a cache read miss to bring the uninitialized line from main memory into L1, only for the CPU to immediately overwrite the entire line with zeros before filling it with object payload data.

To eliminate that wasted read traffic, Azul implemented the `CLZ` (Cache Line Zero) instruction. `CLZ` performs just-in-time zeroing directly inside the L1 cache without issuing a read transaction to main memory, securing cache coherence without pulling unneeded bytes over the memory bus. Because the generational hypothesis holds true and most young objects die quickly in cache, this single architectural optimization delivered an immediate, massive payoff. Alongside a very loose memory model that allows the hardware wide latitude to reorder memory operations to mask latency, `CLZ` provided substantial bandwidth relief. As Cliff emphasizes:

> “It turns out that that, in practice, very measurable, very real 30% reduction in bandwidth.”

```mermaid flowchart TD accTitle: Standard Allocation vs CLZ Hardware Allocation accDescr: Flow comparison showing how traditional allocation wastes memory bus reads while CLZ allocates directly in cache.

subgraph Standard["Standard Bump Pointer Allocation"] A["Thread allocates at new address"] --> B["Cache miss: Read line from RAM"] B --> C["Write zeros over fetched data"] C --> D["Write object fields"] end

subgraph AzulCLZ["Azul Hardware CLZ Allocation"] E["Thread allocates at new address"] --> F["CLZ instruction zeros line directly in L1"] F --> G["No read traffic sent across memory bus"] G --> H["Write object fields into hot cache"] end ```

- Bump-pointer allocation causes a continuous stream of cache misses for newly claimed heap space. - The `CLZ` instruction allocates and zeros cache lines in L1 without reading stale data from main memory. - Eliminating unneeded memory reads during object allocation reduced memory bus bandwidth consumption by roughly 30%. - A relaxed, loose memory model grants the hardware pipeline deep opportunities to reorder operations and cover bandwidth latencies.

---

[14:21](https://www.youtube.com/watch?v=5uljtqyBLxI&t=861s) Escape Detection vs. Escape Analysis

When asked to clarify the distinction between escape detection and compiler escape analysis, Cliff details the vast operational gap between static compile-time proofs and runtime optimistic execution. Traditional escape analysis relies on conservative static compiler passes. If the compiler can mathematically prove that an allocated object never escapes its local lexical scope or analysis boundary, it can allocate that object directly on the thread stack, turning allocation and deallocation into near-zero-cost stack pointer adjustments. While this works well on small benchmarks, it breaks down on enterprise-grade business logic. Enterprise applications are far too large and complex for whole-program static proofs; the analysis rapidly becomes conservative, encounters unknown pointer paths, and yields virtually zero stack allocation for big applications.

Azul bypassed this limitation by replacing static compile-time escape analysis with optimistic runtime escape detection. Under escape detection, the runtime speculatively allocates objects on the stack under the assumption that they will have stack lifetimes, requiring no expensive pre-analysis. The CPU hardware and runtime monitor subsequent pointer stores: if code attempts to store an object reference outside the thread's local stack purvey, the hardware detects the escaping pointer and triggers a post-facto fix-up to move the object onto the global heap. Because the overwhelming majority of short-lived objects never escape, this optimistic gambit succeeds at an extraordinary rate compared to standard static approaches. As Cliff explains:

> “In turns out in practice, for these big up servers, we can get between 60%, 70% of all objects stack allocated, whereas the good escape analysis are, like, well under 20 or 30%.”

- Static escape analysis degrades severely on large, multi-million-line codebases, yielding low single-digit percentage gains. - Runtime escape detection requires zero ahead-of-time static proofs, optimistically betting that objects do not escape. - Hardware checks during pointer writes intercept escaping references and fix them up dynamically. - Stack-allocated objects eliminate both memory reads and memory writes to main RAM by recycling hot cache lines.

---

[16:08](https://www.youtube.com/watch?v=5uljtqyBLxI&t=968s) Memory Striping and Abandoning NUMA in Business Logic

Cliff shifts to Azul’s chip-level memory subsystem, framing the processor strictly as a high-throughput machine rather than an uber-fast single-threaded core. Instead of betting on massive caches and deep single-core speculative execution, Azul deployed large numbers of lightweight cores, each spewing independent cache misses that the memory subsystem satisfies concurrently. Each chip integrates four distinct memory controllers. To prevent any single controller from becoming a pipeline bottleneck, physical memory accesses are fine-grained striped across all controllers and chips using a semi-random hash. Successive memory accesses light up every controller in turn, distributing the electrical and bandwidth load evenly across the entire machine.

This architecture arose from a fundamental realization regarding enterprise Java applications: unlike scientific computing, business logic applications exhibit zero sane spatial memory locality. It is impossible to isolate a specific heap chunk and assign it locally to a single core. With memory accesses uniformly scattered across the machine, any traditional Non-Uniform Memory Access (NUMA) scheme breaks down. In a multi-socket system, fifteen out of every sixteen memory references inevitably target remote controllers on other chips. Attempting to accelerate the rare 1/16th local case yields negligible system-level performance while dramatically increasing hardware and software complexity. Azul consequently abandoned NUMA entirely, intentionally routing local memory transactions off-chip and back on to guarantee that local and remote memory operations carry the exact same latency and cost. As Cliff points out:

> “Since there's no sane layout, if it's just random, then 15/16ths of your memory is on the other memory controllers on the other chip, right, so remote.”

- Each Azul processor integrates four independent on-die memory controllers. - Memory addresses are hashed and striped across all chips to eliminate hot-spotting on any individual bus or controller. - Enterprise Java features no meaningful data locality, rendering NUMA optimizations ineffective. - Azul opted for a flat Uniform Memory Access (UMA) latency profile where local memory loops off-chip, matching remote latency costs evenly across the board. - On-chip caches are prioritized strictly for stack frames and newly allocated young-generation objects.

---

[18:01](https://www.youtube.com/watch?v=5uljtqyBLxI&t=1081s) Pointer Metadata, Safepointing at Scale, and Hardware/Software Co-Design

To squeeze out further efficiencies, Azul engineered short cache lines, which mitigated bandwidth waste and eliminated concurrency-destroying false-sharing bugs. They also repurposed standard 64-bit pointers. Because modern architectures utilize only the lower 40 to 42 address bits—already capable of addressing multiple terabytes of RAM—the upper 20 bits of a pointer are typically filled with redundant sign-extended zeros or ones. Azul leveraged these unused upper bits to embed runtime metadata directly into object references. The CPU hardware strips these metadata bits before driving physical address buses. By keeping metadata in the pointer itself, the JVM accelerates virtual method dispatch by performing predicted subclass checks directly on the reference without having to dereference the object's memory header.

Azul also implemented a dedicated cooperative self-suspension mechanism designed to safepoint thousands of actively executing threads. Unlike standard server workloads where the majority of threads idle on blocking I/O, Azul systems had to halt thousands of runnable CPU-bound threads in mere milliseconds to initiate garbage collection cycles, and then restart them simultaneously without thread-scheduling stalls. Cliff concludes with a humorous look at the daily friction of hardware and software co-design. Whenever he approached the hardware engineering team asking for a specialized single instruction to execute a complex sequence, the hardware engineers would push back with rigorous trade-offs. As Cliff recounts:

> “And I go to the hardware guys and say, ‘Can you give me instruction to do this?’ He said, ‘Sure. I'll give you one. Here are my three clocks and here are three, one-clock instructions that do X. And now tell me why it really has to be faster than three clocks?’”

- Short cache line sizes minimize false sharing between concurrent threads and preserve memory bus bandwidth. - Unused upper bits of 64-bit pointers store object metadata, stripped by the hardware prior to bus transactions. - In-pointer metadata accelerates virtual calls by validating predicted subclass tests without memory dereferences. - Hardware-assisted cooperative self-suspension brings thousands of running threads into GC safepoints within milliseconds. - Hardware architects constantly challenged JVM requests for custom instructions, demanding proofs where a dedicated instruction genuinely outperformed a few standard single-cycle RISC operations.

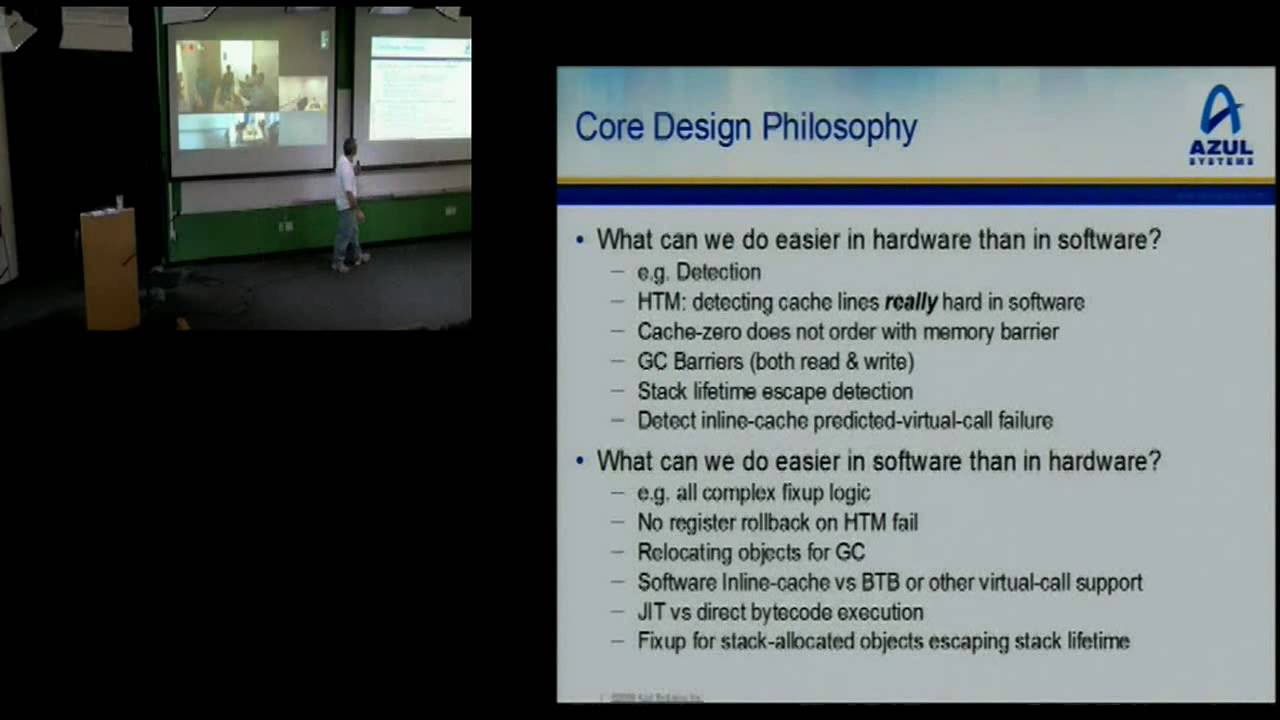
[19:52](https://www.youtube.com/watch?v=5uljtqyBLxI&t=1192s) Hardware/Software Co-Design: What Belongs in Silicon vs. Software

During the co-design of the chip, Cliff Click frequently had to rein in hardware engineers who proposed complex features. Whenever they offered optimizations that shaved a few clock cycles off infrequent operations, Click would counter that three clocks every few thousand instructions was completely acceptable. In return, the hardware team would propose seemingly attractive Java-centric features like direct bytecode execution in silicon—reminiscent of Sun's picoJava or ARM's Jazelle. Click vehemently pushed back against these ideas:

> “Oh, my God, don't do that. It's been tried before. It's disastrous. What about JIT? Give me a nice JIT target. Nice RISC. I'll make you a pretty code for it and it'll run really fast. Don't try and screw around with executing bytecodes directly because after I JIT, you won't care for it and, in any case, you can't handle all the bytecodes, so you'll have to bail out the software over anyhow.”

The same dynamic played out with virtual method dispatch. When hardware engineers offered complex branch target buffers to accelerate dynamic calls, Click analyzed instruction traces and showed that jump-register instructions were almost nonexistent in their compiled output. The JIT compiler relied heavily on polymorphic inline caches instead of indirect jumps, rendering specialized hardware prediction redundant. Click urged them to stick to standard, well-tuned branch prediction and focus on baseline execution speed instead, noting:

> “Basic stuff is more important to get right. I'd rather have a 5% bumping clock rate over any one of these other things.”

The guiding rule of Azul’s hardware/software co-design became clear: **simple detection belongs in hardware, while complex recovery and fixup belong in software.**

```mermaid flowchart LR accTitle: Hardware Detection vs Software Fixup Division accDescr: Diagram showing how Azul splits responsibilities between simple hardware detection mechanisms and complex software recovery logic.

subgraph HW["Hardware Layer (Detection)"] H1["Cache Line Eviction (HTM)"] H2["GC Read / Write Barriers"] H3["Type Sub-Checking Checks"] end

subgraph SW["Software Layer (Fixup & Logic)"] S1["Abort, Retry & Fallback Logic"] S2["Object Relocation & Remapping"] S3["Inline Cache Updates & Deopt"] end

H1 -->|"signal eviction"| S1 H2 -->|"trap / mark bit trigger"| S2 H3 -->|"mismatch detect"| S3 ```

- **Hardware Transactional Memory (HTM):** Software transactional memory (STM) implementations incur an order-of-magnitude 10x penalty trying to track memory conflicts. Hardware already tracks cache-line invalidations via coherency protocols, making conflict detection virtually free. - **No hardware register rollback:** Academic HTM models depend on complex out-of-order execution engines with register renaming to roll back speculative state. Azul’s cores remain simple in-order RISC; when an HTM transaction aborts, rollback and retry are orchestrated entirely by the software runtime. - **Cache line zeroing:** Zeroing allocations outside the standard memory coherency domain avoids stalling incoming zeroing pipelines on lock acquisitions, preventing CPU stalls and maintaining high allocation bandwidth. - **Garbage collection read barriers:** Academic literature typically cites a 10% to 20% throughput penalty for software read barriers. Implementing lightweight detection directly in the load/store hardware dropped the barrier overhead to near zero, enabling concurrent GC algorithms that scale to massive heap sizes.

---

[24:11](https://www.youtube.com/watch?v=5uljtqyBLxI&t=1451s) The Appliance Strategy and Custom OS Architecture

Enterprise customers and conservative financial institutions were unwilling to buy an unproven server architecture running an unfamiliar operating system if it required major operational disruption. Azul solved this adoption hurdle by packaging the system as a drop-in network appliance. Existing enterprise applications running on legacy Sun SPARC or HP-UX servers could simply point their local client to the Azul appliance's JDK over the network, achieving massive speedups without touching core enterprise infrastructure:

> “And, literally, it's 10 minutes from install to sort of a max score JBB on any old machine in your entire data center.”

By treating the appliance as an execution engine, Azul bypassed typical operating system headaches. The OS contained no legacy driver baggage, no user-facing DLL or patch management issues, and ran completely stateless without disk swap space. Standard commodity kernels like Linux could not handle the machine's concurrency profile, prompting Azul to design a custom scheduler capable of managing hundreds of CPU cores and thousands of runnable threads simultaneously.

- **Quality-of-service guarantees:** The OS enforces strict hard performance floors, allowing administrators to partition and guarantee specific CPU and memory quotas to mission-critical JVM processes while permitting lower-priority batch jobs to opportunistically consume idle resources. - **Custom memory management:** The OS provides rapid, bulk virtual-to-physical memory remapping and bulk TLB shootdowns designed expressly for high-speed concurrent garbage collection. - **Virtual memory with type safety:** When questioned why an appliance running type-safe Java requires hardware TLBs and page protection, Click's blunt answer was simply: “Well, you get bugs.” - **Hardware fault isolation:** The operating system continuously monitors hardware reliability, using chipkill and parity data to dynamically de-configure failed memory chips, individual dead caches, or faulty CPU cores without crashing the entire system.

---

[26:54](https://www.youtube.com/watch?v=5uljtqyBLxI&t=1614s) Why Design a Custom CPU and How to Exploit Massive Core Counts

Azul ended up designing their own CPU because no commercial 64-bit multi-core designs were available that met their architectural requirements. Adapting an existing x86 core layout would have required gutting and redesigning the load-store unit and L1 caches to accommodate hardware transactional memory, metadata stripping for GC barriers, ECC protection across L1 caches, and register file parity. Because each core featured 32 architectural registers backed by 64 physical registers across 54 cores per chip (thousands of register cells vulnerable to soft errors), register integrity was essential:

> “And by that time, you are now redesigning about half your CPU anyhow.”

Rather than struggling with proprietary IP modifications, Azul built their own RISC processor, ported GCC and the toolchain, and brought up the HotSpot JVM on the architecture in short order.

Having hundreds of cores completely altered software tradeoffs: when spare cores are ubiquitous, background tasks become virtually free. Azul leveraged this architectural scale in two primary areas:

- **Aggressive JIT compilation:** During application startup, the runtime spins up pools of 30 to 50 background compiler threads. The JIT generates megabytes of optimized native code per second, compiling the entire multi-gigabyte application footprint in flight within minutes. - **Cache-isolated concurrent GC:** Full-heap garbage collection touches huge volumes of memory and exhibits poor spatial locality, which would typically thrash processor caches. Rather than competing with application threads (mutators) on shared L2 caches, Azul isolates GC worker threads onto distinct L2 processor clusters. Because the GC threads only need to finish before the next collection cycle begins, their low L2 cache hit rate is immaterial, leaving the application mutators' caches entirely unpolluted.

[29:55](https://www.youtube.com/watch?v=5uljtqyBLxI&t=1795s) Toolchain, Simulation, and the Multi-CPU Simulator Rule

Azul explored a variety of low-latency hardware and software tricks, including background profiling, pre-zeroing memory pages, and having the CPU hot-spin on I/O so that only single-digit clock cycles elapsed between data landing in memory and processing beginning. Once the architectural concepts were solidified, the team faced the daunting task of turning those ideas into a taped-out design for TSMC. Cliff Click recalls that the dot-com bust worked in their favor for hiring: with widespread layoffs across Silicon Valley, Azul assembled an elite roster of hardware engineers, operating system specialists, and VM developers. They immediately started porting GCC and Sun's HotSpot JVM to their custom ISA while developing an in-house software simulator.

Running on high-end x86 machines, their simulator achieved roughly 20 MHz of simulated Vega chip operations—fast enough to boot the operating system and execute massive, complex Java enterprise applications under simulation. The team built an extensive suite of analysis tools around it, including trace generators, cache-miss and layout visualizers, and an aggressive data-race detector that rooted out latent race conditions within HotSpot as well as user applications. A major technical takeaway emerged regarding simulator architecture: if a multi-core system simulator is executed on a single-core host, it hides real-world concurrency phenomena.

Cliff Click emphasized this hard-won realization: > “Your simulators have to be run on a true multi-CPU machine or you will not get realistic [timing] that will happen in real life.”

When Azul transitioned their simulator runs from single-socket to dual-processor x86 hosts, an entirely new class of simulation data races surfaced that had never triggered under single-threaded execution.

- Toolchain efforts ran in parallel with hardware design, porting both GCC and HotSpot to the custom Vega RISC architecture. - Simulator speed reached ~20 MHz equivalent Vega execution speed on top of fast x86 host hardware. - Host multiprocessor parallelism was required to expose real race conditions in the simulated multi-threaded guest.

---

[31:43](https://www.youtube.com/watch?v=5uljtqyBLxI&t=1903s) Vega 1 Core Architecture and L2 Cache Over-Subscription

The first physical processor, Vega 1, integrated 24 64-bit RISC cores arranged as three clusters of eight cores, with each cluster sharing a 1 MB L2 cache. Individual cores featured a 16 KB instruction cache and a 16 KB data cache (both 4-way set-associative) along with short cache lines and dedicated tag bits to support Hardware Transactional Memory. However, the shared L2 cache was also only 4-way set-associative. This created an extreme structural over-subscription: eight independent processors, each carrying separate 4-way instruction and 4-way data streams, converged onto a shared 4-way L2 cache. If four CPUs happened to map into the exact same L2 set, any access from a fifth core would evict an active line, triggering thrashing and severe false sharing across all eight CPUs.

Azul was acutely aware of this risk, but manufacturing realities dictated the compromise. Vega 1 was already pushing the absolute boundaries of silicon die area and yield—it was the largest physical die TSMC had ever fabricated up to that point. The system architecture supported coherent interconnect fabric across up to 16 physical chips. Memory latencies were structured such that missing the local L2 incurred roughly the same cost regardless of whether the fetch resolved in a peer chip's L2 or in main DRAM.

On the core level, Click got the clean JIT compilation target he had requested. The pipeline was an in-order, classic 3-address 64-bit RISC engine with a single-entry store buffer/latch and hit-under-miss caching. It incorporated hardware metadata masking, an integrated per-core floating-point unit without vector register baggage or legacy status flags, a background register stack engine to spill and fill registers on deep call frames, and dedicated hardware assists for array bounds checks, virtual method dispatch, and Garbage Collection barriers.

```mermaid flowchart TD accTitle: Vega 1 Memory Hierarchy and Cluster Architecture accDescr: Architecture of Vega 1 showing 8-core clusters sharing a 4-way L2 cache backed by the 16-chip coherent interconnect.

subgraph Cluster["Cluster (1 of 3 per Vega 1 Chip)"] subgraph Cores["8 RISC Cores"] C1["Core 0\n16KB I / 16KB D (4-way)"] C2["Core 1\n16KB I / 16KB D (4-way)"] CDots["... Cores 2-6..."] C8["Core 7\n16KB I / 16KB D (4-way)"] end L2["Shared 1MB L2 Cache\n(4-way Associative - Over-subscribed)"] Cores -->|"Read / Write Contention"| L2 end

subgraph Fabric["Coherent Interconnect & Memory"] CoherentBus["16-Chip Interconnect Fabric"] RemoteL2["Remote Chip L2 / Main Memory\n(Latency ~ Local L2 Miss)"] L2 -->|"L2 Miss"| CoherentBus CoherentBus --> RemoteL2 end ```

- Each Vega 1 die packed 24 cores organized into three clusters of 8 cores. - L1 cache per core: 16 KB I-cache (4-way) and 16 KB D-cache (4-way) with HTM metadata state tags. - Cluster cache: 1 MB L2 (4-way) shared among 8 cores, heavily over-subscribed and prone to eviction thrashing under aligned workloads. - Core pipeline: In-order 64-bit 3-address RISC, single-entry store latch, zero legacy flags/modes, background spill/fill register engine. - Memory fabric: Coherent scaling up to 16 chips, where an off-core L2 miss cost was comparable to remote cache or memory access.

---

[34:17](https://www.youtube.com/watch?v=5uljtqyBLxI&t=2057s) First Silicon Back from TSMC: "Mostly Dead" and Cooking Chips

In 2004, the first batch of manufactured Vega 1 silicon arrived from TSMC. A courier boarded a flight in Taiwan carrying the physical parts in a box, landing at Azul's headquarters 24 hours later. The engineering team immediately began probing the chips, only to discover severe manufacturing and design defects across the die. The L2 caches were almost entirely non-functional. The chip could only boot if operated in a degraded fallback mode Azul dubbed "limp home mode"—borrowing automotive terminology for driving an exploded transmission stuck in first gear. Engineers disabled three of the four L2 ways entirely, leaving a fragile 1-way 256 KB L2 alive while relying on continuous Error-Correcting Code (ECC) scrubbing to survive.

The CPU register files suffered an even more bizarre electrical defect: bit lines were capacitive coupling, causing writes to even-numbered registers to bleed unpredictably into the adjacent odd-numbered registers. If an instruction executed `ADD Rx, Ry -> Rz`, and `Rz` was an even register, its payload would corrupt register `Rz+1`. The JIT compiler team had to immediately generate code targeting only register subsets. Worse, the instruction decoder erroneously decoded branch target offset bits through the register address ports simultaneously with branch opcodes, toggling register file address lines on branches and corrupting arbitrary state unless branches targeted specific aligned addresses with predetermined zero bits.

To make the surviving silicon operational at all, Azul was forced to drop the clock speed down to one-third of the target frequency and jack the operating voltage up to five times normal ratings. The extreme over-voltage induced severe electromigration: metal atoms within the silicon lattice physically migrated across traces under high current density. The test chips literally cooked themselves to death within about thirty days. Test benches featured howling industrial fans clamped directly to glowing heatsinks. Despite the chaos, the operating system team leveraged the failing hardware as the ultimate baptism by fire, verifying their hardware-error handling, dynamic CPU de-configuration, and ECC recovery subroutines on genuinely damaged silicon.

Cliff Click summarized the scene when the first packaged parts arrived: > “We get our first silicon back from TSMC at 2004, right? It's not quite dead. It's dead, gentleman. Not quite.”

- First silicon arrived via personal air courier from TSMC Taiwan in 2004 and exhibited critical electrical faults. - "Limp home mode" cut the 1 MB 4-way L2 cache down to a 1-way 256 KB cache running under constant ECC correction. - Even-numbered register writes bled into odd-numbered registers, forcing compiler mitigations. - Instruction decoder bugs treated branch offsets as register decodes, requiring software branches to enforce specific zeroed bit masks. - Running at 1/3 clock frequency and 5x operating voltage triggered rapid electromigration that destroyed test dies within a single month.

---

[37:17](https://www.youtube.com/watch?v=5uljtqyBLxI&t=2237s) Third-Party IP Failure, Metal-Mask Fixes, and Cache Collisions

Azul investigated the root causes with TSMC and discovered that the failures originated inside licensed third-party silicon IP cores sourced from the DSP sector. The IP vendor had certified their designs on paper to run at Azul’s targeted high frequencies, but in reality, that vendor had never actually taped out or shipped functional silicon running beyond one-half to one-third of that rated speed. Because the circuits had never been manufactured or validated at those limits, they collapsed in real silicon.

Rather than incurring the multi-month delay and immense expense of a complete silicon redesign, Azul’s hardware engineers utilized an emergency metal-mask spin. The team had deliberately manufactured excess wafers that were paused three-quarters of the way through the fabrication pipeline, awaiting final metal routing layers. The original die layout was intentionally peppered with uncommitted "spare" transistors sprinkled across the substrate. By revising only the topmost metal masks, hardware designers routed around broken IP blocks, hooking into previously idle transistors to patch logic paths and fix clocking issues without a full silicon respin.

The resulting second silicon revision proved exceptionally clean. The operating system booted successfully within two weeks of receiving the new silicon. A C "Hello World" binary was running 24 hours later, and `java -version` executed cleanly just four days after that, validated by thousands of hours of prior simulator verification.

Even with functional silicon, stabilizing the machine at scale took another full year. The architecture featured more concurrent cores and aggressive out-of-order execution than any software platform had previously targeted, revealing endless timing bugs. Additionally, the 4-way over-subscribed L2 cache suffered severe performance penalties due to memory alignment: thread call stacks were all aligned to 1 MB boundaries by default. When multiple application threads reached similar execution depths, their stack frames mapped precisely onto the same L2 cache lines, causing the eight cores in a cluster to aggressively evict one another's active frames. Azul resolved the thrashing entirely in software by introducing randomized stack pointer offsets, randomized JIT code cache offsets, and OS-level memory page coloring.

Cliff Click described the sheer relief and speed of getting the second silicon revision running after the metal respin: > “Two weeks from getting this silicon to getting the OS to boot, a day later to get 'hello world' out of C program. Four days later, the 'java -version' works, right?”

- The hardware failures were traced to third-party DSP silicon IP rated for frequencies at which it had never physically been manufactured or tested. - A metal-mask spin salvaged partially fabricated wafers by rewiring logic through unused spare transistors left across the die layout. - Software bring-up on the revised silicon took only two weeks to boot the OS, one additional day for C binaries, and four days to achieve a working `java -version`. - Massive L2 thrashing across the 8-core clusters was resolved in software using randomized thread stack offsets, randomized code cache layout, and operating system page coloring.

[40:03](https://www.youtube.com/watch?v=5uljtqyBLxI&t=2403s) What Worked, What Didn't: Silicon, Power Supplies, and Cache Mysteries

Reflecting on the hardware architecture, Cliff Click notes that sharing a single 4-way L2 cache among eight 4-way L1 caches ultimately yielded an entirely tolerable miss rate, although achieving that required substantial tuning. The virtualization layer designed for drop-in plug-and-play operation with existing JVMs also leaked abstractions initially, forcing engineers to patch several layers before performance stabilized. Once the second metal spin came back from the fab, the chip itself performed solidly: memory bandwidth was plentiful, and raw compute density blew commodity hardware out of the water. “Certainly compared to like an X86, we have way more MIPS per chip, MIPS per watt than X86, like five X more.”

```mermaid flowchart TD accTitle: System Challenges in Hardware and OS Bring-up accDescr: Diagram showing how hardware quirks, platform failures, and OS scaling issues impacted the overall system stability.

subgraph HW["Silicon & Board Bring-up"] A["Low-Frequency DRAM Bugs masked by ECC"] --> B["Motherboard Redesigns for DRAM Timing"] C["In-Order RISC Limits Frequency"] --> D["Lower Single-Thread Speed"] end

subgraph Vendor["Platform Components"] E["2,500W Power Supplies"] --> F["Instant Lab Blowouts Under Full Load"] end

subgraph OS["OS & Runtime Scaling"] G["Scheduling 800+ Cores"] --> H["Scheduler Bottlenecks"] I["Virtualizing I/O Stacks"] --> J["High I/O Latency & Jitter"] end ```

Yet severe hurdles cropped up across the rest of the platform. Single-thread CPU performance remained stubbornly slower than hoped—a direct consequence of using simple in-order cores at low clock frequencies without an army of hardware engineers to design aggressive out-of-order execution pipelines. In the lab, hardware teams fought low-frequency DRAM bugs that had been silently masked for months because the ECC continuously corrected single-bit flips instead of surfacing the underlying fault. The motherboard had to undergo multiple redesigns to fix DRAM bus timing issues. Even commodity hardware components failed unexpectedly: high-capacity 2,500-watt power supplies purchased from major vendors repeatedly blew up when subjected to an actual full-load draw in the lab. Operating system software had equal trouble managing scale: scheduling tasks across 800-plus cores and virtualizing complex I/O stacks proved far from a simple drop-in engineering exercise.

- **MIPS per watt advantage:** Approximately 5× greater MIPS per chip and per watt compared to contemporaneous x86 platforms. - **Power supply failures:** Commercial 2,500-watt power supplies repeatedly died immediately upon drawing maximum rated power in the lab. - **Silicon revisions:** The processor silicon reached stable, functional operation on its second metal spin.

---

[42:52](https://www.youtube.com/watch?v=5uljtqyBLxI&t=2572s) Garbage Collection Growing Pains and Engineering Priorities

Integrating upstream Sun code into Azul's modified JVM presented continuous software maintenance friction. Because Sun's standard HotSpot VM never used read-barriers, every new Sun code drop introduced un-barriered memory reads that Azul engineers had to hunt down manually; missing even one caused elusive, ultra-low-frequency memory corruption bugs that took ages to diagnose. Furthermore, the initial version of Azul's GC was purely single-generation, running a complete collection cycle every five seconds. While pauses were held to around 100 milliseconds across hundreds of gigabytes, executing a full-heap cycle every few seconds exposed latent defects in Sun's codebase that normally ran only during infrequent daily full GCs: “We found lots of bugs in the full GC cycle behavior that were related to the fact that they only happen on the full GC cycle because we're doing it so much more often.”

Engineering priorities became a battlefield between stability and experimental features. Debates flared over whether to spend developer hours stabilizing basic code generation and helping field engineers or chasing advanced capabilities like hardware transactional memory (HTM), stack allocation via escape analysis, larger thread pools for faster warm-up, and tiered compilation. Customer support routinely pulled senior engineers into sales escalation calls: enterprise clients had multi-threaded code riddled with undetected data races that had run stably on x86 purely by chance, but running on a massively parallel box caused the same applications to crash every ten minutes.

- **Initial GC pause target:** 100-millisecond pauses across hundreds of gigabytes, executing every 5 seconds. - **Sun code drop friction:** Missing read-barriers in newly imported HotSpot code caused rare, difficult-to-trace garbage collection anomalies. - **Customer concurrency bugs:** Code that crashed once a day on x86 crashed every 10 minutes on Azul hardware due to massive thread concurrency exposing dormant race conditions.

---

[44:54](https://www.youtube.com/watch?v=5uljtqyBLxI&t=2694s) Hardware Transactional Memory and Stack Allocation Trade-Offs

Both hardware transactional memory (HTM) and hardware-assisted stack allocation were sidelined for extended stretches due to software complexity and engineering time constraints. Early HTM implementations suffered from severe livelock: a core would repeatedly attempt to transact through a contended lock, fail, abort, and retry indefinitely without forward progress. The runtime eventually had to implement fallback paths that detected livelock, trapped to an OS-level lock to force execution forward, and only re-enabled speculative HTM transactions once the system reached steady state. Although HTM has been enabled by default for years, Click admits it is rarely a silver bullet: “It rarely helps customers for—like I said, it's mostly in another talk—it never hurts. And occasionally, you get big wins. You get a 2X speed up or something but the usual case is there's nothing.” Applications usually hit bottleneck limits in the network, the database, or genuine data dependencies long before lock contention dominates.

```mermaid flowchart LR accTitle: Hardware Transactional Memory Fallback State Machine accDescr: Flowchart tracing an HTM transaction from speculative attempt to livelock fallback and eventual steady-state recovery.

A["Attempt HTM Lock Transaction"] --> B{"Transaction Succeeded?"} B -- Yes --> C["Commit Speculative State"] B -- No --> D["Detect Livelock / Repeated Aborts"] D --> E["Trap & Acquire Heavy OS Lock"] E --> F["Make Forward Progress"] F --> G["Wait for Steady-State System Conditions"] G --> A ```

Stack allocation met a similar fate. While aggressive escape analysis could eliminate a huge percentage of heap allocations in ideal cases, edge cases behaved pathologically. Because Azul's continuous concurrent garbage collector advanced so rapidly, the team had little reason to spend scarce engineering time chasing escape analysis bugs. In production, the garbage collector routinely manages heaps of 300 to 500 gigabytes with allocation rates reaching 35 gigabytes per second while holding maximum pause times to 10–15 milliseconds—far outpacing any concurrent x86 collector.

- **HTM shipping status:** Enabled by default in production for over three years prior to the talk. - **Performance impact of HTM:** Occasional 2× speedups, but typically neutral due to non-locking bottlenecks like I/O and databases. - **Production GC metrics:** Sustained 300–500 GB heap sizes with 35 GB/s allocation rates and 10–15 ms maximum pause times.

---

[47:08](https://www.youtube.com/watch?v=5uljtqyBLxI&t=2828s) The Zero-Flag Collector and Always-On Production Profiling

Deploying the Azul JVM at customer sites followed a surprisingly simple playbook: technicians stripped away all legacy HotSpot GC tuning flags, doubled the default heap size, and relaunched. In response to an audience member asking whether the gains came merely from doubling memory or from the fundamentally different collector, Click clarified that HotSpot tuning flags have no meaning on Azul's engine: “And, in fact, we have no tuning flags at all on the GC. If it doesn't perform well, then it's a bug for us and we go fix it on whatever your app is, whatever shape GC cycle thing it's doing.” Doubling the heap removes arbitrary memory restrictions that forced customers to write awkward workarounds or configure undersized internal caches to escape punishing x86 GC pauses. With pauses no longer scaling with heap size, expanding memory instantly unclogged application performance.

The talk highlights an internal diagnostic profiling tool that became an accidental commercial hit. Originally an in-house utility with an unglamorous internal name, customer operations teams demanded access the moment they saw it run. The tool connects through a standard web browser directly into the internals of any production JVM—even instances that have run continuously for months—with virtually zero performance overhead. Rather than attempting to reproduce elusive production hiccups in staging environments, engineers can inspect live thread stacks, watch real-time GC cycles, surf live heap memory, inspect lock contention traces, and analyze call-site profiling. When throughput mysteriously plummets after days of stable production execution, operators no longer need a synthetic reproduction; they simply connect the browser and inspect the runtime state live.

- **Zero-tuning GC philosophy:** No customer-facing GC tuning switches; suboptimal GC performance is classified and patched as an internal Azul bug. - **Production diagnostic visibility:** Live web browser access to inspect thread call stacks, monitor real-time GC behavior, browse active heap graphs, and detect hot locks on live enterprise systems.

[49:51](https://www.youtube.com/watch?v=5uljtqyBLxI&t=2991s) System Uptime and the Always-On TPM Web Profiler

Cliff Click highlights the rock-solid stability of Azul's hardware in production, noting that several customer deployments maintain uptimes exceeding a year. Within Azul, the engineering boxes used for day-to-day development rarely experience crashes unless physical infrastructure fails: “The standard engineering box that they do daily work on at Azul now goes down when we have power failures and that's it.” He jokes that the last catastrophic outage happened when Google accidentally severed the chilled water supply line feeding their data center.

Turning to monitoring, Click showcases the Thread Priority Manager (TPM) or live JVM inspector, which he ranks as the platform’s second-best feature behind pause-free garbage collection. It allows developers to view internal JVM operational metrics through any standard web browser without imposing measurable overhead. Responding to audience questions about whether it continuously streams data, Click clarifies that it operates on a pull model: refreshing the web page pulls an instantaneous snapshot of live stack traces across running threads, their execution durations, and internal network telemetry like open sockets, I/O rates, and data endpoints.

- Systems regularly achieve over a year of uninterrupted uptime. - Engineering systems only go down due to external events (such as power outages or severed data center water lines). - The web-based inspection tool provides zero-overhead, always-on diagnostic snapshots across threads, stacks, and socket-level network traffic.

---

[51:20](https://www.youtube.com/watch?v=5uljtqyBLxI&t=3080s) Silicon Generations: Vega 2, Vega 3, and Beyond

Click details the evolution of Azul's proprietary multi-core chips across several iterations:

```mermaid flowchart TD accTitle: Azul Systems Vega Chip Evolution accDescr: Progression from Vega 2 yield harvesting to Vega 3 full core activation and architectural improvements.

subgraph V2["Vega 2 (48 Active Cores)"] direction TB V2_Clusters["6 clusters of 9 cores = 54 physical cores"] V2_Yield["1 core per cluster reserved for yield defects"] V2_Mask["Defective cores disabled with ion beam"] V2_Clusters --> V2_Yield --> V2_Mask end

subgraph V3["Vega 3 (54 Active Cores)"] direction TB V3_Yield["Fab yield maturity eliminates core masking"] V3_Features["All 9 cores per cluster enabled (54 total)"] V3_Upgrades["Bigger cache, faster bus & clock, generational GC, improved HTM"] V3_Yield --> V3_Features --> V3_Upgrades end

V2 -->|"Fabrication improvements"| V3 ```

Vega 2 packed 48 active cores alongside an upgraded clock rate, a higher-throughput memory bus, and an overhauled read-barrier supporting generational garbage collection. Under the hood, the die contained 54 cores organized into six 9-core clusters. The extra core per cluster served as a yield buffer against fab flaws: if one core had defects, an ion beam masked it out to deliver 48 operational cores. By the time Vega 3 arrived in 2008, manufacturing yields were sufficiently mature to eliminate core harvesting entirely, enabling all 54 cores across the die alongside larger caches, higher clock rates, richer hardware profiling, and refined Hardware Transactional Memory (HTM). Click mentions that a fourth-generation processor is currently under active development.

Because Azul compiles directly from Java bytecode rather than shipping legacy machine-code binaries, the engineering team had the freedom to drop unused instructions and reorganize opcode bit layouts across chip generations to simplify hardware decoding.

---

[52:31](https://www.youtube.com/watch?v=5uljtqyBLxI&t=3151s) Hardware/Software Co-Design Lessons: Bandwidth, GC, and HTM

Click turns to the strategic advantages of vertically integrated systems engineering: “If you own the whole stack, hardware and up, you can do progress even with some of the real awful hardware bugs, right?” Rather than waiting on multi-year silicon respins, the software team regularly patched hardware quirks at the compiler or OS level and permanently moved on.

When memory bus bandwidth forecasts threatened to bottleneck performance, the software team implemented a custom zero-overhead compression technique (CLZ) that cut required memory bandwidth by one-third, turning what hardware engineers considered a marginal architectural design into an optimal sweet spot.

On runtime behavior, Click reflects on several core design decisions: - **Garbage Collection:** Click asserts that GC is effectively solved across everyday commercial scales up to hundreds of gigabytes, even if it does not qualify as microscopic hard real-time execution. - **Hardware Transactional Memory (HTM):** Azul implemented simple HTM mechanisms to attempt automatic lock elision, but Click admits the real-world results were disappointing: “We can do lock elision with some very simple hardware transactional memory and it doesn't really help. It's very sad.” While HTM shows niche promise for multi-word compare-and-swap (N-CAS) primitives in specialized non-blocking data structures, it failed to deliver magic-bullet speedups for general-purpose application workloads. - **Massive Simple Core Counts:** Click confesses surprise at how successfully high volumes of simple, in-order RISC cores handle enterprise business logic, outperforming x86 machines on large parallel workloads despite having slower single-thread speeds.

---

[54:16](https://www.youtube.com/watch?v=5uljtqyBLxI&t=3256s) Why Major Chipmakers Hesitated: Intel and Sun

During the Q&A, an audience member asks why established chip vendors like Intel never integrated specialized read barriers and memory hooks directly into their CPUs. Click reveals that Azul engaged in extensive, frustrating discussions with Intel: “We have talked a lot within Intel and it's like moving the Titanic, you know. It doesn't matter how hard you push, it's just like a millimeters at a time.”

Click argues that adding hardware read-barrier traps would have allowed Intel or Sun Microsystems to dominate the enterprise server runtime market outright:

> “For Intel not to do a read barrier is like an obvious crying shame and a waste of, like, huge market potential for them to suddenly own the whole Java server market, right? For Sun not to have done it should have been a criminal offense on their—their stockholders should have sent their, you know, exec staff to jail for being, like—you know, after we did it and said, 'Oh, look what we can do,' that they didn't immediately announce that we're doing it on our next chip was just like criminal.”

When audience member Jerry points out that these primitives benefit every modern managed language, Click agrees that hardware support for managed runtimes is a universal win across any garbage-collected platform. Another attendee asks about binary compatibility and ECC memory; Click clarifies that Azul bypasses traditional OS/ISA binary constraints by adopting Java bytecode as its stable binary contract, freeing the underlying RISC microarchitecture to evolve without backward compatibility debt.

---

[56:42](https://www.youtube.com/watch?v=5uljtqyBLxI&t=3402s) Fast User-Mode Traps and Self-Healing Pointers

An audience member asks how the Azul processor eliminates the massive overhead typically caused by trap handling in hardware-assisted read barriers. Click explains that the cores utilize custom user-mode traps that bypass the operating system kernel:

```mermaid flowchart LR accTitle: Azul Fast User-Mode Read-Barrier Trap Handling accDescr: Fast user-mode trap flow showing low overhead entry, pointer patching in registers and memory, and fast return.

A["Read Barrier Detects Stale Bit"] --> B["4-Clock User-Mode Vector<br/>(No Kernel Transition)"] B --> C["Patch Register & Update Memory (40–50 Cycles)"] C --> D["Self-Healing Complete:<br/>Subsequent Loads Never Trap"] ```

1. **User-Mode Trap Vectors:** The processor traps directly into a pre-registered user-space function address in about four clock cycles without kernel intervention or context-switch overhead. 2. **Self-Healing Updates:** The handler updates both the CPU register holding the reference and the original memory location where the outdated pointer resided. 3. **Trap Storms Dissipate:** At the onset of a GC phase switch (when reference bit polarities flip), application mutator threads hit a brief burst of traps across their initial working set. Each trap costs roughly 40 to 50 clock cycles. Within a few hundred traps, mutators patch their active references, while background GC threads sweep ahead through heap memory to update remaining pointers. As a result, trap rates drop to near zero, making the overall overhead imperceptible even to high-precision hardware performance counters.

---

[58:45](https://www.youtube.com/watch?v=5uljtqyBLxI&t=3525s) Mitigating Stop-the-World Pauses: Ragged Barriers and Self-Preemption

An attendee asks how the runtime manages thread coordination and pauses across hundreds of active CPU cores during garbage collection passes. Click explains that full stop-the-world events occur only a few times per minute, while the vast majority of phase transitions rely on "ragged barriers":

```mermaid flowchart TD accTitle: Ragged Barrier vs. Cooperative Safepoints accDescr: Comparison of independent ragged barrier execution versus cooperative thread suspension during global safe points.

subgraph Ragged["Ragged Phase Transition (Non-Blocking)"] R1["Mutator hits phase boundary"] R2["Mutator checks own hot stack"] R3["Mutator signals completion & resumes work"] R1 --> R2 --> R3 end

subgraph Safepoint["Global Safepoint (Full Coordination)"] S1["Announce safepoint across all cores"] S2["Blocked / I/O threads park at safepoint automatically"] S3["Running threads self-preempt cooperatively"] S4["GC threads shoot down lagging uncooperative threads"] S1 --> S2 --> S3 --> S4 end ```

- **Ragged Barriers:** Cores reach GC phase boundaries independently. Each core pauses briefly to crawl and inspect its own stack—which is already hot inside its local L1/L2 caches—broadcasts an atomic completion signal, and immediately continues application processing. No global stall occurs, and the GC phase completes once the last core checks in. - **Cooperative Self-Preemption:** For the rare operations requiring a complete halt, threads anticipating blocking operations (such as I/O or sleep) automatically park at safe points beforehand. This reduces the number of threads requiring coordination from thousands down to just the active hardware execution contexts running on the CPU cores. The runtime broadcasts a safe point request, mutators cooperatively yield at compiler-inserted check sites, and GC threads intervene to preempt any lagging threads that fail to yield in time.

[01:00:32](https://www.youtube.com/watch?v=5uljtqyBLxI&t=3632s) Hardware-Assisted Safepoints and Stopping Threads

Cliff Click explains how the system rapidly halts threads at safe points using an infected, cooperative stopping mechanism. He compares the process to a cascading epidemic:

> “That, you know, Night of the Living Dead kind of race, where each guy that checks in now goes and helps the next guy check in kind of thing.”

Because of this log-tree propagation effect, bringing running threads to a standstill takes only microseconds when running tens of threads, and just a handful of milliseconds when coordinating hundreds of threads.

This rapid halting relies directly on hardware-level support. Each Azul processor core contains an internal status bit. When the JVM decides a safe point is required, it calls into the operating system to broadcast a request across every processor:

```mermaid flowchart TD accTitle: Safepoint Trigger and Trap Sequence accDescr: Sequence diagram showing how the OS and core hardware trigger safepoint traps on backward branches.

subgraph OS_Action["1. OS Broadcast"] A["JVM requests Safepoint"] --> B["OS sets trap bit on all cores"] end

subgraph Core_Action["2. Core Execution"] B --> C{"Core bit active & safe point instruction?"} C -->|Backward branch / safe point| D["Fast user-mode trap"] C -->|Normal execution| E["Continue execution"] end

subgraph Cascade["3. Check-in Cascade"] D --> F["Thread registers at safe point"] F --> G["Helps halt remaining threads"] end ```

The OS replicates the message across all cores to light up their safe-point bits in microseconds. Once set, whenever a core hits an instruction designated for safe-point polling—such as backward branch targets inside loops—the hardware executes a fast user-mode trap instead of executing the instruction normally. Because testing this state requires executing only a single instruction, threads rapidly trap and check in.

[01:01:54](https://www.youtube.com/watch?v=5uljtqyBLxI&t=3714s) Software vs. Hardware Stack Allocation and Escape Analysis

When asked whether Azul implemented hardware support for escape analysis and stack allocation, Click clarifies that it was never deployed to production. The Pauseless Garbage Collector performed so exceptionally well that engineering never felt the pressure to implement the hardware-assisted stack allocation mechanisms they had conceived.

Click notes that he has not seen industry or academic literature attempting runtime escape detection entirely in software, even though he has proposed the concept to multiple researchers. Azul had originally designed an aggressive escape-detection mechanism in hardware simply because they had full control over their silicon design. However, Click emphasizes that a software-based approach using just a handful of instructions could reasonably identify around 50% of non-escaping allocations, which would deliver massive performance gains for large heaps without dedicated silicon changes.

[01:02:47](https://www.youtube.com/watch?v=5uljtqyBLxI&t=3767s) Volatile Reads vs. Writes and the x86 Cost Model

An audience member asks how a Java programmer should balance algorithmic trade-offs between volatile reads and volatile writes when underlying CPU architectures treat them differently. Click half-jokingly advises developers to “throw up his hands,” before delivering a clear guideline:

> “You have to code the x86 platform and what's the cost model with volatile read versus a volatile on an x86 and everyone else has to live with whatever you do, okay?”

```mermaid flowchart TD accTitle: Architectural Cost Comparison of Volatile Operations accDescr: Comparison between volatile read and write latencies on x86 versus Azul hardware.

subgraph X86["x86 Architecture"] R1["Volatile Read"] --> CostR1["Equivalent to plain read (~1 clock)"] W1["Volatile Write"] --> Fence1["Requires memory fence"] Fence1 --> Miss1["Cache miss: ~300 clocks x 4 issues (~1000 lost ops)"] end

subgraph Azul["Azul System"] R2["Volatile Read"] --> CostR2["1 clock (uncontended)"] W2["Volatile Write"] --> Fence2["1 clock write + 1 clock fence (uncontended)"] end ```

On x86 processors, a volatile read behaves almost identically to a standard memory load. A volatile write, however, requires an expensive memory fence. That fence forces a pipeline drain and a cache coherency stall, translating to roughly 300 clock cycles at a 4-wide instruction issue rate—costing the CPU roughly 1,000 instruction slots that simply fail to execute. Therefore, programmers targeting x86 must almost always prefer algorithms that favor frequent volatile reads over volatile writes.

On Azul's custom hardware, the trade-off is virtually nonexistent: - Uncontended volatile reads and writes take a single clock cycle. - A memory fence adds only a single additional cycle when there is no active contention between threads. - If an algorithm experiences high contention, it will not scale across hundreds of cores anyway.

Click adds that while concurrency expert Doug Lea is typically satisfied when algorithms scale efficiently up to 64 cores, Click constantly pushes him to make concurrent structures scale to hundreds of cores. Click has authored data structures that scale completely across all 864 cores, but because general programmers will not write algorithms at that level of concurrency, software must continue to favor volatile reads.

[01:05:22](https://www.youtube.com/watch?v=5uljtqyBLxI&t=3922s) Customer Education and Multicore Scaling Tools

Addressing how Azul interfaces with enterprise customers, Click describes the typical customer engagement cycle:

> “The usual story, the way it kind of goes is the first time you get into a customer's site, it's always an oh-my-God-save-my-bacon kind of thing.”

Customers generally bring in Azul when their absolute best engineers are completely stuck on scalability bottlenecks. Azul exposes the application's runtime behavior using the Real-Time Performance Monitor (RTPM): - RTPM provides immediate, fine-grained visibility into core stalls, lock contention, and cache pressure that engineers have lacked for years. - Customer teams quickly pinpoint bottlenecks in their own code and resolve them independently. - Click occasionally delivers focused lectures on concurrent software design patterns, but customer engineers usually take ownership of optimization once they understand the tooling.

Over time, that expertise permeates customer organizations, lifting the software engineering community's overall understanding of multicore scalability. Click draws a comparison to Google, noting that while Google relies on distributed memory architectures rather than massive shared memory, they face the exact same ongoing need to train incoming engineers on scalable design patterns.

[01:07:03](https://www.youtube.com/watch?v=5uljtqyBLxI&t=4023s) Academic Licenses and Language Support Boundaries

Asked why Azul does not broadly offer its platform to academic institutions to run arbitrary C or C++ workloads, Click explains that Azul lacks the engineering support capacity to debug arbitrary native toolchains for universities:

> “If you're on Java, we'll honor the contract on maintenance and guarantees and the works. If you're running with anything else, well then, that's just your problem.”

Despite those strict product boundaries, Azul collaborates with academia: - Several institutions have secured government research grants to acquire Azul hardware. - Azul provides academic licenses allowing remote access directly onto Azul appliances. - Doug Lea and various graduate students routinely log in remotely to execute massive, highly parallel, experimental algorithms compiled into standard Java bytecode.

[01:07:59](https://www.youtube.com/watch?v=5uljtqyBLxI&t=4079s) Hardware Architecture: Register Windows and Pre-Zeroed Store Buffers

Click details the CPU register organization and memory subsystem design of the Vega processors: - **Register Architecture**: The CPU employs variable-sized hardware register windows split into two distinct stacks: a dedicated register stack and a standard C-style execution stack, making function calls extremely cheap. - **Window Size**: The Vega 3 processor settled on 64 windowed registers. Instruction traces revealed that the hardware spill-and-fill engine accounted for well under 1% of total processor clock cycles, rendering further microarchitectural optimization of the spill engine unnecessary. - **Store Buffers**: While contemporary commodity chips rely on deep store buffers to prevent processor stalls during allocation bursts, Vega 3 operates efficiently with a store buffer depth of only two entries.

Click explains why Vega requires such small store buffers compared to x86 and SPARC: - Standard architectures like SPARC and x86 require large write buffers because new object allocations trigger immediate bursts of zeroing stores against memory lines that are not present in L1 cache, causing immediate misses. - SPARC added giant write buffers specifically to absorb these rapid zeroing bursts without stalling execution pipelines. - In contrast, Azul processors pre-zero cache lines directly within the L1 data cache just in time for allocation. Because newly allocated memory arrives already zeroed and hot in the L1 cache, the JVM avoids issuing explicit zeroing writes altogether, drastically lowering total store traffic and eliminating store-buffer stalls.

[01:10:05](https://www.youtube.com/watch?v=5uljtqyBLxI&t=4205s) Garbage Collection Mechanics and Heap Headroom

An audience member asks about the specifics of Azul's collector algorithm and whether it uses a copying collector. Click confirms that the engine is a concurrent, compacting, copying collector that relocates and compacts the entire heap every single GC cycle, citing the comprehensive details published in the VEE 2005 paper co-authored with Paul Lucchesi and others.

Addressing questions regarding memory overhead and heap wastage: - The system easily dedicates spare CPU cores to continuous garbage collection tasks without impacting application throughput. - Traditional stop-the-world collectors force administrators to run heaps dangerously close to OutOfMemory limits to minimize garbage collection pause lengths. - Because Azul eliminates pause times entirely, deployments deliberately provision heaps with generous buffer headroom ("slop"), relieving allocation pressure and giving the concurrent collector plenty of runway to run without risking an out-of-memory crisis.

[01:11:28](https://www.youtube.com/watch?v=5uljtqyBLxI&t=4288s) Garbage Collection Headroom and Wrap-Up

Wrapping up an answer regarding garbage collector headroom and heap margins, Cliff Click explains the trade-off between heap headroom and processor utilization. When running with tight margins, the collector simply has to work much harder to keep up: “the GC cycle is faster and faster, it burns CPU.” He notes that the system is fully capable of operating under these constrained conditions, stating, “But it will comfortably run at, you know, 10%, 20% over live heap.” However, running with only a 10% to 20% cushion beyond the live data set comes with an operational penalty: “You'll just be burning a lot of CPU to do it.”

Click cautions that while the runtime will not fall over or crash when pushed into such tight bounds, dedicating that much processing power solely to recycling memory is inefficient: “This is--it's not necessarily where you want to set yourself.” With that final insight on GC sizing and headroom trade-offs, the attendee thanks Click, and Click closes out the presentation by thanking the audience.

- **Headroom vs. CPU Overhead:** Operating at 10% to 20% above live heap size is technically sustainable for the Azul collector, but it drives up collection frequency and consumes significant CPU cycles that would otherwise be available for application throughput. - **Session Conclusion:** The talk concludes with audience appreciation and Click’s closing thanks.

## Notable quotes > [03:24](https://www.youtube.com/watch?v=5uljtqyBLxI&t=204s) You must have like a really, really good reason to buy custom hardware for the obvious X86 solution. And, you know, a merely 5x price performance kind of gain is not really good enough to make people jump ship there. — Cliff Click

> [52:31](https://www.youtube.com/watch?v=5uljtqyBLxI&t=3151s) If you own the whole stack, hardware and up, you can do progress even with some of the real awful hardware bugs, right? — Cliff Click

## Mentioned ARM Jazelle, Azul Systems, Cliff Click, Doug Lea, ECOOP, GCC, Google, Google TechTalks, HP-UX, HotSpot, Intel, JBoss, Pauseless Garbage Collector, Paul Lucchesi, Real-Time Performance Monitor (RTPM), Rock processor, SPARC, Sun Microsystems, Symbolics, TSMC, Thread Priority Manager (TPM), VEE 2005, Vega, Vega 1, Vega 2, Vega 3, WebLogic, WebSphere, high-scale-lib, picoJava, x86

## Video description Google Tech Talk August 12, 2009

ABSTRACT

Presented by Cliff Click, Azul Systems.

Azul Systems designs and builds systems for running business logic applications written in Java. Unlike scientific computing, business logic code tends to be very large and complex (greater than 1MLOC is common), display very irregular data access patterns, and make heavy use of threads and locks. The common unit of parallelism is the transaction or thread-level task. Business logic programs tend to have high allocation rates which scale up with the amount of work accomplished, and they are sensitive to Garbage Collection max-pause-times. Typical JVM implementations for heaps greater than 4 Gigabytes have unacceptable pause times and this forces many applications to run clustered.

Our systems support heaps up to 600 Gigabytes and allocation rates up to 35 Gig/s with pause times in the dozen-millisecond range. We have large core counts (up to 864) for running parallel tasks; our memory is Uniform Memory Access (as opposed to the more common NUMA), cache-coherent, and has supercomputer-level bandwidth. The cores are our own design; simple 3-address RISCs with read- & write-barriers to support GC, hardware transactional memory, zero-cost high-rez profiling, and some more modest Java-specific tweaks.

This talk is about the business environment which drove the design of the hardware (e.g. why put in HTM support? why our own CPU design and not e.g. MIPS or X86?), some early company history with designing our own chips (1st silicon back from the fab had problems like the bits in the odd-numbered registers bleeding into the even-numbered registers), and finally some wisdom and observations from a tightly integrated hardware/software co-design effort.

[Source](https://www.youtube.com/watch?v=5uljtqyBLxI)

中文简报

Azul利用定制芯片解决Java停顿问题,而硬件事务内存则未达预期 硬件辅助的垃圾回收读屏障成功消除了海量企业级堆内存的停顿时间;相比之下,由于应用吞吐量的瓶颈在于数据依赖和I/O而非锁竞争,硬件事务内存未能带来实际的性能提升。 Cliff Click博士概述了Azul Systems定制Vega处理器架构的设计理念与技术演进,该架构可扩展至864个一致性RISC核心,以运行庞大的企业级Java工作负载。他详细介绍了关键的架构创新,包括硬件辅助读屏障、快速用户态陷阱、缓存行清零以及扁平的统一内存访问(UMA)拓扑,这些技术共同实现了在数百吉字节堆内存上的无停顿垃圾回收。演讲坦率回顾了早期硬件启动阶段的灾难性事件——例如严重的芯片缺陷、第三方IP故障和电源爆炸,并将这些实际经验与业界在硬件事务内存方面的探索进行了对比。Click在最后分析了定制芯片与通用x86架构之间的实际性能权衡,解释了为何芯片中针对运行时的专项特性始终优于靠强力堆砌的硬件复杂性。 Azul Systems开发了定制的Vega RISC处理器,在扁平的统一内存访问(UMA)拓扑中可扩展至864个缓存一致性核心,因企业级Java工作负载缺乏空间数据局部性而明确摒弃了NUMA。 (0:00) 硬件辅助的垃圾回收读屏障和定制的用户态陷阱向量,使得在高达600 GB的堆内存及35 GB/s的分配速率下能够实现并发、无停顿的回收,将停顿时间限制在10至15毫秒内。 (44:54) 用于自动锁消除的硬件事务内存(HTM)几乎没有带来实际性能提升,因为企业级应用的瓶颈绝大多数被I/O、数据库以及共享计数器上的序列化所主导。 (10:21) 专用的缓存行清零(CLZ)指令消除了向未初始化地址分配内存时的读缺失,显著降低了30%的内存总线带宽消耗。 (12:00)

Reading summary

Azul Systems addressed enterprise Java bottlenecks by co-designing custom multi-core hardware and software tailored for high concurrency, replacing traditional NUMA layouts and standard memory hierarchies with custom silicon primitives. According to Chief JVM Architect Dr. Cliff Click, eliminating garbage collection pauses and memory bus saturation proved far more critical to real-world application scaling than academic concurrency mechanisms like hardware transactional memory. Abandoning NUMA for Uniform Memory Architecture (0:00) Azul built systems combining up to 16 dies into an 864-core cache-coherent machine, rejecting the Non-Uniform Memory Access (NUMA) paradigm common in high-core architectures. Click argued that enterprise Java exhibits irregular memory access patterns with virtually no predictable spatial locality, meaning 15 out of 16 memory references in multi-socket systems inevitably target remote controllers. Attempting NUMA optimizations for the rare local accesses added complexity without performance gains. Instead, Azul implemented a flat Uniform Memory Access (UMA) structure backed by supercomputer-class interconnect bandwidth. Physical memory transactions were fine-grain striped across all memory controllers using a semi-random hash. By intentionally equalizing the latency of local and remote operations, the system distributed the electrical and bandwidth load evenly across the entire machine. Hardware Primitives for Bandwidth and Allocation (12:00) To prevent memory bus saturation across dozens of active cores, Azul introduced specialized CPU-level instructions. The Cache Line Zero (CLZ) instruction zeroed cache lines directly inside the L1 cache just in time for new allocations, bypassing the need to read uninitialized lines from main memory over the bus. Click reported that this optimization achieved a measurable 30% reduction in required memory bandwidth. Because newly allocated memory was already zeroed and hot in L1, the processor functioned effectively with a store buffer depth of only two entries. The architecture also embedded runtime metadata directly into the unused upper 20 bits of 64-bit pointers. The hardware masked these bits before driving physical address buses, allowing the JVM to perform predicted subclass checks during virtual method dispatches without dereferencing object memory headers. In addition, Azul decoupled memory ordering from atomicity, allowing fence-free, single-cycle compare-and-swap (CAS) operations in L1 caches for uncontended synchronization. Hardware Transactional Memory Versus True GC Bottlenecks (10:21) Although Azul integrated hardware transactional memory (HTM) for transparent Java lock elision, Click observed that it failed to produce dramatic real-world concurrency breakthroughs. HTM could not bypass true data dependencies, such as unread global performance counters incremented inside transactions, which inevitably forced serialized execution. Early implementations also suffered from livelock under high contention, requiring OS-level fallback locks to guarantee forward progress. In practice, Click asserted that garbage collection, rather than locking synchronization, was the true operational bottleneck for enterprise scaling. Traditional stop-the-world pauses forced operators to subdivide workloads across multiple small JVM instances. Azul shifted engineering priority toward its Pauseless Garbage Collector—a concurrent, compacting, copying engine that relocated the entire heap continuously, holding pause targets around 100 milliseconds across hundreds of gigabytes. Fast Traps and Cooperative Safepoints at Scale (56:42) Managing thousands of concurrent threads during garbage collection required custom hardware traps and coordination protocols. Rather than relying on heavy kernel transitions, the processor implemented four-cycle user-mode traps for GC read barriers. When a thread hit a stale pointer reference, the fast trap patched both the active CPU register and underlying memory in 40 to 50 cycles, causing initial trap storms to dissipate rapidly as active working sets self-healed. To coordinate phase shifts across hundreds of active cores without disruptive global stalls, the runtime relied primarily on non-blocking ragged barriers, where individual cores briefly scanned their own L1/L2 cache-hot stacks before resuming execution. For global pauses, each processor core featured a dedicated hardware polling bit set via OS broadcast. When active, cores encountered backward branches and entered user-mode traps to self-preempt, using a cascading log-tree check-in that brought hundreds of threads to a halt within milliseconds. Azul demonstrated that massive core scaling succeeded by optimizing runtime realities—such as memory bandwidth and GC pause elimination—rather than chasing academic concepts like bytecode execution in silicon or pure transactional memory. However, developing proprietary processors carried immense operational costs, including hardware bring-up defects, single-thread clock limitations, and the maintenance burden of upstream software patches.

精炼阅读摘要

Azul Systems 首席 JVM 架构师 Cliff Click 指出,面对千核规模的企业级 Java 负载,标准商用硬件的瓶颈在于垃圾回收停顿与内存带宽,而非锁同步机制;唯有通过软硬件协同设计重塑内存架构与运行时支持,才能消除扩展限制。 放弃 NUMA 与硬件级带宽优化 (12:00) 传统高核数系统通常采用非一致性内存访问(NUMA)架构,但 Click 强调,企业级 Java 业务逻辑呈现高度不规则的内存访问模式,缺乏有效的数据局部性,多插槽系统中往往高达 15/16 的访存请求跨芯片发生,导致 NUMA 策略失效。为此,Azul 选择了扁平的统一内存访问(UMA)架构,将内存访问跨全部控制器和芯片进行哈希条带化,保证所有内存访问拥有可预测且均等的延迟。 针对数十个核心并发产生的高频缓存未命中和总线竞争,Azul 在硬件层面设计了 CLZ(Cache Line Zero)指令。传统垃圾回收分配新对象时,往往需要从主存读入未初始化缓存行再进行写零操作,造成严重的冗余带宽消耗;CLZ 指令直接在 L1 缓存中即时完成写零,完全不触发向主存的读请求。Click 指出,仅此一项优化就在实际运行中降低了大约 30% 的内存带宽消耗,有效缓解了并发内存流水线的饱和压力。 软硬件协同的无停顿垃圾回收与陷阱机制 (56:42) Click 指出,在大规模并发系统中,应用水平扩展的真正瓶颈是全堆垃圾回收带来的全局停顿(Stop-the-World),而非应用层锁竞争。为了在数百 GB 堆内存上消除停顿,Azul 实现了并发压缩式复制回收器,并依赖底层硬件对 64 位指针高位元数据的支持。当硬件读屏障检测到指针状态陈旧时,会触发专用的快速用户态陷阱,在无需切换到操作系统内核的前提下,仅耗费约 4 个时钟周期完成跳转,并在 40 至 50 个周期内就地自愈修复寄存器与内存中的引用。 在线程协调方面,系统通过“不齐障语”(Ragged Barriers)让各核心独立就近检查自身热栈并提交阶段信号,极少需要全局停滞。若必须触发全局安全点(Safepoint),核心内的专用状态位与操作系统广播可在数微秒内将全核置入陷阱状态;随后运行中的线程在循环回边等位置协作式自挂起,并呈对数树状级联协助未停滞的线程就绪,从而使数百个活跃线程的全局对齐在数毫秒内平稳完成。 硬件事务内存与栈分配的现实取舍 (10:21) 学术界推崇的硬件事务内存(HTM)在 Azul 的实际工程中被证明显著受限。Click 解释,真实企业系统充斥着无法绕过的真实数据依赖(例如仅被递增但从未在本地读取的全局性能计数器),这些依赖会强行使事务执行串行化;且早期硬件事务极易在锁争用下发生活锁,迫使运行时必须编写复杂的后退路径以陷入重型操作系统锁来确保执行向前推进。Click 直言,尽管系统默认开启了 HTM 锁消除功能,但其很少带来革命性提升,因为瓶颈大多早已转移至网络、数据库或业务依赖上。 在对象分配层面,Azul 曾尝试利用硬件乐观检测来替代传统的静态逃逸分析。传统编译期逃逸分析面对复杂企业级代码时极其保守,栈分配率趋近于零;而硬件辅助的运行时逃逸检测则先假定对象生命周期局限于栈,当硬件捕获到指针向全局堆逃逸时再进行事后修正迁移。虽然实验证明该机制可使 60% 至 70% 的对象在栈上分配,但由于并发无停顿垃圾回收器成效卓越,团队最终因软件复杂度和工程优先级考量,未将硬件栈分配机制推向生产线。 第一代芯片流片缺陷与协同工程原则 (34:17) Azul 的首款 24 核芯片 Vega 1 在 2004 年从台积电代工交付时遭遇了灾难性硬件故障。因集成的第三方 DSP IP 核未经高频硅片验证即失效,导致芯片 L2 缓存大面积瘫痪、寄生电容耦合造成偶数寄存器写穿至奇数寄存器,甚至分支偏移解码错误污染全局状态。硬件与编译器团队迅速协作应对,不仅让芯片降频至三分之一、加压至五倍,还在软件端由 JIT 规避受损寄存器并对齐分支指令,随后利用原本预留在晶圆顶层的备用晶体管进行紧急金属层掩膜修改,绕过失效 IP 块完成硬件修复。 这套危机处理奠定了 Azul 软硬件协同设计的核心理念:简单的检测逻辑留在硬件,复杂的处理策略交由软件。Click 多次抵制硬件团队在芯片中直接执行 Java 字节码或构建复杂虚方法跳转缓冲区的建议,认为这既会因 JIT 优化后失去价值,又徒增硅片设计风险。相反,硬件应专注提供纯粹的高吞吐精简指令集(RISC)核心、高并发总线和细粒度异常陷阱,繁重的控制逻辑由完全可控的 JIT 编译器与定制操作系统共同承担。 去配置化部署与全核并发利用 (24:11) 在商用落地策略上,Azul 将其千核系统打包为即插即用的网络计算设备,允许现有企业级应用通过网络无缝桥接至专用执行引擎,绕过操作系统级驱动和补丁维护难题。部署时,工程师只需废除 HotSpot 所有的传统 GC 调优参数并扩充默认堆空间即可。因为停顿时间不再随堆体积线性暴增,多余的堆空间(Headroom)能够直接转化为无停顿收集器的周转余量;若仅留出 10% 到 20% 的紧缩余量,收集器为避免内存耗尽将频繁运转,白白消耗大量原本属于业务线程的算力。 当系统拥有数百个可用核心时,后台计算开销变得廉价。Azul 利用充裕的核心资源并发运行 30 至 50 个后台 JIT 编译线程,使大型业务系统在数分钟内将多 GB 的代码全部本地化优化完毕;同时将垃圾回收工作线程物理隔离在独立的 L2 处理器集群上,彻底避免了 GC 扫描全堆时污染工作线程的局部缓存。此外,无开销的常驻生产环境 Web 诊断分析工具(TPM/RTPM)能直接拉取任意正在运行实例的瞬时堆栈、锁竞争与套接字状态,排除了传统重现线上隐患的重构门槛。 Azul Systems 的工程实践证明,在数百至上千核心的极端并发环境下,定制硬件能够有效解决通用 x86 架构在内存总线和垃圾回收停顿上的结构性瓶颈;然而,由于企业级代码固有的数据依赖与开发维护成本,硬件事务内存和芯片级逃逸分析等激进特性在生产实际中收效有限,软硬件边界仍需收敛于简单指令支撑与高度灵活的软件运行时控制。

Detailed notes — zh

## Background 本内容由 Google TechTalks 频道于 2009 年 9 月 8 日在 YouTube 平台发布。视频记录了 Azul Systems 首席 JVM 架构师 Cliff Click 博士在 2009 年 8 月 12 日于 Google 举办的技术演讲,重点探讨了 Azul 针对企业级大型 Java 应用所研发的千核级定制硬件、超大无停顿堆内存架构,以及软硬件协同设计背后的商业驱动与工程教训。 ## TL;DR Cliff Click 深度复盘了 Azul 为解决企业级 Java 在多核扩展与垃圾回收(GC)长停顿瓶颈下自研芯片与操作系统的技术历程。演讲详细拆解了系统放弃 NUMA 转投 UMA 架构的考量、硬件级读写屏障与 CLZ(即时清零)指令带来的带宽收益,以及硬件事务内存(HTM)在实际工业界业务代码中的局限性。此外,Cliff 还生动回顾了首代 Vega 芯片流片遭遇奇偶寄存器渗血等严重硬件缺陷时的抢救过程,并阐释了软件负责复杂修复、硬件负责轻量检测的协同设计哲学,最终通过全堆并发复制压缩与零成本分析工具实现了超大堆的极低停顿运行。 ## Atmosphere & style 现场氛围极其硬核、幽默且充满了老练系统工程师的实战智慧。Cliff Click 以极具感染力且带有自嘲色彩的口吻娓娓道来,从调侃首版芯片“半死不活”的惊险事故,到吐槽传统半导体巨头决策迟缓的戏剧化吐槽,引得台下观众频频会心发笑。整场讲座既像是一场波澜壮阔的创业底层避坑实录,又是一堂直击体系结构本质的高阶公开课,互动环节的唇枪舌剑与犀利剖析更是让整个交流充满了求真务实的极客张力。 ## Bulletin - [01:06](https://www.youtube.com/watch?v=5uljtqyBLxI&t=66s) Azul Systems 针对企业级 Java 的无规整局部性特征,放弃 NUMA 架构,转而构建最多支持 864 核心全局缓存一致的平坦 UMA 架构与超高带宽互联系统。 - [12:00](https://www.youtube.com/watch?v=5uljtqyBLxI&t=720s) 通过软硬件协同引入 L1 缓存即时清零(CLZ)指令,消除了新对象分配时无用数据的读入,在实际生产中直接削减了 30% 的主存读取带宽。 - [46:15](https://www.youtube.com/watch?v=5uljtqyBLxI&t=2775s) 采用极速用户态陷阱与指针自愈机制,Azul 实现了并发标记与全堆复制压缩,支持在高达 500GB 堆内存与 35GB/s 分配速率下将最大停顿时间压缩至 10-15 毫秒。 - [10:21](https://www.youtube.com/watch?v=5uljtqyBLxI&t=621s) 硬件事务内存(HTM)在解决真实代码锁竞争上收效甚微,数据真实依赖与垃圾回收才是制约超多核系统水平扩展的决定性瓶颈。 ## Key takeaways - [16:08](https://www.youtube.com/watch?v=5uljtqyBLxI&t=968s) 企业级 Java 业务代码存在海量复杂对象图与高并发事务,缺乏规整的内存局部性,NUMA 优化在该场景下收效甚微,统一内存访问(UMA)结合条带化互联成为更优选择。 - [10:21](https://www.youtube.com/watch?v=5uljtqyBLxI&t=621s) 制约超大规模多核系统并发扩展性的核心瓶颈是垃圾回收的 Stop-the-World 停顿,而非并发锁竞争。 - [19:52](https://www.youtube.com/watch?v=5uljtqyBLxI&t=1192s) 软硬件协同设计遵循“硬件负责轻量检测、软件处理复杂恢复”的原则,避免将易失控的复杂逻辑(如指令级事务回滚、原生执行字节码)硬编码在芯片中。 - [12:00](https://www.youtube.com/watch?v=5uljtqyBLxI&t=720s) 新对象分配时引入 L1 缓存即时清零指令(CLZ),避免了针对新地址的底层主存陈旧数据预读,立竿见影削减了 30% 的访存带宽开销。 - [13:36](https://www.youtube.com/watch?v=5uljtqyBLxI&t=816s) 静态逃逸分析在百万行企业级代码中因过度保守而失效,硬件辅助的乐观逃逸检测则可将 60% 至 70% 的对象直接留在栈上分配。 - [17:56](https://www.youtube.com/watch?v=5uljtqyBLxI&t=1076s) 利用 64 位指针的高位冗余空间嵌入运行时元数据,不仅赋能低开销读屏障,还能无需间接寻址即实现虚方法调用的类型预测。 - [01:00:32](https://www.youtube.com/watch?v=5uljtqyBLxI&t=3632s) 基于硬件标志位与协作式自我抢占机制,系统可在数毫秒内将数百个高并发活跃计算线程安全地拉停进入安全点(Safepoint)。 - [26:54](https://www.youtube.com/watch?v=5uljtqyBLxI&t=1614s) 在海量简单核心算力过剩的架构下,将后台 JIT 编译与并发 GC 线程隔离到不同核心簇运行,可防止共享缓存被污染并实现零边际成本系统维护。 - [43:54](https://www.youtube.com/watch?v=5uljtqyBLxI&t=2634s) 硬件事务内存(HTM)受制于遗留代码中无处不在的真实数据依赖(如全局计数器),难以显著提升吞吐量,需依赖向操作系统锁的回退保障来避免活锁。 - [01:10:05](https://www.youtube.com/watch?v=5uljtqyBLxI&t=4205s) 全堆并发复制压缩算法消除了内存碎片,同时免除了繁复的 GC 调优参数;由于无停顿保障,生产系统可通过预留宽松的堆余量大幅释放性能。 - [56:42](https://www.youtube.com/watch?v=5uljtqyBLxI&t=3402s) 硬件读屏障触发的轻量级用户态陷阱仅耗费几十个周期,并能同步更新内存中的旧指针实现自愈,从而将屏障带来的吞吐量惩罚降至微不足道。 - [29:55](https://www.youtube.com/watch?v=5uljtqyBLxI&t=1795s) 模拟器必须在真实的物理多核环境上运行,否则无法暴露微架构与复杂并发时序下潜藏的底层数据竞态。 ## Detailed walkthrough ### [00:00](https://www.youtube.com/watch?v=5uljtqyBLxI&t=0s) 开场介绍与演讲背景 在 Google 的讲台前,主持人向现场观众隆重介绍了当天的演讲嘉宾——Azul Systems 的首席 JVM 架构师 Cliff Click 博士。主持人回顾道,Cliff 曾任职于 Sun Microsystems,并且是著名的 HotSpot 服务端编译器(C2)的首席架构师;今天他来到 Google,专门分享 Azul 在超多核架构以及软硬件协同设计(Hardware/Software Co-Design)领域的实战经验。 Cliff Click 登台后幽默地指出,听众从幻灯片风格或许能看出来,这些材料是他直接“复用”自之前在 ECOOP 大会上的主题演讲,但其中的技术细节极其丰富且有趣。 ### [01:06](https://www.youtube.com/watch?v=5uljtqyBLxI&t=66s) 自研芯片与大规格系统架构:UMA 与高吞吐 ```mermaid flowchart TD accTitle: Azul 自研多核系统硬件层级拓扑 accDescr: 展示从单核心、共享 L2 缓存、单芯片 54 核到整机 864 核对等互联的层次结构。 subgraph Die["Azul 单芯片 (Die) - 共 54 核"] subgraph Group["9 核核心簇 (共 6 组)"] C1["Core 1<br/>16KB I$ / 16KB D$"] C2["Core 2<br/>16KB I$ / 16KB D$"] CDots["... 9 Cores"] L2["共享 2MB L2 Cache"] C1 & C2 & CDots --> L2 end GSum["总计 6 组 L2 (12MB L2)"] end subgraph Box["整机系统 (Box)"] D1["Die 1 (54 核)"] D2["Die 2 (54 核)"] DDots["... 最多 16 个 Die"] D1 & D2 & DDots <-->|"一致性总线互联"| CohMem["统一平坦内存 (UMA架构)<br/>全系统 864 核缓存一致"] end ``` Cliff Click 详细介绍了 Azul 独特的软硬件自主研发路线。Azul 自行设计微处理器芯片,并交由台积电(TSMC)代工制造,再利用这些芯片组装成整机系统,其核心目标就是为了运行企业级业务 Java(Business Java)。在硬件参数上,该系统达到了极高的核心密度:每颗芯片包含 54 个核心,系统支持最多 16 颗芯片实现全局缓存一致性(Cache-Coherent),这意味着一台大型设备可拥有多达 864 个物理核心。 关于内存架构的设计取舍,Cliff 强调了 Azul 采取的非常规方案:他们并没有采用多核系统中极为普遍的 NUMA(非一致内存访问),而是坚持构建扁平、一致的 UMA(统一内存访问)架构。Cliff 直言企业级 Java 计算的内存访问模式极为混乱,程序员无法像科学计算那样精心组织数据局部性: > “And instead, we just give up on that and said, 'Okay, it's all minimum speed. There's no fast and no slow.'” 虽然单次内存访问没有“极快”的局部节点,但整机具备极高的互联带宽,时隔数年后在超级计算机带宽排行榜上依然稳居前 20。在缓存层次上: - 单核配备 16KB 指令缓存(I-Cache)和 16KB 数据缓存(D-Cache); - 每 9 个核心共享一个 2MB 的 L2 缓存; - 单颗芯片内共有 6 组这样的单元,折合单芯片 12MB L2 缓存,全芯片汇总起来具有可观的缓存容量。 ### [02:37](https://www.youtube.com/watch?v=5uljtqyBLxI&t=157s) 极简 RISC 核心与企业级 Java 的历史契机 Cliff 切换幻灯片后解释道,处理器的微架构采用了经典的 3-地址 RISC(3-address RISC)流水线,整体逻辑非常纯粹、简单。其时钟频率明显低于 x86 处理器,但换来的是单核硅片占用面积大幅缩小,完全去除了复杂的部件复制,指令都通过精简流水线执行。每个核心可承受若干个未命中的访存操作,每个 L2 能够维持多个预取请求;整台机器在满载时,可以在全系统范围内同时维持 2000 个以上未完成的(in-flight)在途内存引用,而系统充裕的带宽可以轻松承受这种高并发请求而不出现降速。 回顾创立 Azul 时的时代背景,正值 2000 年千禧年问题(Y2K)之后,各大企业逐渐意识到原有的 COBOL 代码库不仅庞大难以维护,而且老旧的 COBOL 程序员也已到了退休乃至离世的边缘,大型企业纷纷转向 Java 语言。瞬间,每年都有数以千万计的业务 Java 代码涌现出来,并天然具备线程级并行(Thread-Level Parallelism)的特征——应用服务器、JavaBeans、WebLogic、WebSphere、JBoss、线程池(ThreadPools)以及任务工作队列(Worklists)无处不在。 与此同时,半导体行业开始撞上“功耗墙”(Power Wall):时钟频率无法再盲目提升,否则芯片发热将不可控制。增加缓存已无太大收益,在频率停滞的背景下,芯片设计者唯一的出路就是堆叠更多核心。到 2009 年,高端游戏玩家的核心频率大约停留在 3.5GHz,廉价处理器大约在 2.5GHz,四核已经成为了行业标配底线。既然 Java 业务天然包含海量事务并发,那么多核、多线程的专用机器设计便成了极其自然的技术演进方向。 ### [04:57](https://www.youtube.com/watch?v=5uljtqyBLxI&t=297s) 定制硬件的理由与底层特性(GC 屏障与无屏障 CAS) 设计定制芯片面临的商业现实是非常残酷的。Cliff 剖析了当时的商业考量: > “Well, really, who buys custom hardware? You must have like a really, really good reason to buy custom hardware for the obvious X86 solution.” 他直言,仅仅相较于通用的 x86 方案实现 5 倍的性价比提升,根本不足以说服客户抛弃现有生态来采购专用硬件;系统必须具备根本性的不可替代优势。当时大型业务应用已经在 32 位堆内存的上限边缘挣扎,因此 Azul 彻底跳过 32 位阶段,全面转向纯 64 位堆内存架构,并针对垃圾回收(GC)和并发控制做了深度的硬件定制: - **硬件读写屏障**:基于读屏障(Read-Barrier)做垃圾收集的技术在学术界和 Symbolics Lisp 机时代早已存在了二十多年,Azul 在 CPU 中增加了少许硬件电路原生支持 GC 读写屏障; - **内存标签位之争**:软件团队曾提议在硬件内存中增加一个额外的标签位(Tag bit)来标记指针,但被硬件工程师断然否决。硬件团队坚决要求必须使用市场上标准通用的 64 位商用 DRAM,绝不能做 65 位的特殊内存; - **无内存屏障的快速 CAS**:在并发控制中,99% 的锁在实际执行时都是无争用(Uncontended)的。Azul 优化了硬件内存模型,使无争用的 CAS(比较并交换)可以直接在单核的 L1 缓存中命中,并在一个时钟周期的流水线内完成。此外,几乎所有通用 CPU 上的 CAS 指令都隐式绑定了一个内存屏障(Memory Fence),但对于 HotSpot 的加锁机制而言,这个屏障所处的位置并不理想,迫使 HotSpot 往往还需要在 CAS 之外额外插入一条屏障指令。Azul 提供了“无屏障 CAS(no-fence CAS)”,结合硬件支持的单周期快速 Fence 指令,大幅降低了性能计数器更新和无锁数据结构的开销。 ### [08:31](https://www.youtube.com/watch?v=5uljtqyBLxI&t=511s) 硬件事务内存(HTM)实现原理与锁消除的局限 关于在业界炙手可热的硬件事务内存(Hardware Transactional Memory, HTM),Cliff 披露了硬件层面的真实设计取舍与软件期望之间的落差。学术界曾认为事务内存能够将程序员从极易出错且复杂的粗粒度/细粒度锁机制中解救出来,但实际上工业界根本不可能大范围重写已有的全部程序。因此,Azul 引入硬件事务内存的根本目的不是定义新语言原语,而是结合硬件与运行时做“Java 锁消除(Lock-Elision)”。 在实现细节上,硬件团队设定了非常严格的红线:HTM 的所有支持严格限制在 L1 缓存层级,对 L2 缓存(即 Intel 所称的 LLC,末级缓存)完全透明。Cliff 解释道,L2 缓存作为数百个核心之间维护缓存一致性的汇合点,本身就已经是全系统复杂度最高的部件之一: > “There's no freaking way you're going to go in there and add some new weird-ass thing that no one knows if it's going to help or not.” ```mermaid flowchart LR accTitle: Azul L1 硬件事务执行与终止机制 accDescr: 说明 CPU 执行事务指令后,在 L1 缓存打标、冲突终止并回退到软件恢复机制的流程。 subgraph CoreL1["核心与 L1 缓存 (HTM 范围)"] Spec["执行 speculate 伪指令<br/>开启投机模式"] --> Mark["读写命中并打标<br/>设置 Spec-Read / Spec-Write 标记位"] Mark --> Check{"缓存行是否发生剔除<br/>或外部冲突失效?"} end subgraph Resolve["事务判定与回退"] Check --"无冲突"--> Commit["执行 commit 提交<br/>清除标记并保留修改"] Check --"发生冲突/剔除"--> Abort["执行 abort 终止<br/>直接丢弃 L1 中所有投机数据"] Abort --> SwFallback["软件恢复机制 (Software Recovery)<br/>重试事务 / 退化为重量级锁"] end ``` 具体工作流程如下: 1. CPU 增加了三条专属操作码:`speculate`(开始投机)、`commit`(提交)和 `abort`(终止); 2. 执行 `speculate` 指令后进入投机模式,L1 缓存中每行增加了特定的标记位,用来标记某一行属于投机性读(Speculatively Read)还是投机性写(Speculatively Written); 3. 如果由于容量不足或者总线一致性冲突,导致任何一个打标行从 L1 缓存中被剔除,硬件会立即触发 `abort`; 4. 一旦中止,L1 中所有标记为投机写入的未提交数据会被瞬间全盘丢弃,硬件直接将控制权移交给软件恢复机制; 5. 软件恢复机制负责决定是重新投机尝试若干次,还是退化(Fallback)使用重量级互斥锁。 在实际运行中,Azul 经常能够捕获长达数千条指令的超大事务,然而长期的实测结果却令人清醒:硬件事务内存带来的锁消除并不能为既有的遗留代码(Dusty-deck code)带来实质性的速度飞跃。这一残酷的现实也成为 Cliff Click 在后续演讲中持续剖析“为什么 HTM 并没有拯救世界”的核心话题。 ### [10:21](https://www.youtube.com/watch?v=5uljtqyBLxI&t=621s) 硬件事务内存的现实困境与真正的扩展性瓶颈 在大型并发程序中,事务内存(Transactional Memory)虽然听起来美好,但往往无法真正提高系统的并发线程数。其核心障碍在于程序中广泛存在的“真实数据依赖”(True Data Dependency)。无论采用硬件还是软件事务内存,一旦存在数据依赖,冲突检测就会触发中止。更滑稽的是,这种依赖往往源自极其琐碎的逻辑,比如某个根本无人查看的共享性能计数器——仅仅因为多个事务向同一个计数器累加 1,所有事务就必须串行化。要解决这个问题,工程师必须手动修改代码;然而 Cliff Click 尖锐地指出,一旦开发者愿意动手重构代码,那“为什么还要费劲改写成对事务内存友好的代码,而不是直接改成细粒度锁呢?”针对并发容器问题,Cliff Click 提到自己已经在开源项目 `high-scale-lib` 中提供了高效的无锁并发实现。 Cliff Click 强调,在拥有超高 CPU 核心数的大型多路系统中,真正扼杀可扩展性的从来不是锁竞争,而是垃圾回收(GC)。当堆内存变大、内存消耗速率增加时,GC 带来的停顿时间(Pause Times)会让系统性能彻底崩溃。客户因为无法承受数十秒甚至更长的停顿,不得不放弃单台大型机器,转而采用将应用切分成多个小型 JVM 进行集群部署的妥协方案。谈及硬件事务内存实现时,Cliff Click 顺带对比了 Sun 公司的 Rock 处理器(Niagara 架构路线的后续研发),指出 Azul 的硬件事务内存不会因为函数调用、TLB 缺失或嵌套锁等细枝末节就莫名其妙地中止(Abort),其稳健性远胜 Sun 的 Rock 处理器,但他也坦言硬件事务内存并不能拯救世界:“它不可能拯救世界。实际运行中,当机器扩展到海量核心时,阻止系统扩展的是 GC,而不是锁。” - 真实数据依赖的典型反面教材:无人问津却被频繁累加的全局共享性能计数器。 - 开源解决方案:Cliff Click 编写的 `high-scale-lib`(包含高度优化的并发哈希表等无锁数据结构)。 - 硬件对比:Azul 的硬件事务实现比 Sun 的 Rock 处理器更加健壮,避免了 Rock 因函数调用或 TLB Miss 频繁中止的设计缺陷,但依然受限于业务代码本身的数据依赖。 - 架构妥协:传统 JVM 面对大堆时因 GC 停顿过长,迫使企业只能采用多实例小 JVM 集群(Clustering)。 --- ### [12:00](https://www.youtube.com/watch?v=5uljtqyBLxI&t=720s) 突破带宽墙:L1 缓存“即时清零”指令(CLZ) 回到 2000 年至 2002 年 Azul 着手设计芯片的时代,多核架构面临的最显著风险就是“内存带宽枯竭”。当核心数一路飙升至 54 核心时,每个核心都在运行独立的工作集,有着自己的缓存未命中(Cache Miss)并频繁访问内存。虽然 54 个核心对带宽的需求并非纯粹的 54 倍线性增长,但也极其惊人。在 Java 垃圾回收机制中,新对象的分配通常采用极高效的“碰撞指针”(Bump-pointer)方式。但这种机制的副作用在于,系统不断向全新地址写入数据,而这些地址自上次 Full GC 后从未被当前 CPU 访问过,早已被逐出缓存。 这种分配模式导致了持续不断的缓存未命中:CPU 必须先从主存中把旧的缓存行读入,紧接着立即用全零将其覆盖(Java 规范要求新对象内存必须清零),然后再填入实际业务数据。这部分从主存读入的数据完全是无用的废数据,读取唯一的目的仅仅是为了保证缓存一致性协议的所有权。为了消灭这一纯粹浪费带宽的开销,Azul 在硬件指令集中引入了 `CLZ` 指令(Clear Zero,即 L1 缓存内的 Just-In-Time 清零)。该指令允许硬件直接在 L1 缓存中把缓存行置零并获取独占权,而无需真正触发底层主存的读取请求。实测数据显示,这项小小的硬件改动在实际应用中直接削减了整整 30% 的主存读取带宽。 ```mermaid flowchart TD accTitle: Traditional vs CLZ Allocation Flow accDescr: 对比传统内存分配与 Azul CLZ 硬件即时清零指令在内存读取带宽上的差异 subgraph TRAD ["传统分配模式 (读取浪费)"] A1["Bump Pointer 分配新地址"] --> B1["L1 Cache Miss: 触发主存读请求"] B1 --> C1["从主存读入无用的陈旧数据"] C1 --> D1["CPU 写入全零覆盖缓存行"] end subgraph CLZ_FLOW ["Azul CLZ 硬件模式 (削减 30% 带宽)"] A2["Bump Pointer 分配新地址"] --> B2["执行 CLZ 指令: L1 Cache 直接置零"] B2 --> C2["绕过主存读: 仅通知一致性协议获取所有权"] C2 --> D2["直接写入业务数据"] end ``` - 内存带宽陷阱:每个核心独立运行 Java 线程,极容易因高并发 Cache Miss 榨干总线与内存控制器。 - 弱内存模型协同:Azul 采用了非常宽松的硬件内存模型(Relaxed Memory Model),赋予硬件更多乱序执行的机会来平摊和掩盖内存延迟。 - 核心效益:仅凭 CLZ 一项指令,Azul 就消除了大量不必要的所有权读(Read-for-Ownership),实现了实打实 30% 的读取带宽削减。 --- ### [13:36](https://www.youtube.com/watch?v=5uljtqyBLxI&t=816s) 逃逸检测 vs 逃逸分析:乐观栈上分配的威力 学术界和传统编译器对“逃逸分析”(Escape Analysis)有大量研究,但它在大型企业级应用中效果极差。静态逃逸分析依赖保守推导,编译器必须严格证明某个对象的生命周期不会逃逸出特定边界,才能安全地将其分配在栈上。对于小微基准测试,逃逸分析确实表现惊艳;但面对数百万行代码、依赖关系盘根错节的真实企业级商业系统(如 IBM 经常测试的大型交易系统),分析算法会迅速退化,由于无法证明对象的逃逸状态,最终逃逸分析的有效捕获率往往不到 20% 到 30%,甚至直接跌落到毫无统计意义的背景噪音水平。 为了打破这种僵局,Azul 另辟蹊径,采用硬件协同的“逃逸检测”(Escape Detection)取代纯软件的逃逸分析。逃逸检测完全摒弃了繁重的静态推导,采取彻底的乐观主义策略:默认假定几乎所有新分配的对象都具有栈生命周期,直接在栈上进行分配;同时在硬件和运行时层面对所有指针写入操作进行低成本的越界检测。一旦检测到指针被存储到了堆或超出当前栈帧的范围,系统才会进行事后修正(Fix-up)。这种乐观检测策略在大型企业服务器上取得了极为惊人的效果,成功将 60% 到 70% 的对象直接分配在栈上。由于栈内存会被反复循环利用,这不仅免去了昂贵的对象堆分配与垃圾回收开销,更直接消除了大量针对主存的读取与写入流量。 “对于那些大型应用程序,静态分析会迅速变得极度保守,以至于它们从逃逸分析中一无所获——完全无法证明任何东西能在短时间内保持非存活状态。” - 静态逃逸分析(Escape Analysis):保守性极强,在百万行复杂业务代码中准确率低于 20%-30%,难以释放硬件潜力。 - 动态逃逸检测(Escape Detection):彻底乐观,无预先全局分析负担,出错时靠事后修正弥补。 - 栈上分配比例:在真实大型企业级服务端负载中,Azul 的逃逸检测能够达到 60% 至 70% 的栈上分配率,大幅降低了内存读写流量与 GC 压力。 --- ### [16:08](https://www.youtube.com/watch?v=5uljtqyBLxI&t=968s) 面向吞吐量的架构:条带化内存与 UMA 哲学 单核性能的提升存在物理极限,Azul 从一开始就将系统定位于纯粹的“吞吐量机器”(Throughput Machine),其整体设计理念与多线程并发处理(如 Sun Niagara 路线)高度契合。Azul 芯片依靠大量并发核心独立发起内存未命中请求,并通过超高并发的数据返回流来跑满内存带宽。在物理芯片设计上,Azul 每颗处理器芯片均配备了 4 个内存控制器,并且摒弃了在 Java 环境中水土不服的非一致内存访问(NUMA)优化,转而采用全硬件条带化(Striping)与半随机哈希机制,将连续的物理地址均匀打散分摊到所有芯片的各个内存控制器上。 这一反常规架构决策源于 Cliff Click 对 Java 商业逻辑运行特征的深刻洞察。在典型的企业级 Java 业务中,对象图错综复杂,指针漫天飞舞,根本不存在所谓“这块内存全归当前核心使用、那块内存归其他核心使用”的规整局部性布局。如果将系统做成 NUMA 架构,在多芯片互联时,大约十五分之十六(约 94%)的访问请求必然是跨芯片的远端访问;如果费尽心机去优化那十六分之一的本地访问延迟,在整体吞吐量面前毫无意义。Azul 索性将本地内存访问与远端访问一视同仁:即使访问本地物理内存,信号也是从芯片管脚绕出再返回,承受与远端访问相同的延迟,彻底消除局部性热点。只有栈空间和新生代年轻对象等极少数能够确定局部性的场景才依赖硬件缓存,其余部分则完全依靠吞吐量机制消化。 “在商业逻辑的 Java 程序中,根本不存在任何合理的内存局部性布局。既然根本没有合理的布局,一切访问都是随机的,那么你十六分之十五的内存访问都会落在其他芯片的内存控制器上。” - 内存控制器布局:单芯片集成 4 个内存控制器,总线流量通过哈希机制跨芯片均匀打散,彻底消除热点控制器(Hotspotting)。 - 架构取舍:放弃追求 NUMA 的单次访问低延迟,转向极致的全局一致内存访问(UMA)总吞吐量,本地回环访问与远程访问开销持平。 - 短缓存行设计(Short Cache Lines):不仅有效降低了数据传输带宽消耗,更关键的是大幅降低了多核高并发环境下的伪共享(False-Sharing)几率。 --- ### [17:56](https://www.youtube.com/watch?v=5uljtqyBLxI&t=1076s) 胖指针元数据、协同自挂起与软硬件协同的拉锯战 在 64 位体系结构下,通常下层 40 到 42 位的虚拟地址空间就已经能够寻址数个 Terabyte 的物理内存,而高位的 20 位在常规处理器中不是全零就是全一。Azul 充分利用了这一冗余,将关键的运行时元数据(Metadata)直接塞进了 64 位指针的高位空间中。当指针真正流向硬件地址总线时,硬件会自动剥离这些高位标记。这些嵌入指针内部的元数据不仅在垃圾回收算法中扮演了不可替代的核心角色,还能用来极大加速多态虚方法调用(Virtual Calls):硬件和 JIT 可以直接在指针自身包含的类信息标记上执行子类预测检查,而无需先通过指针间接寻址读取对象头中的 Class 结构,大幅缩短了调用开销。 另一个极其关键的基础机制是多线程的“协同自挂起”(Cooperative Self-Suspension)。在 800 多个核心同时运转的大型机上,系统动辄需要让数千个处于并发运行(Runnable)状态的线程同时进入安全点(Safepoint)以执行 GC,这与普通系统中数千线程大部分处于 I/O 阻塞的状态有着天壤之别。Azul 设计了硬件级的协同自挂起机制,能够让数千个正在高速运转的线程在极短的毫秒级时间内全部安全停顿,达成全局一致,并在 GC 阶段结束后以同样极高的效率全部唤醒。 谈及软硬件协同设计(HW/SW Co-Design)的日常互动时,Cliff Click 笑着分享了他与硬件工程师之间充满火药味却又极其严谨的博弈日常。作为软件负责人的 Cliff 经常会跑到硬件工程师面前天马行空地提需求:“哎呀,我真希望有一条硬件指令能直接干成 X 这件事。”而硬件工程师往往会冷静地拿出一张纸,反手怼回来:“行啊,我可以给你做。但我用 3 个时钟周期、3 条单周期现有指令就能组合搞定 X。现在,请你给我解释一下,为什么这玩意的运行频率有这么高?重要性有这么大?以至于我们非得专门为你开辟一条新指令去干掉这 3 个时钟周期?”这种软件与硬件之间对晶体管成本与真实软件收益的残酷推敲,贯穿了 Azul 架构演进的始终。 - 指针元数据妙用:利用 64 位指针的高 20 位存储 GC 标记及类型预测元数据,实现虚方法调用的“零内存间接访问”预测。 - 毫秒级千线程安全点:专有的协同自挂起机制,能在数毫秒内协调数千个正在执行计算的活跃 Java 线程集体暂停与恢复。 - 软硬件博弈法则:任何新增定制指令的请求,都必须经受住“能否用 3 条单周期指令替代”以及“是否值得为之花费宝贵硅片面积”的极限考验。 ### [19:52](https://www.youtube.com/watch?v=5uljtqyBLxI&t=1192s) 硬件与软件的协同设计哲学:拒绝华而不实的功能 在与硬件设计团队的拉锯战中,Cliff Click 经常需要克制工程师们“在硬件中把一切做到极致”的冲动。硬件团队曾问他某些操作是否需要提速到 3 个时钟周期以内,Click 的回应十分务实:如果该操作每隔数千条指令才出现一两次,那就完全没必要为此大费周章。最终,这种博弈催生出了一种极其干净、精简的芯片架构——软件团队虽然没有得到所有想要的硬件特性,但换来的是一颗易于编程与调优的极简芯片。 硬件工程师还曾兴奋地提出各种“很酷”的硬件加速点子,比如像当年的 PicoJava 或 Jazelle 那样,在硅片上直接原生执行 Java 字节码。Click 当场坚决反对,告诉他们这早被证明是灾难性的方向:“Oh, my God, don't do that. It's been tried before. It's disastrous. What about JIT? Give me a nice JIT target.”他解释道,直接硬件执行字节码毫无意义:一方面硬件根本无法覆盖所有复杂的字节码,最终依然需要退回(bail out)到软件处理;另一方面,只要 JIT 编译器介入并生成优化后的机器码,硬件字节码执行器就会变得毫无价值。硬件团队还提议增加花哨的分支目标缓冲器(Branch Target Buffer, BTB)来加速虚方法调用,但 Click 指出,运行追踪数据显示他们极少执行直接寄存器跳转,因为 JVM 广泛采用了内联缓存(Inline Caches),软件真正需要的仅仅是标准的通用分支预测器。 ```mermaid flowchart LR accTitle: Hardware and Software Division of Labor accDescr: Diagram showing simple detection in hardware and complex fix-up in software. subgraph Hardware["硬件负责(检测与基础保障)"] H1["缓存行失效检测"] H2["GC 读写屏障检测"] H3["标准分支预测"] end subgraph Software["软件负责(复杂逻辑与修复)"] S1["HTM 事务失败恢复(无硬件回滚)"] S2["GC 对象重定位与垃圾回收"] S3["内联缓存 (Inline Cache) 优化"] end H1 -.->|"触发中止"| S1 H2 -.->|"触发陷阱/修补"| S2 H3 -.->|"支持高效跳转"| S3 ``` 两者的协同分工最终提炼为一条核心准则:“Complicated stuff you do in software. Simple stuff that's usually detection ends up going on in hardware.”(复杂逻辑留在软件,硬件只负责简单检测): - **硬件事务内存(HTM)**:检测缓存行被踢出属于硬件一致性协议(Cache Coherency)自带的免费机制,若在纯软件(STM)中实现往往会导致 10 倍的性能暴跌;但硬件不需要复杂的乱序执行引擎(Out-of-Order Engine)和寄存器重命名回滚机制,事务失败后的上下文清理和重试全部由软件完成。 - **缓存行清零(Cache Line Zeroing)**:为了避免内存屏障与锁绑定时阻塞清零流水线、拉低有效带宽,硬件清零操作被置于缓存一致性域之外,软件则以推测执行的方式处理清零逻辑与事务中止冲突。 - **GC 屏障与虚调用**:学术界实现软件读屏障(Read Barrier)通常会导致 10% 到 20% 的性能惩罚,而 Azul 通过硬件辅助检测将其开销降至近乎为零,同时虚调用的类型子类检查也依赖硬件检测、软件修补。 --- ### [24:19](https://www.youtube.com/watch?v=5uljtqyBLxI&t=1459s) 零摩擦交付架构:定制无状态 OS 与企业级落地 面对保守的企业级客户,一家初出茅庐的创业公司想要推销全新的硬件和操作系统几乎是不可能的任务。“No way customers buy funny new hardware from an unknown company and a funny OS they have to support as well,” Click 解释道。为此,Azul 打造了一套即插即用的无缝部署体验:客户只需在数据中心的机架上接入设备,安装 Azul 提供的 JDK 客户端,并将原有的 Java 应用程序指向该 JDK,程序即可原地起飞。从拆箱安装到在整个数据中心跑出 SPECjbb 顶尖峰值分数,全程仅需 10 分钟。这种架构甚至能够直接在现场为老旧的 Sun SPARC 或 HP 小型机加速千倍,同时免除了系统管理员维护新 OS、处理补丁包或陷入“DLL 地狱”的痛苦。 这套底层操作系统完全为 Java 定制,剥离了传统通用内核的所有包袱: - **无状态与零冗余**:没有设备驱动堆栈、没有陈旧的历史遗留代码、系统不设通用交换区(Swap),彻底根除了通用 Linux 等系统的“大内核锁”(Big Kernel Lock)瓶颈。 - **超大规模调度器**:针对几百个 CPU 核心与数以千计的就绪线程(Runnable Threads)专门编写了高并发调度算法,其承载规模远超传统操作系统的调度能力。 - **硬性性能保证(Hard Performance Guarantees)**:在单台承载海量 JVM 的大机架内,系统允许按优先级为高价值进程分配 CPU 和内存保底配额;空闲的系统余量则按尽力而为(Best Effort)原则分配给低优先级任务,以拉大其堆空间提升 GC 效率。 - **定制内存管理与容错**:为配合并发 GC,操作系统底层实现了任何现成 OS 都不具备的大批量、极速 TLB 重新映射与击落(Bulk/Fast TLB Remaps & Shootdown)。即便 Java 是强类型安全语言,Azul 依然坚持构建完整的虚拟内存保护机制以隔离 JVM 崩溃,其哲学是:“Well, you get bugs.” - **硬件自愈能力**:全栈集成 ECC 与 Chipkill 错误隔离,操作系统能够在运行时动态隔离并摘除损坏的 CPU 核心、损毁的缓存块或坏掉的物理内存芯片。 --- ### [26:54](https://www.youtube.com/watch?v=5uljtqyBLxI&t=1614s) 自研 CPU 的必然性与过剩算力的红利 对于 Azul 为什么不采购 MIPS 或定制 x86 而是全盘自研 CPU,Click 列举了残酷的现实约束:当时市场上根本买不到满足需求的 64 位多核芯片 IP。自研硬件所必需的特性——例如一级缓存(L1)ECC、寄存器堆奇偶校验(每个核心拥有 32 个架构可见寄存器及 64 个物理寄存器,54 核芯片总计拥有数千个物理寄存器,极易受单比特翻转影响)、带元数据剥离的访存屏障、支持硬件事务内存的访存单元(LSU),以及能承载超大规模扩展的内存模型——如果要在现有的 x86 芯片上对 LSU 和 L1 缓存进行侵入式大改,几乎等同于重写半颗 CPU。因此,团队选择利用开源生态自主移植 GCC 工具链并移植 HotSpot 虚拟机,自研了整个 CPU、互连架构和操作系统。 在拥有成百上千个核心之后,Azul 的核心运行策略转变为:“Anything we do on another thread is essentially free because we got more CPUs than we know what to do with.” 既然算力严重过剩,任何能够剥离到后台线程的任务都被视为“零边际成本”: - **大规模后台 JIT 编译池**:当大型企业应用启动时,系统会瞬间拉起 30、40 甚至 50 个编译线程在后台全速 JIT 编译,以每秒数兆字节的速度向代码缓存注入经过性能剖析(Profiling)的高质量机器码;只需两三分钟,整个系统即在静默中完成了全量动态优化。 - **物理隔离的后台并发 GC**:传统多核芯片上运行 GC 时,垃圾收集线程遍历并触摸堆内存中的所有对象,会彻底洗刷并破坏(Thrash)共享缓存,导致正在处理业务的 Java 工作线程(Mutators)因缓存冷缺失而性能暴跌。Azul 将所有 GC 线程调度到物理隔离的、属于其他核心集群的 L2 缓存上运行。由于 GC 只需在下一轮周期前完成即可,不存在毫秒级的争抢,因此即便这些 GC 线程在自身的 L2 缓存上承受几乎百分之百的缓存缺失,也绝不会污染业务线程的本地缓存热数据。 ### [29:55](https://www.youtube.com/watch?v=5uljtqyBLxI&t=1795s) 组建团队、模拟器开发与多核竞态的现实教训 在确定了基本架构设计后,Azul 面临的挑战是如何将纸面构想变成送往台积电(TSMC)的光罩和硅片。当时正值互联网泡沫破裂(dot-bust)时期,市场上流落着大量顶尖的工程师。Azul 趁机招揽了极具实力的硬件团队、操作系统团队以及虚拟机团队,随即展开将 GCC 和 HotSpot 移植到全新自研芯片的工作。为了能在没有实体硬件的情况下推进开发,团队同步编写了一套全系统模拟器。这套模拟器在当时高性能的 x86 机器上能够模拟出约 20MHz 的 Vega 芯片运算能力,足以将整个操作系统引导起来,并在仿真环境中跑完 HotSpot 以及大型业务应用。 团队围绕模拟器构建了许多强大的诊断工具,包括数据竞态检测器(data-race detector)、缓存未命中率分析工具、缓存布局可视化工具以及指令跟踪生成器。这些工具在 HotSpot 和业务代码中抓出了大量深层竞态 Bug。在此过程中,Cliff Click 总结出了一条至关重要的工程教训: > “Your simulators have to be run on a true multi-CPU machine or you will not get realistic [races]. That will happen in real life.”(你的模拟器必须运行在真正的多 CPU 物理机器上,否则你根本模拟不出真实世界中才会发生的竞态。) 当团队把模拟器从单 CPU x86 迁移到双 CPU x86 宿主机后,模拟环境里瞬间爆发了海量此前从未出现过的新数据竞态。即使模拟器内部逻辑原本就是在模拟多处理器体系,如果宿主物理机本身不是真正的多核并行,许多细微的时序交叉也根本无法在仿真中暴露。 ### [31:43](https://www.youtube.com/watch?v=5uljtqyBLxI&t=1903s) Vega 1 芯片规格与极度紧绷的 L2 缓存设计 第一代芯片 Vega 1 集成了 24 个核心,整体分为 3 个簇(Cluster),每个簇包含 8 个核心并共享 1MB 的二级缓存(L2 Cache)。在核心内部,每个核心配备 16KB 指令缓存(I-cache)和 16KB 数据缓存(D-cache),均为 4 路组相联(4-way associative),并带有针对硬件事务内存(HTM)的额外标记位与短缓存行设计。然而,作为共享枢纽的 1MB L2 缓存同样被设计成了 4 路组相联。 ```mermaid flowchart TD accTitle: Vega 1 Cluster Architecture accDescr: 展现 Vega 1 单个簇内 8 个 CPU 核心的 L1 缓存与共享 4-way 1MB L2 缓存之间的映射与过载冲突关系。 subgraph Cluster["单个簇(Cluster,共 8 核)"] subgraph Core0["CPU Core 0"] L1_0["L1 I/D Cache<br/>(16K+16K, 4-Way)"] end subgraph Core1["CPU Core 1"] L1_1["L1 I/D Cache<br/>(16K+16K, 4-Way)"] end subgraph OtherCores["CPU Cores 2-7"] L1_N["L1 I/D Caches<br/>(16K+16K, 4-Way)"] end L2["共享 L2 Cache<br/>1MB, 4-Way 组相联<br/>(严重超额认购 / Over-subscribed)"] end L1_0 --> L2 L1_1 --> L2 L1_N --> L2 L2 --> Interconnect["芯片间互联网络<br/>(最多支持 16 芯片一致性互联)"] ``` 懂得计算体系结构的工程师一眼就能看出其中的隐患:8 个核心各自拥有 4 路的 I-cache 与 4 路的 D-cache,却全部挤在一个仅仅只有 4 路的 L2 缓存上。这意味着 L2 的路数(ways)被严重过度认购(heavily over-subscribed)。只要其中 4 个 CPU 碰巧映射到 L2 的同一行,第 5 个 CPU 一旦访问相同行就会将第 1 个踢出去;随后 8 个核心就会在 L2 中陷入循环互相驱逐、频繁发生伪共享与冲突未命中的泥潭。Cliff Click 解释道,尽管明知风险巨大,但这已经是当时在芯片裸晶面积(die size)与良率极限之间权衡的产物——Vega 1 是台积电当时制造过的面积最大的芯片。 硬件架构的其他关键指标与设计特征包括: - **互联架构**:原生支持多达 16 颗芯片的高速互联,L2 未命中的访问开销与跨芯片访问另一个 L2 或直达本地内存的开销大致相当。 - **核心架构**:专为 JIT 编译器设计的经典按序执行(In-Order)64 位三地址 RISC 核心,单条 miss 下命中(one hit under miss)缓存支持,仅配备单项的存储锁存缓冲器(store latch/buffer)。 - **极简算力单元**:每个核心配备一个结构极为紧凑的完整浮点运算单元(FPU),无独立向量寄存器,没有标志寄存器(flags)或杂七杂八的历史模式位。 - **软硬件协同加速**:设计了后台自动寄存器溢出/填充栈(background spill/fill register stack),大幅削减多层嵌套调用(bushy call traces)的开销;内置针对数组边界检查与虚方法调用的专用指令。 - **垃圾回收硬加速**:高频执行的读屏障(read-barrier)被完全硬件化以保证极速运行;写屏障(write-barrier)替代了原本冗长笨重的卡表标记(card mark)指令序列。 ### [34:17](https://www.youtube.com/watch?v=5uljtqyBLxI&t=2057s) 2004 年首版硅片惊魂:“烤死”在机架上的瘸腿芯片 2004 年,第一批 Vega 1 硅片从台积电送回。台积电工程师带着装有芯片的箱子从台湾登上飞机,24 小时后出现在 Azul 的办公室。工程团队划开封装、放入探针台加电测试,迎面而来的却是致命的硬件故障。芯片并没有彻底报废,但处于一种极其严重的病态中: > “It's not quite dead. It's dead, gentleman. Not quite.”(它没有彻底死透。先生们,它死翘翘了——呃,其实还没完全死透。) 芯片的 L2 缓存大面积损坏,绝大多数无法使用,只有少数能在 ECC 纠错机制永无休止地报错纠错下勉强运转。团队被迫启动了所谓的“跛行回家模式”(limp home mode)——就像汽车变速箱内部爆炸报废后只能卡在一档挣扎着开回家一样。他们硬生生关掉了 1MB 4-way L2 中彻底烂掉的 3 个 way,只保留最后 1 个还能在海量 ECC 报错中苦撑的 way,将其降级为只有 256KB 的 1-way 单路缓存。 更匪夷所思的问题接踵而至: - **偶数寄存器向奇数寄存器“渗血”(Bleeding)**:在执行如 `ADD RX, RY -> RZ` 指令时,如果目标寄存器 `RZ` 是偶数号,写入的值会不可预测地渗透窜入相邻的 `RZ+1` 奇数寄存器中。为了让代码能跑,JIT 编译器不得不紧急修改分配策略,只使用所有寄存器的一个子集(仅偶数寄存器)。 - **分支偏移误触发解码**:指令解码器(instruction decoder)存在缺陷,在解析分支跳转指令时,竟然将分支偏移量的位(branch offset bits)误当成寄存器编号一并送入了解码单元。这导致分支跳转无论偏向奇数还是偶数偏移,都会触发相应寄存器堆地址端口的刷新,进而将随机数据写坏到错误的寄存器中。编译器团队被迫要求所有分支跳转地址必须对齐到特定的零位上(例如第四位强制为 0)。 - **超压降频与电子迁移(Electromigration)**:为了强行压制寄生问题并让寄存器堆勉强工作,团队只能采取大幅加压(达到正常电压的数倍)并降频到三分之一的极端手段。高压导致硅片内部发生剧烈的电子迁移,硅原子在晶格矩阵中物理漂移。巨大的风扇直接架在芯片上方发出刺耳的咆哮,芯片在疯狂过热中以大约一个月的寿命走向自我毁灭。 尽管硬件病入膏肓,操作系统团队却利用这批残存芯片完成了宝贵的实战演练:他们调试并通过了所有 ECC 错误处理例程、动态下线故障核心(de-configure bad CPU)代码以及灾难恢复逻辑,在最初的几个月里让这套重度残疾的系统硬生生把 OS 启动了起来。 ### [37:17](https://www.youtube.com/watch?v=5uljtqyBLxI&t=2237s) 金属掩膜改版(Metal-mask Spin)与真正的 Vega 1 点亮 团队随后向台积电追责并深入排查根因,发现问题出在从第三方供应商处采购的一组芯片 IP(主要源自 DSP 领域)。该供应商在其内部技术规范中声称该 IP 可以在 Azul 目标的高频率下运行,但此前该 IP 实际向客户出货的最高频率只有这一规格的二分之一到三分之一:在纸面上它理论达标,在实践中根本从未验证过,实际加电后自然全面崩溃。 所幸,芯片设计时保留了硬件工程的经典防御机制:硬件团队在流片时于芯片空白区域铺设了大量没有任何连接的备用晶体管(spare transistors)。当需要修正错误时,他们无需重新制作整套昂贵的光罩,只需进行一次金属掩膜改版(metal-mask spin): > “Instead of running this wire from here to there, I'm going to run it over here and do some of these transistors that I just left lying around for this purpose and then drag it back over here.”(与其把这根导线从这里连到那里,不如把它拐到旁边,接入我专门为了这个目的闲置在那里的备用晶体管,然后再把它拉回来。) 通过台积电当时留存的最后几层金属层未加工的晶圆批次,Azul 迅速完成了重新走线与改版。第二版硅片返回后表现出了极其出色的完好度(除了一个微小的安全代码修补外几近完美)。此前数以万计小时的模拟器投入瞬间迎来了回报: 1. **拿到第二版硅片两周**:操作系统顺利启动完成; 2. **一天后**:第一个 C 语言 “Hello World” 成功打印; 3. **四天后**:`java -version` 成功输出并运行。 ### [38:57](https://www.youtube.com/watch?v=5uljtqyBLxI&t=2337s) 性能调优:化解 4-Way 缓存冲突与栈对齐踩踏 即使第二版硅片硬件工作正常,系统在走向健壮稳定的道路上依然耗费了整整一年时间。Azul 打造的是一个拥有超高核数、弱内存模型且极度并发乱序的全新环境,软件生态中无数隐匿的底层竞态 Bug 在这一阶段集中爆发。 此外,性能瓶颈尤为突出。正如架构阶段所担忧的那样,由于 8 个核心争夺 4-way 共享 L2,系统出现了极其庞大的 L2 未命中率和 TLB 未命中率。深入排查调用特征后,Cliff Click 和团队发现了一个荒谬的重叠现象: - 系统内每个线程栈(stack)的基地址在内存中都是整齐划一地按 1MB 边界对齐的; - 应用程序在执行时,各个线程沿着各自的调用树深入到大致相同的深度; - 结果就是:8 个核心的栈在几乎相同的调用深度疯狂读写,其访问地址在模 1MB 之后全部落入 L2 缓存的同一组(Set)中。 8 个并发的线程栈为了争抢仅有的 4 个 way 大打出手,导致严重的自我驱逐和持续未命中。团队最终找到了一种举重若轻的解决办法:**在栈基址上引入随机偏移(random offsets)**。一旦将各个线程栈在内存中略微打散,栈顶便不再落在相同的 L2 缓存行上,该冲突瞬间烟消云散。随后,团队在代码缓存(code cache)中也应用了随机偏移技术,并结合操作系统层面的页面着色(page coloring),一举平息了初期可怕的缓存缺失风暴。 ### [40:03](https://www.youtube.com/watch?v=5uljtqyBLxI&t=2403s) 硬件与虚拟化:哪些成功了,哪些没有? 在硬件设计上,让一个 4 路的 L2 缓存共享 8 个 4 路的 L1 缓存,最终被证明是可行的。虽然缺失率完全在可容忍的范围内,但这并不是一蹴而就的,团队付出了巨大的努力才达到这一目标。此外,虚拟化层也遇到了不少问题。Azul 宣称其系统是“即插即用”的,通过对 JVM 进行虚拟化来实现这一特性,但早期的虚拟化程度还不够彻底,底层细节会暴露出来,团队不得不为此修正了大量的代码。 在经历了一系列改动和优化后,芯片在第二次金属层流片(second metal spin)后终于成功运转。它提供了极其充沛的带宽和令人难以置信的 CPU 周期。Cliff Click 指出,与 x86 架构相比,Azul 芯片在每瓦特性能(MIPS per watt)上具有压倒性优势,大约是 x86 的五倍。虽然预测性缓存缺失率在初期由于 L2 缓存敏感度较低而出现了一些奇怪的波动,但团队最终攻克并解决了所有这些问题。然而,CPU 的实际运行速度仍低于最初的预期,这主要是受限于顺序执行(in-order)、低主频的 CPU 设计,以及团队规模有限,无法像大型硬件厂商那样进行极其精细的硬件优化。 由于软件稳定性问题,许多硬件功能在很长一段时间内都没有开启。Cliff Click 坦言:“在产品达到极其稳固、坚如磐石之前,你无法把东西卖出去,尤其是卖给银行。”因此,软件团队当时正忙于解决基础的代码生成问题和数据竞争。与此同时,硬件团队在长达一年的时间里也在解决自己的麻烦,比如一些诡异的低频 DRAM 漏洞。这些漏洞很多时候被纠错码(ECC)掩盖了——硬件确实存在 Bug,但 ECC 一直在自动纠正它。硬件团队最终找出并修复了所有这些问题,但确实耗费了很长时间,主板也经历了多次迭代以解决与 DRAM 相关的时序问题。 - **每瓦特 MIPS 优势**:Azul 芯片的每瓦特 MIPS 比当时的 x86 芯片高出约 5 倍。 - **硬件功能延迟启用**:由于软件需要优先保证金融级客户所需的绝对稳定性,许多硬件特性初期被迫关闭。 - **DRAM 与主板问题**:低频 DRAM 漏洞因 ECC 自动纠错而极难被发现,主板经历了多次改版才解决时序问题。 --- ### [41:59](https://www.youtube.com/watch?v=5uljtqyBLxI&t=2519s) 令人意外的电源故障与系统级挑战 在所有遇到的硬件问题中,最让人意想不到的是电源。Cliff Click 原本以为购买电源是件省心的事,毕竟市面上有很多成熟的大型电源供应商。Azul 团队向这些主流厂商说明了规格,定制了 2500 瓦的电源。然而,当这些电源被送到实验室并加上 2500 瓦的负载时,它们竟然直接烧毁了。这让团队十分错愕,不得不与供应商反复交涉,经历了数轮折腾才最终解决电源的可靠性问题。 在操作系统层面,如何调度多达 800 个 CPU 也是一个巨大的挑战,这绝非一个“即插即用”的简单任务。同时,I/O 栈的虚拟化也带来了重重困难。虚拟化本身虽然高效,但要对 I/O 栈进行虚拟化却极其复杂。 此外,读屏障(read-barriers)也是一个持续的痛点。由于 Sun 公司的 JVM 实现中不使用读屏障,每次 Azul 从 Sun 整合新的代码时,都会引入新的、未加屏障的内存加载操作。这会导致一些发生频率极低、极难调试的垃圾回收(GC)问题。为了追踪这些问题,团队往往要耗费大量的时间。 ```mermaid flowchart TD accTitle: 读屏障缺失导致GC漏洞的因果链 accDescr: 流程图展示了从Sun公司整合代码到Azul系统时,由于缺少读屏障而导致低频且难以调试的GC漏洞的过程。 A["从 Sun 整合新代码"] --> B["引入未加屏障的内存加载 (Un-barriered Loads)"] B --> C["破坏 Azul 的并发 GC 机制"] C --> D["产生极低频、极难调试的 GC 漏洞"] D --> E["耗费大量工程时间进行追踪与修复"] ``` --- ### [43:05](https://www.youtube.com/watch?v=5uljtqyBLxI&t=2585s) 垃圾回收的演进与高频 Full GC 暴露的 Bug 在最初的设计中,Azul 的垃圾回收器是单分代的(single generation)。这意味着每次进行 GC 循环时,都是一次完整的 Full GC。当时,无论堆内存有多大(即使是数百吉字节的堆),一次 GC 循环的停顿时间也仅为 100 毫秒左右。然而,问题在于这种 GC 循环每 5 秒就会执行一次。 相比之下,如果运行 Sun 的原生代码,Full GC 期间会执行一些平时不做的操作,而普通的业务系统通常一天才进行一次 Full GC。由于 Azul 每 5 秒就进行一次 Full GC,这导致 Sun 代码中那些只有在 Full GC 时才会触发的隐藏 Bug 被无限放大。Azul 团队因此发现了大量与 Full GC 行为相关的 Bug。虽然如今分代 GC 已经更加高效,但在当时,每 5 秒一次的 GC 循环确实让团队在排错上吃尽了苦头。 在内部,工程团队经常就研发优先级展开激烈的辩论。争论的焦点在于:是应该专注于系统稳定性,还是开启硬件事务内存(HTM)?是启用栈分配(stack allocation)与逃逸检测,还是提供更大的线程池以缩短启动时间?此外,还有分层编译(tiered compilation)、分代 GC 等一系列特性在排队。 - **Full GC 频率对比**:普通系统一天仅运行一次 Full GC,而早期的 Azul 系统每 5 秒就运行一次,从而暴露了大量隐藏在 Sun 源码中的并发与 GC 漏洞。 - **单次停顿时间**:即使在数百 GB 的超大堆内存下,Azul 的单次 Full GC 停顿也仅需 100 毫秒左右。 --- ### [43:54](https://www.youtube.com/watch?v=5uljtqyBLxI&t=2634s) 内部工程论战:硬件事务内存(HTM)与栈分配的博弈 由于工程人力有限,硬件事务内存(HTM)支持和栈分配逃逸保护在早期都因为“正确性实现难度极高”而在优先级上败下阵来。诊断和修复这些并发问题需要耗费大量的时间。与此同时,Azul 的工程师们还不得不协助销售团队去应对客户的咨询。很多客户的代码本身存在并发漏洞(数据竞争),这些漏洞在 x86 平台上因为时序关系可能一天才崩溃一次,但在 Azul 或 Sun 的多核机器上,由于并发度极高,每 10 分钟就会崩溃一次。客户往往不愿承认是自己的代码有 Bug,这给销售带来了极大的阻碍。 就 HTM 而言,其性能在很长一段时间内都受到 Bug 的困扰,主要表现为活锁(live lock)。当系统尝试通过事务来获取锁时,可能会因为某种原因失败,接着系统会不断重试,导致无法向前推进,陷入无休止的失败循环。 为了解决这个问题,团队设计了一种回退机制:在事务失败后,系统会退回到操作系统锁(OS lock)以确保程序能够继续运行。在系统进入稳态后,再定期重新尝试使用 HTM。如果运行良好,系统就会逐步提升事务的比例,从而获得更高的吞吐量。如今,HTM 已经默认开启并随系统出货了三年。Cliff Click 评价道: > “它极少能帮到客户——正如我在另一个演讲中说过的——但它也绝无坏处。” 在极少数情况下,HTM 能带来 2 倍的性能提升,但在大多数情况下,它对吞吐量没有明显贡献。这并不是因为 HTM 本身不好,而是因为系统存在其他瓶颈,比如真正的内存数据依赖,或者瓶颈根本不在锁上,而是在网络或数据库速度上。 ```mermaid flowchart TD accTitle: HTM 活锁回退与重试机制 accDescr: 流程图展示了Azul系统在硬件事务内存(HTM)遭遇冲突或活锁时,如何回退到操作系统锁以确保程序运行,并在系统进入稳态后重新尝试HTM的机制。 A["开始事务 (HTM)"] --> B{"事务是否成功?"} B -->|是| C["提交事务并继续"] B -->|否| D["发生冲突/活锁"] D --> E["回退到操作系统锁 (OS Lock)"] E --> F["保证向前推进 (Make Progress)"] F --> G["系统进入稳态 (Steady State)"] G --> H["重新尝试 HTM"] H --> A ``` --- ### [46:15](https://www.youtube.com/watch?v=5uljtqyBLxI&t=2775s) 栈分配的放弃与垃圾回收(GC)的终极胜利 栈分配(Stack Allocation)也面临着类似的窘境。在理想情况下,它的表现非常出色,繁忙的大型应用可以将极高比例的对象分配在栈上。然而,它的最坏情况却非常糟糕,而团队已经没有足够的精力去解决这些极端情况下的问题。更重要的是,Azul 的标准垃圾回收器(GC)已经做得足够优秀,这直接削弱了优化栈分配的动力。 如今,Azul 的标准 GC 表现惊人。在生产环境中,有客户运行着 300 GB、400 GB 甚至 500 GB 的超大堆内存,分配速率高达每秒 35 GB,而最大 GC 停顿时间依然控制在 10 到 15 毫秒之间。这种表现比当时 x86 平台上的最佳水平还要好上几个数量级。因此,栈分配这一特性最终被放弃了。 在开拓新客户时,Azul 的部署过程通常非常简单:安装好设备,启动客户现有的命令行,删掉其中所有陈旧复杂的 GC 调优参数,将默认堆大小翻倍,然后直接运行。此后,客户就再也没有遇到过任何 GC 问题。 当被问及“堆内存翻倍”是否是解决问题的关键时,Cliff Click 解释说,这其实是多重因素共同作用的结果。Azul 的 GC 没有任何调优参数,Cliff Click 强调: > “如果它运行得不好,那对我们来说就是一个 Bug,我们会去修复它,不管你的应用是什么,也不管它在进行什么形式的 GC 循环。” 将默认堆大小翻倍可以消除许多边界情况。在传统平台上,由于害怕 GC 停顿,用户会极力压榨堆空间,甚至为了节省内存而采用一些非常丑陋的内部设计(例如刻意限制缓存大小)。一旦解除了 GC 停顿的紧箍咒,客户就可以立刻扩大他们的缓存,整个系统的运行效率也会随之大幅提升。 - **超强 GC 性能指标**:支持 300GB - 500GB 堆内存,每秒 35GB 分配速率,最大停顿时间仅 10 - 15 毫秒。 - **零调优参数**:Azul 的 GC 摒弃了传统 JVM 繁琐的调优参数,将性能不佳视为需要官方修复的 Bug。 - **释放缓存潜力**:解除 GC 停顿限制后,客户可以放心增大应用缓存,从而大幅提升整体业务吞吐量。 --- ### [48:38](https://www.youtube.com/watch?v=5uljtqyBLxI&t=2918s) 零成本生产环境分析工具的奇效 除了强大的硬件和 GC,Azul 还开发了一款非常酷的内部性能分析(Profiling)工具。虽然它的名字起得很难听,但首次看到它的客户几乎都会强烈要求立刻使用它。如今,它已经成为了 Azul 系统的主要卖点之一。 该工具允许用户直接通过浏览器连接到已经在生产环境中连续运行了一个月的虚拟机上,实时查看 JVM 内部的所有运行细节。它是默认开启且始终运行的,几乎不占用任何额外开销。通过它,开发和运维人员可以直观地看到线程栈、GC 循环、堆内存分布、热门锁(hot locks)以及调用栈轨迹(caller/callee saves profiling data)。 在实际生产中,经常会遇到这样的棘手问题:一个虚拟机已经稳定运行了一周,突然遭遇流量洪峰,吞吐量瞬间跌入谷底。在传统的 QA(质量保证)测试环境中,这种问题几乎无法复现,因为测试人员无法模拟连续运行一周后再加上特定触发条件的复杂场景。而有了这款工具,运维人员无需尝试复现,只需直接打开浏览器接入生产环境,就能立刻看清底层的症结所在。 - **零开销常态化监控**:该分析工具在生产环境中始终开启,对运行性能几乎无影响。 - **全方位可视化**:支持通过浏览器直观查看线程、GC、堆、锁及调用栈。 - **解决无法复现的生产故障**:针对运行数天后突发的性能骤降,可直接在线诊断,无需在测试环境艰难复现。 ### [49:51](https://www.youtube.com/watch?v=5uljtqyBLxI&t=2991s) 系统稳定性与实时监控(TPM 与网络剖析) 在硬件与系统软件打磨成熟后,Azul 系统的稳定性达到了极高水准,部分客户系统的连续运行时间(uptime)甚至超过了一年。在 Azul 内部,工程师日常用于开发的主机几乎从不断机,除非遭遇机房断电。Cliff Click 打趣地提到,那台主力机上一次发生严重硬宕机,是因为外部工程事故:“上一次它彻底瘫痪,是 Google 切断了通往我们数据中心的冷却水管。” 随后,Cliff 展示了系统的 TPM(Thread Path Monitor)监控机制。他强调这是 Azul 虚拟机中地位仅次于无停顿 GC 与高负载稳定性能的第二大王牌特性——它允许管理员通过任意标准 Web 浏览器,实时深入查看任何运行中 JVM 的内部运行状态。该特性具备持续开启(Always on)且零开销的优势。其工作原理采用主动拉取(Pull)模型:用户在浏览器中每一次刷新,就会抓取一份全新的调用栈快照,查看特定线程当前的执行位置及持续运行时长。此外,系统还在虚拟机内部集成了类似 `netstat` 的网络监控能力,能够实时追踪 JVM 内部所有打开的套接字、经由这些套接字进出的 I/O 吞吐量、具体执行的任务以及数据流向。 - **超高稳定性**:部分生产系统连续无故障运行超过 1 年,内部开发服务器仅在遭遇外部电力中断或冷却水管道事故时才会停机。 - **TPM 实时分析**:通过 Web 浏览器随时调取 JVM 线程堆栈,零探针性能开销,支持秒级连续刷新抓取。 - **VM 级网络诊断**:在虚拟机底层直接透视 Socket 状态、实时 I/O 速率与通信链路。 --- ### [51:20](https://www.youtube.com/watch?v=5uljtqyBLxI&t=3080s) 芯片演进(Vega 2 到 Vega 3)与软硬件协同设计的教训 Cliff 随后梳理了 Azul 自研芯片的演进路线。Vega 2 芯片在几年前发布,单芯片具备 48 个核心,拥有更高的时钟频率与更快的内存总线。为了支持分代垃圾回收(Generational GC),硬件团队调整了读屏障(Read Barrier)机制;同时为了便于硬件人员做指令解码,修改了部分指令的二进制编码格式,并剔除了一些低频指令。而在 2008 年发布的 Vega 3 芯片则将可用核心数提升至 54 个。Cliff 透露了一个有趣的工程秘密:其实在 Vega 2 阶段,每个计算簇(Cluster)就已经做进了 9 个核心,但当时为了应对晶圆制造的良品率(Yield)问题,不得不将其中 1 个作为冗余备用。测试时一旦发现某个核心存在缺陷,就用离子束在掩膜层面将其切除屏蔽,从而确保每颗芯片稳定输出 48 个完好核心;而到了 Vega 3,由于半导体工艺良率大幅提升,Azul 不再需要做这种屏蔽阉割,直接将 9 个核心全数开放(6 个簇共计 54 核心),并配备了更大的缓存、更高的主频以及更完善的硬件事务内存(HTM)和性能剖析支持。目前团队已在研发第四代芯片。 谈及软硬件协同设计(HW/SW Co-Design)的心得,Cliff 强调了垂直整合的巨大红利:“如果你掌控了从硬件往上的整个技术栈,哪怕遇到一些真正恶劣的硬件 bug,你依然能够取得进展。”在 Azul 的研发历程中,许多匪夷所思的芯片缺陷都是直接在软件层编写变通方案(workaround)解决的,团队甚至懒得去硬件底层重新流片修复。相反,面对“内存总线带宽耗尽”这类极度棘手的纯硬件物理瓶颈,软件团队通过引入前导零计数(CLZ)技术实现了引用压缩,将内存带宽占用直接砍掉整整三分之一,原本捉襟见肘的硬件设计瞬间回到了性能最佳甜点区。在垃圾回收领域,Cliff 自信地断言该问题在“小型到超大内存”范围内已被彻底攻克(虽然硬实时与极微型嵌入式场景除外)。而在硬件事务内存(HTM)方面,其实际表现却令人沮丧:利用简单 HTM 实现的锁消除(Lock Elision)在日常业务负载中收效甚微,除了在极少数并发专家编写 N-CAS 算法时能提供一些不可替代的黑魔法外,普通程序员根本无法直接从中受益。然而,“大量简单核心”的架构路线在生产实践中被证明极为成功,其处理并发企业级任务的能力完全颠覆了传统 x86 的表现。 ```mermaid flowchart LR accTitle: Vega 芯片良率与核心开放演进 accDescr: 展示 Vega 2 利用备用冗余核心保证良率,到 Vega 3 工艺成熟完全释放 54 核心的过程。 subgraph V2["Vega 2 架构"] A["每簇设计 9 核心"] --> B["离子束熔断 1 个缺陷核心"] B --> C["实际启用 8 核心 × 6 簇 = 48 核心"] end subgraph V3["Vega 3 架构"] D["半导体工艺良率显著提升"] --> E["保留全部 9 核心无需屏蔽"] E --> F["完全开放 9 核心 × 6 簇 = 54 核心"] end ``` --- ### [54:16](https://www.youtube.com/watch?v=5uljtqyBLxI&t=3256s) Q&A:为何主流厂商未能跟进硬件读屏障与字节码兼容优势 现场观众提问:既然 Azul 如此多的特性都围绕垃圾回收展开,Intel 这样的半导体巨头难道不可行采用类似做法吗?Cliff 无奈地表示,Azul 曾与 Intel 进行过大量深入沟通,但对方的决策机制迟缓得令人绝望:“这就像是在推动泰坦尼克号,不管你用多大的力气去推,它每次也只挪动几毫米。”Cliff 情绪激动地抨击了当时主流厂商的保守:“对 Intel 来说,不做读屏障显然是一种莫大的遗憾,白白浪费了借此彻底统治整个 Java 服务器市场的巨大潜力;而对 Sun 来说,没能做成这件事简直称得上是一场渎职犯罪,在看到我们做出来并展示了惊人效果之后,他们的股东真应该把管理层送进监狱,因为他们竟然没有立刻宣布在下一代芯片上跟进,这简直不可理喻。”现场听众 Jerry 补充指出,硬件屏障不仅造福 Java,所有依赖垃圾回收的托管运行时(Managed Runtime,如.NET 等)都能借此获得飞跃,这本该是一场多方共赢。 针对观众关于二进制兼容性与指令集迁移的疑问,Cliff 解释了 Azul 的解题思路。由于传统芯片厂商被向下二进制兼容(如 x86 机器码、ECC 等)的历史包袱死死套牢,任何指令层面的调整都阻力重重。而 Azul 面向客户的底层逻辑根本不存在机器码级别的二进制兼容承诺。Azul 的真正二进制兼容层直接建立在“Java 字节码”这一抽象之上。只要保证字节码能够精准执行,芯片团队在底层微架构、指令集编码乃至指令增删上享有绝对的自由,从而彻底甩掉了困扰 Intel 数十年的兼容性枷锁。 --- ### [56:42](https://www.youtube.com/watch?v=5uljtqyBLxI&t=3402s) Q&A:自愈式用户态陷阱与高并发线程停顿控制 针对观众关于“读屏障触发硬件陷阱(Traps)的开销如何抹平”的深入提问,Cliff 详细拆解了其极速异常处理机制与“自愈(Self-healing)”算法。在硬件层面上,Azul 实现了超轻量级的快速用户态陷阱(Fast User-mode Trap),完全绕过了操作系统内核的介入(Zero Kernel Hopping)。硬件触发读屏障陷阱本质上只是一次跳转到固定地址的函数调用,仅需约 4 个时钟周期完成上下文装配,整体调用与返回开销仅约 40 至 50 个周期。更精妙的是指针自愈设计: > “算法的工作方式是,当你更新导致故障的值(即寄存器中的值)时,你同时也会更新内存中那个发生故障的值,这样下一次加载它时就不会再触发陷阱。” 这意味着工作线程(Mutator)在遍历自身工作集的过程中,会以极低代价顺手清除眼前的一切未修复指针。在 GC 阶段切换(Phase Slip)翻转正确标记位的瞬间,虽然会产生瞬间的突发陷阱(Trap Storm),但工作线程在各自抛出几百次陷阱后便迅速进入平稳期,陷阱发生率呈现断崖式下跌;与此同时,后台 GC 线程也在前方全速推进,抢在工作线程访问前翻转指针标记。这种极短的陷阱震荡由于持续时间极短、次数极少,以至于精密的高级硬件性能计数器都很难测出其对吞吐量的负面影响。 ```mermaid flowchart TD accTitle: 读屏障快速用户态陷阱自愈流程 accDescr: 说明工作线程在遭遇读屏障失效时,通过无内核参与的用户态陷阱同时修正寄存器与内存指针的过程。 A["工作线程从内存加载对象引用"] --> B{"指针标记位是否有效?"} B -- "有效(命中)" --> C["正常执行,零额外开销"] B -- "无效(失效)" --> D["触发快速用户态陷阱(约 4 周期)"] subgraph TrapHandler["用户态陷阱处理(约 40-50 周期,无内核参与)"] D --> E["更新寄存器中的对象引用"] E --> F["同步写回内存修正该指针(自愈)"] F --> G["直接返回并恢复执行后续指令"] end G --> H["下次加载同一内存地址不再触发陷阱"] ``` 随后,观众追问在多达数百上千个核心与线程的超大并发环境下,系统如何消除垃圾回收周期中暂停所有线程(Stop-the-World)带来的恐怖停顿。Cliff 澄清道,系统的全局停顿通常相隔数分钟才会出现一次,绝大多数 GC 阶段的推进采用的是参差屏障(Ragged Barrier)机制:每个核心在到达预设检查点时独立处理自身的调用栈(完全命中在各核心的高速缓存中),向全局宣告完成后便立即恢复运行,没有任何核心会因此被强制挂起等待。而在极少数必须全局完全暂停的校准点上,Azul 采用了高效的“协作式自我抢占(Cooperative Self-preemption)”机制: - **过滤阻塞线程**:任何准备执行阻塞操作(包括系统调度切出)的线程在离开前必须先将自身置于安全点(Safe Point)。因此,在成千上万个线程中,需要处理的仅仅是当前真正在 CPU 物理核心上运行的区区数百个活动线程。 - **并发猎杀机制**:全局停顿信号发出后,这几百个活动线程会优先尝试主动协作进入安全点;与此并行的是,GC 专属线程会以极高优先级在硬件层面向那些未及时响应的非协作线程发起点对点“击落”与状态剥夺,从而将全局等待最后一个线程入列的停顿窗口压缩至微秒级极限。 ### [01:00:32](https://www.youtube.com/watch?v=5uljtqyBLxI&t=3632s) 安全点机制与逃逸分析的软硬件权衡 在面对多达数百个并发线程时,系统暂停所有线程进入安全点(safe point)的过程展现出一种类似于“活死之夜”(Night of the living dead)式的连锁反应:每一个完成签到(check-in)并暂停的线程,都会反过来协助下一个线程签到,从而形成一种对数树状效应(log-tree effect)。Cliff Click 指出,当系统中有数百个运行线程时,通常只需要几毫秒就能将所有线程彻底拉停;而如果只有几十个线程,整个暂停过程甚至仅需微秒级即可完成。 这种极高的响应速度依赖于底层硬件的深度协同。Azul 的芯片在每个核心上都配备了一个专门的硬件标志位。一旦操作系统发出请求,指示所有核心进入安全点,操作系统会将该信号快速广播至所有核心,点亮对应的硬件位。在执行包含安全点检查的指令(例如循环回跳指令 backwards branch)时,处理器不会继续常规执行,而是会触发一个极快的用户态陷阱(fast user-mode trap)。整个通知和标志位置位的过程在微秒内便可就绪,各个线程随之迅速签到暂停。 针对现场观众关于硬件逃逸分析与栈上分配支持的提问,Cliff Click 坦言 Azul 最终并未将其投入生产,核心原因在于垃圾回收器本身的表现已经极其出色:“GC 的效果太好了,以至于我们始终没腾出精力去做硬件栈逃逸分析和栈分配支持。”(“The GC was so good that no one--that we never got around to doing the hardware's--the stack--the stack escape analysis--stack allocation support.”)就他所知,业界至今也没有人在纯软件层面实现运行时的逃逸检测原型,尽管他曾向多人极力推荐这一思路。Cliff Click 认为,虽然硬件可以实现激进的逃逸分析,但在软件层面仅用几条指令也能搭建一个相对简易的版本,只要能达到 50% 的栈分配捕获率,就足以给超大堆内存应用带来巨大的性能收益。 ```mermaid flowchart TD accTitle: 安全点触发与线程协同暂停流程 accDescr: 描述从操作系统发起安全点请求,到芯片硬件位置位,再到线程通过陷阱暂停并协助其他线程签到的完整链条。 subgraph OS_HW["系统与硬件层"] A["操作系统发起安全点请求"] --> B["硬件信号广播至所有 CPU 核心"] B --> C["置位各核心专用硬件标志位<br/>(耗时微秒级)"] end subgraph Core_Trap["核心执行层"] C --> D["执行回跳分支等关键指令"] D --> E["检测到标志位,触发快速用户态陷阱"] end subgraph Thread_Sync["线程协同层"] E --> F["首批运行线程签到并暂停"] F --> G["已签到线程协助未停线程<br/>(对数树状连锁效应)"] G --> H["数百个线程全数暂停<br/>(耗时数毫秒)"] end ``` --- ### [01:02:42](https://www.youtube.com/watch?v=5uljtqyBLxI&t=3762s) 内存模型之争:Volatile 读写的硬件开销与扩展瓶颈 在 Java 并发编程中,算法设计常常面临在 volatile 读与 volatile 写之间进行取舍的难题。现场观众提问,既然底层硬件体系差异巨大,Java 程序员究竟该如何选择成本模型?Cliff Click 开玩笑地回答说程序员只能“举手投降”,但从现实工程角度来看,开发者必须以 x86 平台的行为为基准进行编码,其他硬件平台只能被动去兼容这种决策。 在 x86 架构下,volatile 读的开销几乎等同于普通的内存读取,但 volatile 写则必须伴随一条内存屏障(fence)。该内存屏障会导致极具破坏性的缓存未命中(cache miss),造成巨大的流水线停顿,其代价相当于白白损失了上千条指令的执行周期。因此,面对 x86 平台时,编写并发算法的基本铁律就是无条件优先倾斜 volatile 读操作。 ```markdown | 架构平台 | Volatile 读开销 | Volatile 写开销 | 竞争时的核心扩展表现 | |:--- |:--- |:--- |:--- | | **x86 架构** | 接近普通读取(约 1 个周期) | 附加内存屏障,引发缓存未命中,造成约上千个周期的指令发射损失 | 争用随核心数剧增,多核扩展性急剧恶化 | | **Azul 硬件平台** | 无争用时仅需 1 个时钟周期 | 包含屏障仅需 2 个时钟周期(写 1 周期 + 无冲突屏障 1 周期) | 支持针对数百个 CPU 核心优化的高度无锁伸缩算法 | ``` Cliff Click 解释说,在 Azul 的自定义硬件上情况则完全不同:在不存在线程数据争用的前提下,读或写都只需要 1 个时钟周期;即便是包含内存屏障的 volatile 写,屏障本身在无争用时也仅仅耗费 1 个时钟周期。然而,一旦多线程之间出现了激烈的竞争,任何并发算法都很难自然扩展到数百个 CPU。正如 Cliff Click 谈到业界大师 Doug Lea 时的调侃与坚持:“Doug 在扩展到 64 核时就很满足了,但我会逼着他说:‘不,不,照这个改。’然后它就能跑到几百核了。”(“Doug's happy when he goes to 64, but then I beat on him and say, 'No, no. Do this' and it goes to hundreds.”)由于能够写出面向数百核并发算法的工程师极度罕见,普通开发者在编写代码时应当无脑偏向 volatile 读。 --- ### [01:05:22](https://www.youtube.com/watch?v=5uljtqyBLxI&t=3922s) 客户现场攻坚、性能教育与学术合作的边界 谈及如何帮助企业客户解决极限规模下的性能瓶颈,Cliff Click 分享了 Azul 团队在工业界的推广经历。通常情况下,客户首次寻求 Azul 协助都是处于焦头烂额的“救命时刻”(“oh-my-God-save-my-bacon”),彼时客户自己最优秀的工程团队早已深陷泥潭、无计可施。Azul 的做法是直接向客户展示系统底层的运行机制,并引入实时性能监控工具(RTPM, Real-Time Performance Monitor)。客户的高级工程师在看清底层细节后往往如梦初醒,凭借 RTPM 填补了多年来监控工具的盲区,迅速定位并重构了自身代码中的性能瓶颈。 随着硬件在客户数据中心扎根,编写高伸缩性代码的技术逐渐从少数专家扩散至整个技术组织。业界对并发瓶颈的认识在缓慢提升,Google 在分布式内存领域也在推动类似的教育,整个软件生态对伸缩性的认知正在逐渐演进。 面对现场关于是否向高校开放硬件以开展学术研究的提问,Cliff Click 阐述了公司在技术支持资源上的权衡考量: - **工程支持瓶颈**:Azul 团队规模有限,无力为高校科研团队可能遭遇的各种工具链故障与低级错误提供全天候的售后兜底服务。 - **维保服务界限**:商业合同有明确保障条款——如果客户在 Azul 设备上运行标准 Java 程序,Azul 会全权承担维护与运行保障;但如果要在裸机上折腾其他非标准底层软件,一切技术风险必须由用户自行承担。 - **学术合作实践**:Azul 支持高校通过政府科研基金采购设备,同时也向部分学者发放学术许可。例如 Doug Lea 以及若干高校研究生会定期远程登录 Azul 服务器,运行大规模的并行奇异算法,但前提是所有程序均运行在 Java 字节码层面。 --- ### [01:07:59](https://www.youtube.com/watch?v=5uljtqyBLxI&t=4079s) 硬件微架构:寄存器堆栈、Store Buffer 与无停顿分配 当现场探讨起 Azul 处理器的微架构细节时,Cliff Click 深入介绍了寄存器窗口(register windows)的设计。与传统 SPARC 架构机械固定的窗口不同,Azul 硬件采用变长寄存器窗口(variable-sized windows),并配备了双栈结构:一个独立的寄存器栈和一个标准的 C 语言执行栈。这种变长设计有效根除了 SPARC 上频繁发生的强制栈溢出溢出(spill/fill)问题。在 Vega 3 芯片中,寄存器窗口大小最终设定为 64。通过对硬件底层周期的跟踪分析,寄存器保存与恢复(spill-fill)引擎所占用的执行时间远低于 1%,证明这一硬件开销已完全脱离了关键瓶颈路径。 在存储缓冲区(store buffer)的设计上,Vega 3 也作出了极为反直觉的极简权衡: - **存储缓冲区极小化**:Vega 3 内部仅设计了深度为 2 的存储缓冲区,而非传统处理器的庞大缓冲队列。 - **L1 缓存预清零(Pre-zeroing)机制**:Java 运行时的新对象分配绝不会因等待写入行而停顿。硬件会及时在 L1 缓存中完成内存行的就地预清零,新分配的对象在生成时就已经热在 L1 缓存中,直接省去了大量的清零写入操作,消除了漫长等待。 - **与主流 CPU 策略的对比**:像 x86 和 SPARC 这样的通用芯片必须配置巨大的 store buffer,原因在于它们在分配新对象并置零时频繁触发缓存未命中,迫使处理器必须吞下整行甚至多行的写操作以防止流水线停顿。Azul 则是通过底层软硬件的协同重构,从根源上消除了这个场景下的内存停顿。 --- ### [01:10:05](https://www.youtube.com/watch?v=5uljtqyBLxI&t=4205s) 全堆并发标记复制与松弛堆内存策略 在回答有关垃圾收集器运作模式的问题时,Cliff Click 引用了 2005 年发表于 VEE(Virtual Execution Environments)会议上由 Paul Lucchesi 参与撰写的论文。他明确指出,Azul 的 GC 是纯粹的并发复制型收集器(copying collector):“我们每个周期都在复制。我们每个周期都会复制整个堆并完成内存碎片整理。”(“We copy every cycle. We copy the whole heap every cycle and compact.”) ```mermaid flowchart LR accTitle: Azul 垃圾收集器周期性复制压缩模型 accDescr: 展现 Azul GC 每个周期并发标记、全堆对象复制压缩与持续释放内存碎片的过程。 A["堆内存活动对象"] -->|"读屏障跟踪"| B["全堆并发扫描"] B -->|"每个周期全量复制"| C["连续紧凑内存空间<br/>(Compacting)"] C --> D["彻底消除内存碎片<br/>(保留安全余量)"] ``` 针对现场关于全堆复制是否带来资源浪费和 CPU 额外开销的质疑,Cliff Click 的回应非常从容:“额外的什么?额外的 CPU?我们手头最不缺的就是额外的 CPU。”(“Extra what? Extra CPUs? We always get extra CPUs.”)在 Azul 拥有数百核心的系统上,垃圾收集团队根本不用为后台复制所占用的算力感到捉襟见肘。 更重要的是,Azul 的 GC 机制从根本上颠覆了传统堆内存的管理逻辑。传统的 Java 收集器由于存在极度痛苦的长暂停时间(GC pause),不得不竭尽全力压榨空间,让堆运行在无限逼近内存溢出(OOM)的刀刃边缘;而 Azul 凭借无停顿的并发机制,通常可以在堆中维持一份宽裕的“松弛冗余空间”(generous slop extra),这种充裕的内存弹性极大缓解了垃圾回收器面临的吞吐压力。即使后续在极端紧凑的内存限制下运行系统,底层的并发回收框架依然能保持稳健。 ### [01:11:28](https://www.youtube.com/watch?v=5uljtqyBLxI&t=4288s) 内存余量与垃圾回收的 CPU 开销权衡及演讲结语 Cliff Click 针对系统在极端紧凑的内存限制下如何运行做出了最后的解释。他指出,随着可用堆内存空间的压缩,垃圾回收(GC)周期被迫变得越来越频繁,从而会消耗巨额的 CPU 算力。即便在堆内存仅比存活对象(live heap)多出 10% 到 20% 的极度紧张情况下,Azul 的系统依然能够保持平稳运行而不会崩溃,但用户为此付出的代价是消耗大量的处理器资源在回收工作上。Cliff Click 坦率地提醒道:“This is--it's not necessarily where you want to set yourself.” 他认为这种极端工况虽然技术上行得通,但在实际生产中并不是推荐的配置方式。提问者致谢后,Cliff Click 向全场观众致谢,全场演讲与问答环节圆满落幕。 - **低堆内存余量下的系统表现**:当配置的堆大小仅比活跃对象总量多出 10% 至 20% 时,系统虽然可以正常运转,但 GC 循环频率骤增,会导致大量 CPU 周期被垃圾回收吞噬。 - **资源权衡建议**:虽然硬件与运行时能够承受极低的内存余量,但在架构规划上应当预留合理的堆空间,以避免在无意义的高频 GC 中浪费算力。 ## Notable quotes > [19:52](https://www.youtube.com/watch?v=5uljtqyBLxI&t=1192s) Complicated stuff you do in software. Simple stuff that's usually detection ends up going on in hardware. — Cliff Click > [29:55](https://www.youtube.com/watch?v=5uljtqyBLxI&t=1795s) Your simulators have to be run on a true multi-CPU machine or you will not get realistic [races]. That will happen in real life. — Cliff Click > [46:15](https://www.youtube.com/watch?v=5uljtqyBLxI&t=2775s) 如果它运行得不好,那对我们来说就是一个 Bug,我们会去修复它,不管你的应用是什么,也不管它在进行什么形式的 GC 循环。 — Cliff Click > [13:36](https://www.youtube.com/watch?v=5uljtqyBLxI&t=816s) 对于那些大型应用程序,静态分析会迅速变得极度保守,以至于它们从逃逸分析中一无所获——完全无法证明任何东西能在短时间内保持非存活状态。 — Cliff Click > [16:08](https://www.youtube.com/watch?v=5uljtqyBLxI&t=968s) 在商业逻辑的 Java 程序中,根本不存在任何合理的内存局部性布局。既然根本没有合理的布局,一切访问都是随机的,那么你十六分之十五的内存访问都会落在其他芯片的内存控制器上。 — Cliff Click > [04:57](https://www.youtube.com/watch?v=5uljtqyBLxI&t=297s) Well, really, who buys custom hardware? You must have like a really, really good reason to buy custom hardware for the obvious X86 solution. — Cliff Click ## Mentioned Azul Systems, Cliff Click, Google, Sun Microsystems, HotSpot, HotSpot C2 编译器, TSMC, Intel, SPARC, HP, Doug Lea, Paul Lucchesi, Vega 1, Vega 2, Vega 3, Rock 处理器, Niagara, PicoJava, Jazelle, WebLogic, WebSphere, JBoss, COBOL, GCC, high-scale-lib, SPECjbb, Thread Path Monitor (TPM), Real-Time Performance Monitor (RTPM), ECOOP, VEE ## Video description Google Tech Talk August 12, 2009 ABSTRACT Presented by Cliff Click, Azul Systems. Azul Systems designs and builds systems for running business logic applications written in Java. Unlike scientific computing, business logic code tends to be very large and complex (greater than 1MLOC is common), display very irregular data access patterns, and make heavy use of threads and locks. The common unit of parallelism is the transaction or thread-level task. Business logic programs tend to have high allocation rates which scale up with the amount of work accomplished, and they are sensitive to Garbage Collection max-pause-times. Typical JVM implementations for heaps greater than 4 Gigabytes have unacceptable pause times and this forces many applications to run clustered. Our systems support heaps up to 600 Gigabytes and allocation rates up to 35 Gig/s with pause times in the dozen-millisecond range. We have large core counts (up to 864) for running parallel tasks; our memory is Uniform Memory Access (as opposed to the more common NUMA), cache-coherent, and has supercomputer-level bandwidth. The cores are our own design; simple 3-address RISCs with read- & write-barriers to support GC, hardware transactional memory, zero-cost high-rez profiling, and some more modest Java-specific tweaks. This talk is about the business environment which drove the design of the hardware (e.g. why put in HTM support? why our own CPU design and not e.g. MIPS or X86?), some early company history with designing our own chips (1st silicon back from the fab had problems like the bits in the odd-numbered registers bleeding into the even-numbered registers), and finally some wisdom and observations from a tightly integrated hardware/software co-design effort. [Source](https://www.youtube.com/watch?v=5uljtqyBLxI)

Source quotes

[19:52] Cliff Click: Complicated stuff you do in software. Simple stuff that's usually detection ends up going on in hardware. [29:55] Cliff Click: Your simulators have to be run on a true multi-CPU machine or you will not get realistic [races]. That will happen in real life. [46:15] Cliff Click: 如果它运行得不好,那对我们来说就是一个 Bug,我们会去修复它,不管你的应用是什么,也不管它在进行什么形式的 GC 循环。 [13:36] Cliff Click: 对于那些大型应用程序,静态分析会迅速变得极度保守,以至于它们从逃逸分析中一无所获——完全无法证明任何东西能在短时间内保持非存活状态。 [16:08] Cliff Click: 在商业逻辑的 Java 程序中,根本不存在任何合理的内存局部性布局。既然根本没有合理的布局,一切访问都是随机的,那么你十六分之十五的内存访问都会落在其他芯片的内存控制器上。 [4:57] Cliff Click: Well, really, who buys custom hardware? You must have like a really, really good reason to buy custom hardware for the obvious X86 solution.

Source quotes

[3:24] Cliff Click: You must have like a really, really good reason to buy custom hardware for the obvious X86 solution. And, you know, a merely 5x price performance kind of gain is not really good enough to make people jump ship there. [52:31] Cliff Click: If you own the whole stack, hardware and up, you can do progress even with some of the real awful hardware bugs, right?

Original transcript

[0:00] >> [0:23] It's my pleasure to welcome today to Google, Dr, Cliff Click. He's the Chief JVM architect [0:28] for Azul Systems. He's one of the lead--he was the lead architect on HotSpot server complier [0:33] back in the days when he used to work at Sun. And he's here today to talk to us about Azul's [0:39] experience with lots and lots of cores and hardware/software co-Design. So, here he is. [0:44] >> CLICK: Thanks. Hi. So, as you can probably tell from slides, you're getting recycled [0:51] slides from ECOOP key note, but I think they're very interesting. It's a very interesting [0:58] talk here. So, a quick look at what Azul is and what we do in terms of what we've done. [1:06] We design our own chips. They're actually fab'ed by Taiwan Semiconductor Manufacturing [1:10] Company. We build our own systems out of those chips. We target the systems for running business [1:16] Java. We are a very large core count, like 54 cores per die. We can make up to 16 of [1:20] the die cache-coherent. So, the big box has 864 cores in it. We have a very weak memory [1:26] model but it meets the Java spec when we put in the right set of memory fences. The memory [1:32] speed is flat. It's uniform. It is not NUMA which you usually expect it of a high core [1:37] count machine and that's because business Java is very irregular computation. So, it [1:41] doesn't know same lay out. You can do where you can get some of your memory, you know, [1:45] the local memory close to you or pick some chunk memory you know is going to be local. [1:50] And instead, we just give up on that and said, "Okay, it's all minimum speed. There's no [1:53] fast and no slow." We do have a lot of bandwidth. We hit the--we're still on the top 20 list [1:58] for supercomputer bandwidth a couple of years later. The CPUs themselves have a fairly modest [2:05] per CPU caches, but in aggregate, there's a lot of cache and the die; 16K I cache and [2:11] D cache each, times 54 cores. And then every set of nine-core share two meg L2 or six of [2:19] those in a die, so there's 12 megs of L2. It's an aggregate. There's a lot of cache [2:23] in the die. So, if you just go--here it goes. And I went too fast, too far. Let me back [2:27] up here. Yes. Okay. So, I did--yes, I'm trying to figure what button I press to make it to [2:37] go there. Fine. Okay. So, the cores are classic 3-address RISCs. They're very simple. They [2:42] clock slower than an X86. I'm a part of that just because there's a lot less area consumed [2:47] for core. There's no replication of parts. Everything has to go through very simple pipe. [2:50] We can sustain a couple of cache-missing ops on each core and each L2 can sustain a number [2:58] of prefetches. So, an aggregate across the entire box, you could have well over 2,000 [3:03] outstanding memory references in flight at once. And that's not hard to achieve on the [3:08] box and that's pretty common and that will not cause anyone to slow down and we have [3:12] bandwidth to spare to do that. We have hardware transactional memory support, a bunch of special [3:16] ops to make Java's life better including read and write barriers for GC, a bunch of other [3:21] things that are all sort of nickel and dime change to make Java run faster. And we really [3:24] were targeting thread-level parallelism in a managed runtime kind of system. That's sort [3:29] of the goal target there. So, when we look back in time when Azul was started, the Java [3:38] was replacing COBOL. A lot of that came out of sort of the Y2K driving. People realized [3:44] at the time of the Y2K, you know, non-disaster that they had to replace all their COBOL code [3:49] and their COBOL programs were literally dying of old age. So, these big businesses decided [3:54] to flip to Java. I don't know why, but they did and suddenly there was millions and millions [3:58] of lines of Java code being written on a, you know, annual basis. And a lot of it had [4:02] thread level parallelism built into it; application servers, Beans, you know, WebLogic, web security, [4:08] Jboss, those kind of things. So, it's all task level, transactional level parallelism; [4:13] the ThreadPools, Worklists, that kind of staff. And, you know, in conjunction with that, people [4:18] are hitting the power wall. You can't add more power, you can't clock faster because [4:22] that consumes more power, more power and your chips will [INDISTINCT]. So, clock frequencies [4:26] are topping out. People are predicting they're going to have more transistors, there's no [4:30] point in adding more cache. You can't clock faster, so you're going to get more cores. [4:34] And we fast forward 2009 and the fact clock needs to stall, the gamers get three and a [4:38] half gigahertz, the cheaper guys get two and a half gigahertz, but everyone's got four [4:42] cores. That's sort of a lower bound now. You can't get [INDISTINCT]. So the obvious synergy [4:46] between where we were back then and what was obviously coming [INDISTINCT] all these transactions [4:50] on separate course. So, you want to have a multi-threaded, multi-core machine, right? [4:54] So, that was what we were thinking when we started designing the box. But then, we had [4:57] to look at it and say, "Well, really, who buys custom hardware? You must have like a [5:00] really, really good reason to buy custom hardware for the obvious X86 solution." And, you know, [5:05] a merely 5x price performance kind of gain is not really good enough to make people jump [5:09] ship there. So, you had to do something very special. So what else can we do besides more [5:14] cores? Well, big business apps were already pushing memory limits of what you could squeeze [5:20] into a box. So that was the whole 32-bit versus 64-bit heap. So we said, "Okay, we're just [5:25] going to jump straight to 64-bit heaps and not bother with 32-bits," right? We're going [5:28] to have lots of thread support, lost of thread count support. GC, what can we do in GC? Well, [5:34] the notion of using read-barriers for GC has been around for, like, over 20 years. They [5:37] look like the old symbolic skies. They did this kind of game long, long, long ago. And [5:42] so we said, "Okay, we can do this in hardware. It's a tiny bit of extra hardware." We also [5:47] asked you know, "Can we have the extra tag bit in hardware to have pointers in hardware [5:51] as a tag thing?" And the hardware guys jumped up down right away and said, "No, no, no, [5:55] no. Must have commodity DRAMs, must be 64-bit DRAMs. Cannot have the 5th--65th bit there." [6:01] "Okay, fine." Transactional memory is a "hot" topic. Hardware support for transactional [6:07] memory is a hot topic. It was all over the academic literature, it was going to save [6:10] us from our complex locking schemes. We all know that complex locking schemes are a big [6:14] problem. We don't know how they work. Nobody understands where they miss the atomics so [6:18] they throw synchronized keywords everywhere and they have to save themselves. [6:22] No one wants to actually rewrite all their applications using some sort of new language [6:26] construct until there's, like, an--it's obviously going to work and there's an obvious momentum [6:30] of people in the community producing both the programs and the implementations. So, [6:34] that hasn't happened. This is still an open research problem of how to implement this [6:39] guy. So, instead, we're using hardware transactional memory to support lock-elision done and a [6:44] combination of hardware and software. So, Java lock-elision, that's what we're aiming [6:48] for that hardware. A couple of other things we can do, we know that locking is going to [6:53] be an issue, but most locks are not contended as like in 99% case. So, you need an atomic [7:00] operation like CAS to go take a walk in the first place but usually it's never contended. [7:05] So we wanted the uncontended CAS to be fast. So we arranged our hardware memory model such [7:10] that an un-contended CAS can hit in your L1 cache and it runs at an L1 cache speed. So, [7:17] CAS can hit in cache. So, one-clock pipeline. Same thing for memory fence, if you don't [7:21] have any outstanding memory references that aren't going to be resolvable and there's [7:24] no contention for memory, you can do a memory fence, a proper Java memory model ordering [7:28] it in a clock pipeline, right? Turns out that CAS as implemented by every other CPU on the [7:34] planet includes a memory fence and that memory is not the correct spot for how HotSpot does [7:40] lock. So, HotSpot emits a second fence on top of the CAS as part of the standard cost [7:45] of taking a Java lock. It's kind of a painful thing. So, even no-fence CAS. And we tried [7:50] that within a bunch of other interesting used cases for this atomic update, performance [7:54] counters, a bunch of lock-free algorithms which don't need ordering. So, we use no-fence [7:58] CAS all over the place and it makes us sort of run faster in this highly contended, high [8:02] concurrent code. We do have fences through force order when we need it. There's not otherwise [8:08] much ordering. It's a much weaker memory model than, say, X86s or SPARC TSO. We allow all [8:17] kinds of re-ordering except these other memory models. Don't allow--and we rely on fences [8:20] to get the answer correct for which the JIT-run running Java code obviously does the right [8:24] thing and so you get the Java memory model. Okay. So, we've had hardware transactional [8:31] memory support in from day one. As I a little bit talk about what goes on with this, there [8:36] are extra UpCodes, the speculate commit and abort UpCodes and there's an extra tag bits [8:42] in your L1 cache. And there's nothing at all in your L2 about how the HTM works. The hardware [8:47] guys are very clear on that. You can not--they--the L2 is a--what Intel calls the LLC, the Last [8:52] Level Cache. It's the point of coherency between the hundreds of hundreds CPUs in the system. [8:56] That is already one of the most complicated parts in the system. There's no freaking way [9:00] you're going to go in there and add some new weird-ass thing that no one knows if it's [9:03] going to help or not. So, nothing in the L2 on hardware transactional memory, it's all [9:08] done in the L1 level. So, when you start and end the transaction, whether it succeeds or [9:13] it fails or whatever it does, the L2 is utterly unaware that you're doing this, right? Okay. [9:17] So, yes, the extra tag bits in your L1, you turn on the speculate mode with the speculate [9:22] UpCode. Every time you go read or write it test--it sets a little bit in the L1 cache [9:26] saying this line has been read speculatively or written speculatively. And then if you [9:30] ever loose a line, one of these tag lines out of your L1 for whatever reason, you abort. [9:35] And if you abort, you'll loose them all. We just take all of the spec lines and throw [9:38] them out to the Cache. So all those writes you accumulated in your, you know, L1 cache [9:42] they all get thrown out. And then you go to a software recovery mechanism which essentially [9:47] decides to retry the transaction or switch to heavy weight lock or do something, whatever, [9:51] do whatever it's going to do recover the situation. Since you're doing Java level locking, it's [9:56] entirely plausible to do software recovery where you just retry the lock a few times [10:01] and see if you can't get the transaction to flow through. We routinely see transactions [10:07] on the order of thousands of instructions long. And it turns out that this not helpful [10:11] in practice, so I have another talk on why HTM isn't going to save the world. But the [10:15] short answer is there's no dusty-deck speedup from lock-elision. We elide dozens of locks [10:21] in these big concurrent programs but never the ones that allow actually more threads [10:26] to run concurrently, right? And usually because they have a true data dependency and the true [10:33] data dependency prevents all kinds of transactional memory hardware, software or whatever you're [10:36] going to do, you have a true data dependency. And, usually, that true data dependency is [10:39] due to something stupid like a performance counter that's no one's looking at. But you [10:42] add one to a shared counter, it's a true data-dependency and you're stuck. You just can't make that [10:47] transact. So someone has to hack the code. As soon as someone willing to hack the code, [10:51] by the way, then all bets are off. Why hack your code to make it transactional memory [10:55] friendly when you could hack it to be fine relocking friendly. [10:57] >> [INDISTINCT] >> CLICK: Absolutely. [11:00] >> You have open sources? >> CLICK: Yes, already done. It's in the high [11:06] scale lib. >> Okay. [11:08] >> CLICK: And in turns out that in practice when we get to these high CPU counts big box [11:13] systems what prevents scaling is GC, it's not locking. People write--they have GC issues [11:22] that they consume more memory or have a large [INDISTINCT] that they have GC pause times [11:26] that prevent them from trying to make a bigger system because the pauses are killing them [11:30] as it is. So instead they cluster smaller JBMs, right? Oh, yes, contrast this to some [11:38] Niagara Rock product. We do not abort for function calls or TLB misses or nested locks [11:44] or a thousand other things that Rock does. We have a much stronger implementation than [11:48] Sun's Rock processor, much weaker than most academic paper presentations that never see [11:54] the light of day, but it doesn't matter. It's not going to save the world. Okay. What other [12:00] things that are going on? Here's the time. Think back to 2000, 2002. We're designing [12:04] a system. Okay. The multi-core obvious risk is you're going to run out of bandwidth because [12:09] each one of these CPUs has kind of its own, you know, working set of memories it's going [12:14] to touch, its own set of cache misses, it's got these relatively small caches, it's going [12:17] to need to go to memory a lot. You're going to run out of bandwidth, right? You're going [12:21] to have 54 cores, you're going to have 54 as much bandwidth requirement. Well, not quite, [12:25] but something like that. So, it turns out that we have a bunch of things we can do. [12:28] We did what we call a CLZ instruction, the "Just-In-Time" zeroing in your L1 cache. It's [12:34] support for streaming out memory allocation. Turns out that if you look at how standard [12:39] garbage collectors do allocation, it's this very efficient bump pointer style allocation, [12:44] but that also means that you're constantly moving to new addresses that have never been [12:48] seen by this CPU since the last full GC cycle. So, long ago, those addresses all left for [12:53] cache. So it's a constant stream of cache misses. You promptly zero that memory by writing [12:58] it entirely and then you fill it with good data and use it for awhile and then most of [13:01] it dies young in your cache because the generational assumption works and most objects die young. [13:06] Okay, fine. But what it means is you read a bunch of stuff from memory in order to touch [13:11] this new cache line that you promptly zero. So you didn't actually need to do the read. [13:15] You don't want that data, you're going to fill it with zeros. You just want coherence. [13:19] So, we have this "Just-In-Time" zeroing which is zeros on in the cache without actually [13:23] reading memory, lowers your re-bandwidth. It turns out that that, in practice, very [13:28] measurable, very real 30% reduction in bandwidth. That's a big ticket pile of bandwidth reduction. [13:36] We have stack allocation support which is essentially escape detection as opposed to--there's [13:41] a lot of literature about escape analysis, this is much more effective. When you do escape [13:48] detection, you can optimistically assume objects have stack lifetimes and you're almost always [13:53] right. And when you're right, the--you don't have to read the data but you don't have to [13:57] write it, either. It stays in your cache and you recycle the same memory in your cache [14:01] and it cuts both the read and the write traffic out. So that's another nice blend on bandwidth. [14:06] We have this very lose memory model which lets us scale the big core counts lest things [14:10] got out of order. It's a one way to--you still have the bandwidth issue, but you can--you [14:15] get more time to cover the bandwidth, more hardware opportunities to reorder things to [14:19] cover the bandwidth. >> [INDISTINCT] escape detection and analysis? [14:22] >> CLICK: So, in escape analysis, you do a conservative analysis on the lifetime of an [14:31] object and if you can prove it has this nice stack lifetime, then there's an obvious allocation [14:36] technique where you allocate it on your stack and when your function exits it's de-allocated. [14:39] So it's free to allocate, free to de-allocate, right? Great. But to do so, you have to prove [14:44] that it doesn't escape your analysis border and in small [INDISTINCT], small to modest, [14:50] that kind of analysis technique turns out to work out fairly well. There's a bunch of [14:53] interesting benchmarks where you get this giant gain, you don't build your cache, you [14:56] quit your GC cycles--I mean, quit leading your cache. If you quit doing GC cycles, everything [15:00] runs hot in your cache. It's great. For the bigger programs, the analysis gets evermore [15:04] conservative because the problem just gets to too big to do the whole analysis. And it [15:08] turns out that, you know, IBM did it on these nice big apps. There's one where the people [15:11] paid real money for real hardware. Those programs get so conservative so quickly that they get [15:16] nothing out of escape analysis so just--they can't prove anything that remains live for [15:20] a short duration. So, escape detection on the other hands says, "Let's make this thing [15:26] like as if it's going have stack lifetime." But every time you do a store which might [15:29] escape a pointer out of your purvey test to see if it's escaping out of the stack lifetime. [15:35] So it's totally optimistic. It's totally--fix it up after the fact if something goes wrong. [15:40] There's no pre-analysis. In turns out in practice, for these big up servers, we can get between [15:45] 60%, 70% of all objects stack allocated, whereas the good escape analysis are, like, well under [15:51] 20 or 30%. They're, like, down in the noise kind of range. So, yes, it's a big difference. [15:58] >> [INDISTINCT] >> CLICK: Yes. Okay. So, yes. Well, I have [16:02] a nice big talk on how that is and why it works and why it's useful, but too much in [16:06] this talk already. Okay. So, other things we play here, sports for lots of cache misses, [16:12] I mentioned that before. Similarly for the Niagara model, instead of having one uber-fast [16:16] core, you have lots and lots of cores that each, independently are spewing out cache [16:19] misses and then all those cache accesses or misses are all coming back in parallel. And [16:24] so, you get a big bandwidth to memory effectively out of it, but you have to do it by having [16:29] all these different threads that are all running in their own little direction, right? So the [16:33] goal is throughput. It's not a single-threaded performance. So, we really built a throughput [16:36] machine. We have lots of memory controllers, there's four per chip, we stripe the memory [16:40] accesses across all the chips so you don't hotspot any individual memory controller. [16:45] So, if you're, you know, successively accessing addresses in memory in the actual hardware [16:50] implementation, those will go to all the different memory controllers in a hashed, semi-random [16:55] fashion and then--and then come back to you. So, the one chip will write up all your memory [16:58] controllers and so all the chips in turn will take--you know, by the time they're turned, [17:03] light up all memory control. So it really spreads the effort of going the memory out. [17:08] So, that avoids hotspots and lets you use all the bandwidths you have. And, you know, [17:12] one of the observations here is that there is no same memory layout of local and remote, [17:17] of "I'm going to use all this chunk of memory and none of that chunk, so move this chunk [17:21] close to me." You can't do that in business logic Java. There's same memory layout. Since [17:25] there's no same layout, if it's just random, then [INDISTINCT] 15th, 16th of your memories [17:30] on the other--memory controls on the other chip, right, so remote. So then if you speed [17:34] up the local cache, you speed up the 116th cases and, like, what's the point of that? [17:38] So at that point, we gave it up and just said, "Even the local memory has just looped back [17:42] off the chip, come back on." Same cost is going remote. But there's no gain either. [17:47] No gain, no loss. It's the same cost. It turns out that there are other users where you want [17:52] caches. They work right for your stacks, for your young new gen objects, a couple other [17:56] cases where you want a cache. And for everything else, we just do without it. All right, what [18:02] else can we do? Short cache lines, you avoid false-sharing, some of he bandwidth saver [18:08] we have these nice short cache lines. It also allows more concurrency because it avoids [18:13] some false-sharing issues. Support for faster virtual calls. We all hadn't put MetaData [18:20] in the pointers. So we have a 64 bit pointer. We throw an extra few bits like, no--everyone [18:24] else on the planet influences six--over like a lower 40 or 42 address in bits. That's already [18:29] a couple of terabytes of memory. The upper 20 bits that you see they have all zeros or [18:33] all ones, we said, "Now we'll put some data in those bits," right? The hardware will strip [18:36] them out when it goes out to the address buses, but we got data in the pointers. And the MetaData [18:41] pointers, we got some in for the garbage collection. I'll talk some about that in a minute. But [18:45] we can also use it to speed up virtual calls because those have do a predicted subclass [18:50] test and we can put the class to one object in the header and do the task straight on [18:54] the object pointer itself and not off the contents of the pointer, right? Bunch of little [18:59] stuff. Cooperative self-suspension is actually kind of a big ticket item. We're going to [19:04] Safepoint thousands of runnable threads. Not just thousands of threads where most are blacked [19:07] in IO, thousands of running threads have to come to a Safepoint to allow GC so we have [19:12] some cooperative self-suspension mechanism where we can hope thousands of running threads [19:16] in milliseconds and get them to all agree that we're all stopped or start--conversely, [19:20] it all started again. Okay. So, I had a lot of fun conversations through the years with [19:25] the guys, the hardware guys on how to do all this kind of stuff, right? And so, routinely, [19:29] I had, you know, especially when I started here, I had games where I play like, "Gosh, [19:34] I really wish I had an instruction that did X," whatever X was. And I go to the hardware [19:38] guys and say, "Can you give me instruction to do this?" He said, "Sure. I'll give you [19:41] one. Here are my three clks and here are three, one clk instructions that do X." And now, [19:45] the hardware guy says, you know, "And now tell me why it really has to be fast than [19:48] the clks? Is it is so fast, this is so common, this is so whatever? You need to beat clks?" [19:52] and I'd have to come back and say, "Well, you know, no I don't need faster than three [19:57] clks. It comes around every few thousand instructions, one, two or three, no big deal." So out of [20:03] that comes this really clean architecture where I didn't get what I wanted a lot of [20:06] the time, but I got a simple chip which is easy to use. And in exchange, I got comments [20:13] back from them like, "We can do these really cool things in hardware, like, directly execute [20:16] bytecodes," you know, the old, I don't know, MIPS. Was it MIPS, [INDISTINCT]? No--Giselle. [20:24] One of these Pico Java thingies and I was like, "Oh, my God, don't do that. It's been [20:28] tried before. It's disastrous. What about JIT? Give me a nice JIT target. Nice [INDISTINCT] [20:33] risk. I'll make you a pretty code for it and it'll run really fast. Don't try and screw [20:37] around with executing bytecodes directly because after I JIT, you won't care for it and, in [20:42] any case, you can't handle all the bytecodes, so you'll have to bail out the software over [20:45] anyhow." So, we can put in fancy branch target buffers to speed up virtual calls. And, again, [20:50] I was like, "You know, by looking at the instruction traces, a number of times I do a jump register [20:54] is like next to none because we had these nice things called inline caches." So, we [20:58] don't do direct register jumps. Instead, we do inline caches almost everywhere and all [21:03] I want is standard branch prediction hardware. Don't give me anything fancy. Basic stuff [21:08] is more important to get right. I'd rather have a 5% bumping clock rate over any one [21:13] of these other things. So, it's kind of fun games going back and forth. Really, the core [21:18] design philosophy boil down to "What can we do using your own hardware and then our software [21:22] and vice versa," right? So in hardware, it's easy to detect interestingly bad situations [21:29] such as cache lines getting kicked out for your hardware transaction memory. You lost [21:34] the line on any of your cache, that's really hard to do in software. People who write software [21:37] transaction memory systems doing roughly the same kind of thing see a 10X slowdown to do [21:42] it all in software. It's a tough thing to do in software. Hardware can do it for free. [21:45] They have to do it anyhow. That's part of their cache coherency protocols. So, it's [21:48] just like freebie from them. How about cache line zero? We don't have it. Ours does not [21:54] order with the standard memory fences because if you do so, then every time you enter and [22:00] links a lock with an allocation, then your pipeline of incoming zeroings gets stalled [22:07] for the lock. And so, in fact, you don't get the gain you're looking for. You get instead [22:13] of--instead of getting the bandwidth covering issue you're looking for which really is you [22:19] stall the CPU so you don't actually make progress as fast as you were before. Your bandwidth [22:23] goes down because you're not making progress. So we have this funny thing where here's a [22:27] write to memory. It's going to zero some lines in your cache and that's outside your coherency [22:31] domain. And you have to do something special about it. In the hard software, there's all [22:34] these games around cache line zero in sort of a spec-filled way knowing that he's going [22:40] to get some zeroes in but if he has to abort and retry a hardware transactional memory [22:44] attempt or something, the zeroing in memory is going to be different. GC barriers for [22:48] read and write barriers. That's a big ticket item. People who do academic papers on re-barriers [22:54] typically report slow downs in between the 10% to 20% range. And for us then a GC barrier [23:01] is essentially free now. It's not quite free, but it's very close to free. That, by the [23:05] way, I'll talk more about when I get to GC. That re-barrier allows us to change GC algorithms [23:10] to one which scales to insanely high levels and works really, really well. Stack lifetime, [23:15] another, you know, fancy write barrier detection thing. The predictive virtual call for doing [23:21] your type sub-checking on objects and virtual calls, all done where you need detection in [23:26] the hardware. And in the software, you do all the complex fix up logic. So, there's [23:29] no register rollbacks on the hardware transactional memory, for instance. Some of the other--most [23:34] of the other academic papers, you know, expect you to have out of order engine in your hardware, [23:39] which means you have all this register renaming gear so you can do specs or the register updates [23:43] and then blow them back and re-roll them and retry them in your hardware. And we don't [23:47] have that fancy hardware, but we don't need it either. So, we don't have a register rollback [23:51] on our hardware memory failure. It's all done entirely in software. Relocating objects for [23:59] GC, the software inline cache means we don't need the branch target buffer or JITing. So, [24:03] we don't need the fancy piece of hardware to do direct bytecode execution and so on, [24:07] and so on, and so on. So, complicated stuff you do in software. Simple stuff that's usually [24:11] detection ends up going on in hardware. Okay, other games. No way customers buy funny new [24:19] hardware from an unknown company and a funny OS they have to support as well. So, we have [24:22] a plug-n-play thingy. It goes in your data center, you install our JDK and you point [24:28] your Java program at the new JDK and boom it runs. And, literally, it's 10 minutes from [24:33] install to sort of a max score JBB on any old machine in your entire data center. That [24:40] was a big ticket item for us in terms of getting in the door at a lot of very conservative [24:46] bank-like companies, right? We can speed up older Sun and HP gear just in situ. Install [24:52] a JDK on your old Sun box. It was running a spark thingy. You liked how that was stable [24:56] and working just too slow. Poof, suddenly it's a thousand times faster. Also, you get [25:01] to avoid all the user visible OS business that leads to, you know, dll hell or patch [25:06] hell, right? There's no device drivers. There is no legacy crud, there's no swap. We can [25:10] only swap on the box. It's entirely stateless. There's no big kernel lock issues if we picked [25:16] up Linux. Our scheduler was definitely a custom schedule. We got hundreds of CPUs, thousands [25:21] are runnables. Most schedules on the planet have never even remotely come close to dealing [25:25] with that sized scale of thing. So, lots of games you play there to make that run well. [25:31] Okay. A bunch of other stuff in the OS, hard performance guarantees so you can guaranteed [25:38] individual processor--processes, have a required amount of either memory or CPU or things like [25:44] that. So they get a guaranteed lower bound level of performance but the box is big in [25:50] terms of the number of JVMs on it. So they--you know, there's a lot of sharing going on, but [25:54] you can sort your processes by priority and guarantee that the important ones get what [26:00] they need when they need it. But if they're not using it then all the other jobs is sort [26:03] of best effort can pick up the extra memory and make their GC more efficient or actually [26:07] CPUs to ran faster or whatever. Bunch of other stuff, the GC requires bulk/fast TLB mappings--remaps [26:14] and shoot down, bulk/fast virtual-to-physical mapping. These are not available in any other [26:19] OS in the planet, so we had to do a bunch of work there. We do have virtual memory support [26:26] because, you know, JVM is crashed, so you don't want one crash to bring your whole box [26:30] down. We have people ask it all the time like, "Why you need TLBs if you got strong type [26:38] safety?" Our answer is, "Well, you get bugs." Okay. So, other robustness things, you know, [26:43] ECC in your caches, you got chip kill, a lot of error reporting stuff. The OS can de-configure [26:48] dead CPUs, dead caches, dead memory chips and stuff like that. So, we have our own OS. [26:54] Why do we do our own CPU? Interesting question. Well, we can't find a multi-core 64-bit CPU [27:03] with, you know, with the designs for sale. Actually, we couldn't find one at all. We [27:06] had all the features you wanted. You have to have ECC on your L1. Turns out you want [27:13] parity at least something on your register file because you got so many of them. You [27:17] got 32 registers that are architecturally visible, 64 actual hardware registers per [27:22] core. You have 54 cores. You're talking thousands of registers. You get a single bit error, [27:27] you're going to be--you know, you want to find out about it, you want to--you want to [27:30] fix it or do something. So, we had parity on the register file. We need meta-data stripping [27:35] on the load store barriers. We need to redesign the load store barriers that deal with hardware--load [27:39] store unit to deal with hardware transactional memory, to deal with ECC and the L1 cache, [27:42] to deal with the [INDISTINCT] memory model required for scaling. And by that time, you [27:46] are now redesigning about half your CPU anyhow. So, we could have picked up, you know, an [27:51] X86 implementation, you know, and chip layout and then go on after the L1--the load store [27:56] unit, L1 cache unit on X86. But that would have been just disaster for, you know, how [28:01] much the CPU you have to redesign. And other issues are like, you know, you get a nice [28:05] high quality port of gcc in the tool chain and all that, but that's only, like, a nice [28:09] to have. We totally can do our own port to any target. HotSpot's entirely portable. So, [28:14] we ported GCC to our own chip and we ported HotSpot to our own chip and that was--didn't [28:20] take all that long to go port. So, we have our own CPU, our own OS, our own interconnect, [28:25] all that stuff because we couldn't get it elsewhere. Okay. What else can we you do with [28:29] all these cores? Well, anything we do on another thread is essentially free because we got [28:33] more CPUs than we know what to do with, right? So, we have big compiler thread pools, for [28:37] instance, with JIT furiously in the background. When your big application starts, it's common [28:41] to get 30, 40, 50 compiler threads compiling, get megabytes a second of high quality of [28:46] JITed code with profiling pouring in your code cache. And after a couple of minutes, [28:50] it's all done and your whole program has been compiled for you on the fly while you're watching [28:54] it come up, right? Obvious background GC. We do this giant GC thing. We have, like, [29:00] sort of orders [INDISTINCT] better GC than anyone else in the planet and we do this by [29:04] having all those GC threads do their work in the background on other threads, on other [29:10] L2s because a standard operation for GC is to go touch every element of the heap and [29:14] this has some really bad locality you get--you scattered down all over the heap. And if you're [29:19] running the GC on the same multicore chip, same shared cache, then the GC thread thrashes [29:27] the cache that's shared and the mutators, the actual Java threads doing work, all slow [29:31] down because they're effectively--their low, slow cache is being trashed by the GC thread. [29:36] So, we run them all on a different L2 clusters. There's no speed race for GC. They just have [29:40] to get done before the next GC cycle is done. So they have lots of time. So the fact they're [29:45] essentially running without an L2 cache is all fine. They got an L2 cache, it just happens [29:49] to miss every time you go to it. And you can do pre-fetching a GC. It's not easy. It's [29:55] actually really a pain in the neck, but it's doable. The other fun games you can do, you [29:59] know, background profiling, pre-zeroing pages, CPU hot spin on I/O so it's, you know, it's [30:06] clock cycle times between when data arrives in memory and when you start processing and [30:11] doing stuff with it. It's very, very quick there. Okay. So, having come up with a basic [30:17] design, we have to go build it. I guess we designed it, something that. Actually make [30:21] ideas turn into--and that list turn into a tape and to TSMC, right? Hire a hardware team. [30:28] There's a dot-bust in progress. Lots of good engineers on the street. We've got a lot of [30:32] good guys. Hire an OS team, hire a VM team. We start porting gcc and HotSpot to the new [30:38] chip. We write a simulator at the same time. Eventually into booting the OS on the simulator [30:43] and it's actually fast enough to run HotSpot on a fast X86 and about 20Mhz of the Vega [30:49] chip ops. So that's fast enough to run big interesting applications entirely in the simulation. [30:55] Lots of cool tools rebuilt; data-race detector, found lots of real data races both in HotSpot [31:00] and in then the application itself, getting much of cache miss rate, cache layout visualization [31:05] tools, trace generators, all kinds of fun stuff. I've learned interesting lessons here. [31:09] Your simulators have to be run on a true multi-CPU machine or you will not get realistic [INDISTINCT]. [31:16] That will happen in real life. So when we went from a single CPU X86 to a dual CPU x86, [31:22] a huge count of new data races appeared, all in the simulation obviously, that had never [31:26] appeared before even though the simulator was simulating on a multi-CPU machine. And [31:30] that was just--you just had to have a real multi-CPU machine in your simulator or you [31:35] weren't going to simulate any interesting data races, right? First chip, Vega 1; 24 [31:43] cores grouped in three clusters of eight sharing a 1Meg L2. Each core has 16K I and 16K D cache, [31:50] 4-way associative, extra tag bits for the Hardware Transaction Memory, short cache lines. [31:57] The L2 is also 4-way. And people who can do Math can somehow realize that I've got eight [32:03] CPUs each 4-way on the D-cache and 4-way on the I-cache sharing one L2 that's only 4-way. [32:10] So we've heavily over subscribed the ways on the L2 and we're obviously at risk for [32:15] false sharing where two or more, you know, four CPUs all agree to use the same line in [32:22] L2 and the fifth CPU wants to use the same line, boots out the first one. And then the [32:27] 8th each all boot each other out in the accounts that misses because everyone's false sharing [32:31] in the L1s--in the L2 because of the small associability. So, there's a big risk for [32:36] that, but we are at the limits of die size and yield that we could get away with here. [32:39] This was the biggest chip TSMC had ever done at that time. There are a lot of profiling [32:43] and a lot to look at traces there to come out with these numbers, but they were obviously [32:48] pretty much a [INDISTINCT] at that time. We did have the support for the full 16 chips [32:52] interconnect and the L2 misses roughly the same cost as going to another L2 or going [32:58] to memory. So, it's, you know, in your L1, it's in your L2, it's not in yourL2, sort [33:03] of the cost hierarchy for our memory accesses [INDISTINCT] for CPUs. We built it and it [33:11] worked. It's pretty amazing. Okay. CPU is this easy JIT target that I asked for. Classic [33:17] in order three are just risk, 64 bits CPUs, one hit under miss cache, store buffer. It's [33:24] not really store, it's a store latch or store buffer. So, only one entry. So it's very simple [33:28] CPUs, get our masking of metadata. We have a full FPU per core that's a very simple one. [33:34] There's no separate [INDISTINCT] registers. No flags, no mode bits, no weird stuff you [33:40] get on--CPUs have been around for 20 years. Background spill/fill register stack to help [33:44] with fast, high speed calling, you know, up and down, bushy stack call traces. Special [33:50] ops do bunch of simple stuff to make it easier; array math checks, virtual call things. The [33:55] read-barrier is a very high frequency operation so it's crucial for it to be fast. The write [34:01] barrier replaces a very bulky thing. It's hard to do all the integer ops fast that you [34:06] need to do the stack barrier. Although if you're just doing card marks in a write barrier, [34:12] it doesn't save you so much; save you some, though. We get our first silicon back from [34:17] TSMC at 2004, right? It's not quite dead. It's dead, gentleman. Not quite. Okay. So, [34:24] the L2s are mostly dead. A few L2s can run because they got the ECC and they're endlessly [34:30] correcting errors. And also, we have this one way we call limp home mode, like your [34:34] transmission. I don't know if you guys noticed, but if your transmission dies, it has a limp [34:37] home mode where you can stack in first gear and the car will be drivable, although the [34:42] tranny will have exploded internally. Like I said--I said older drivers are not in their [34:48] heads. Yes, I remember this. So, these are manufacturing errors of various kinds that [34:53] we don't know what's going on yet. So at the time we get the chip back, it's just totally [34:56] [INDISTINCT]. If the guy at TSMC in Taiwan, he gets on a plane with a box and he shows [35:01] up at our office 24 hours later and we, you know, score the chips, break them open and [35:06] put them under a--you know, put the probes on and away we go, right? And, obviously, [35:10] the first thing that happens is they're dead. Okay. What's going on? Okay. So--but we have [35:15] this one-way mode. So, you have the four ways and your one meg L2, you can try turn off [35:20] three of them that are so dead that they're just killing you and the 1-way lives with [35:24] massive ECC errors but it's living. So, you got a 1-way 256 scale, too, right? You get [35:30] register rights from the--even numbered registers are bleeding into the odd-numbered registers [35:35] periodically. That's kind of a really ugly thing. So, every time you do add RX plus RY [35:40] and the register RZ, if Z is even, then sometimes the bits that you wrote in RZ showed up into [35:46] RZ plus one. So, it's kind of ugly. So, we JIT to a subset. I think even subsets of registers, [35:52] right? Although we have other issues like the decoder, the instruction decoder treats [35:56] branch offset bits as registers and [INDISTINCT] decodes the instruction type as a branch but [36:00] also is decoding the registered bits out of the instruction. So if you're branching to [36:03] an even or an odd offset, you get an even or odd register decode and that cycles the [36:09] address port for that registered--piece of registered file and again you get these updates [36:13] to the wrong bits. You have to branch to even addresses now. That's not exactly even. It's [36:18] like the fourth bit or whatever, some random bit and you had to always have zero on a branch. [36:21] We still get a few good chips out of all this mess but we have to over voltage them so that [36:28] they'll--so the registers will behave well enough you can run it at all. And so the chips [36:32] have electron migration issues. The actual bits of silicon are migrating in the matrix [36:37] and going to the other side. And so, the chips are literally cooking to death in about a [36:41] month. So it's like guys have this chip with all this gear on it and his giant fan right [36:45] on the chip and, you know, it's howling away on the fan and the, you know--and it's up [36:48] and it's working and it's doing stuff, and it's running at 1/3, you know, 1/3 the clock [36:52] frequency and five times the voltage and it's dying, but it's cooking a little bit, right? [36:57] So, we make progress. We get the OS guys to actually get to where they can boot on this [37:01] sick thing. They actually get a great chance to test all their error correction codes, [37:07] all their de-configure, bad CPU codes, all this stuff. They got that all working out [37:12] in the first few months. But we go back to TSMC and say, you know, "What happened here?" [37:17] It turns out that actually what happened was a bunch of the silicon IP that we purchased [37:22] from other vendors, from the DSP market mostly, had spec'd it internally at their site to [37:30] run at the frequencies we were looking at, but that was about for three--well, two or [37:33] three times of frequencies that had ever actually shipped to customer at. So, in theory, it [37:37] was supposed to be good, the frequencies we're looking at. In practice I'd never tried it [37:40] and in practice, of course, it didn't work. So, we paid for this to work at, you know, [37:45] X frequency and it wasn't working at that frequency. So they had to come back to us [37:49] and work with them and they kind of figured where they'd screwed up and we had a metal-mask [37:52] spin. So, we took these wafers of which--three quarters we had stopped before the last metal [37:59] layers go on and had them add a new metal layer, so we had a bunch of new extra wires. [38:03] Turns out, they know all these cool tricks. The hardware guys, they filled out a lot of [38:06] extra transistors on the chip that no one has [INDISTINCT] used for. And then if you [38:10] do a new metal-mask spin, you get to pick up new transistors that you didn't ever use [38:13] before, have a need for. So, you could just route around. And I said, "Instead of running [38:17] this wire from here to there, I'm going to run it over here and do some of these transistors [38:20] that I just left lying around for this purpose and then drag it back over here." And that's [38:24] how they correct all these issues. So, they do this metal-mask spin to correct a bunch [38:27] of these issues. It turns out the second silicon is actually pretty darn functional. There [38:31] was a minor security code--fix. I think only us would have ever noticed it, but we spun [38:37] it for [INDISTINCT]. And other than that, you know, Vega 1 was alive. Two weeks from [38:43] getting this silicon to getting the OS to boot, a day later to get "hello world" out [38:47] of C program. Four days later, the "java-version" works, right? We're now--you know, you're [38:52] on the simulation and the simulator hours really paid off here. It still took us a year [38:57] to get the system robust not just the metal-spins thing. So, a lot of data-race bugs that just [39:01] never happened before because no one had ever seen a system that's out of order and concurrent [39:06] before. We got way more CPUs than anyone expects, we got way more out of order allow that anyone [39:11] hasn't seen before, all kinds of issues with just true bugs that have been found there. [39:15] A lot of performance sports. I mentioned earlier about having 4-way L2 being over committed. [39:21] Well, it was. We got a lot of conflicts. Heavy L2 miss rate is really bad, a lot of TLB miss [39:27] rates. It turns out that we can fix nearly all the L2 miss rate issues by doing random [39:32] offsets on your stacks because all the stacks were neatly aligned in one meg boundaries [39:35] and they all would charge in to about the same depth in their call tree and scribble [39:39] up and down furiously at about the same depth in their call tree all one mega offsets with [39:43] the LAN, politely in the same way in the L2 cache. And so, all eight stacks will be fighting [39:48] for 4-ways and the L2 causing endless misses. With a little ransom offsets, and poof, it [39:54] was problem solved. We deal with random offset in the code cache, a little page color in [39:59] the OS. And a lot of these issues went away, but they certainly started out there and it [40:03] turns out that it's okay to have a 4-way L2 share eight 4-way L1s. The miss rate's entirely [40:10] tolerable, but not sort of out of the door. It takes more to get there. A bunch of other [40:14] issues with the virtualization layer. I mentioned we are plug-n-play where we virtualized the [40:18] JVM to do that. That wasn't virtual enough, it was showing through. We had to fix a bunch [40:23] or words there. Anything about performance fixes up the years to make life run faster [40:27] and faster. Okay. So, what worked out of all this and what didn't? Well, the chip worked [40:35] after the second metal spin, right? Plenty of bandwidth to go around, even more CPU cycles, [40:41] unbelievable the number of CPU cycles. Certainly compared to like an X86, we have way more [40:46] MIPS per chip, MIPS per watt than X86, like five X more. It's unreal more. We eventually [40:53] got our predictive cache miss rates or it didn't happen right away. There were a lot [40:56] of funny places where we got weird miss rates due to that L2 being low sensitivity before [41:01] we finally beat out, you know, figured all the issues and solved them. CPUs remain slower [41:06] than we had ever hoped for and that's just for the limit of in-order, low-frequency CPU [41:12] and not having an uber-huge design team to go do the, you know, fabulous job you can [41:17] do on hardware there. There are a lot of hardware features that were not turned on for a long [41:22] time because we had stability issues and software. We had to get, you know, get the software [41:26] robust and reliable. You can't sell to, especially to a bank, until things are pretty rock--darn [41:30] rock solid. And so, we have our hands full with basic code gen issues and data races [41:35] and stuff like that. The hardware guys had their own set of issues fro about a year, [41:40] weird low frequency DRAM bugs. A lot of them were masked by the ECC where the hardware [41:44] had a real bug but the ECC was continuously correcting it and they eventually found out [41:51] and fixed all these issues, but it did take a while. The motherboard had to go through [41:54] quite a few iterations to get a lot of the timing issues out with the DRAMs. We can't [41:59] get a power supply that's as reliable as claimed. That was kind of surprising. I had thought [42:03] power supply would be done deal. What--you know, 2,500 watt power supply going to one [42:05] of these this big power supply vendor guys, the JITs or whoever. We have a bunch of people, [42:10] you know, sell such things and go through a specking process with us and bid and ship [42:16] us models and then they would just die in the lab straight up. "Here's this new 2,500 [42:20] watts." "You put a 2,500-watt load on it. [INDISTINCT] going to die." What the heck? [42:25] Yes. You know, what do you do? So, that went round and round a while before we got that [42:31] squared away. A bunch of scheduling problems at the OS. It's hard to schedule 800 CPUs. [42:37] It's just not a--it's not a plug-n-play solution kind of thing. A bunch of I/O stack issues [42:43] happening with the virtualization of the I/O stacks. So, it's not just virtualization is [42:47] efficient, virtualization of I/Os, that's hard. Read-barriers. Every time we get a new [42:52] integration from Sun, there are new un-barriered loads because Sun doesn't use read-barriers [42:56] in their implementation. So, we have to go finding them all and fix them and, of course, [43:01] not having a read-barrier cause some very low-frequency-hard-to-debug GC issue that [43:05] takes forever to track down. It turns out that our GC, starting at the first cut of [43:10] it, was a single generation only. We do a full GC cycle every time at a GC cycle. Now, [43:15] a GC cycle at that time would cost you 100-millisecond pause no matter how big your heap was for [43:22] 100s of gigabytes of heap, but we do it every five seconds. So, if you use Sun's code, if [43:28] you take a full GC cycle and they do some stuff during a full GC cycle they don't do [43:32] in any other time and they would normally--in the course of a business day to a full GC [43:36] cycle about once a day. We're doing them about once in every five seconds. So, we found lots [43:40] of bugs in the full GC cycle behavior that were related to the fact that they only happen [43:45] on the full GC cycle because we're doing it so much more often. So, these days where generation [43:49] on the GC is more efficient but you still got a GC cycle every five seconds for some [43:54] time. Okay. A lot of internal engineering debates raging on over, "Should we work on [44:00] stability? Should we turn on hardware transaction memory? Should we turn on stack allocation [44:03] escape detection thing? How about bigger thread pools for faster startup time, get your dating [44:09] code and get it faster, tiered compilation, generational GC, read the list. It goes on. [44:15] Turns out that Hardware Transactional Memory support and the stack allocation, the escape [44:20] protection bits both lose for a while, just out of engineering man hours. The hard problem [44:24] is to get it right. It takes a while to diagnose and fix it. We have a lot of other issues [44:28] we're debating like engineers helping with sale calls because the customers have code [44:32] that is not correct but is happening to work okay on their X86 so they die once a day in [44:38] production. And they get on the Sun box and dies every 10 minutes. And so, now, they can't [44:42] get a sales-through because, you know, your application can't run 10 minutes and falls [44:45] over, right? You got a lot of true data races in their own buggy code that they weren't [44:49] aware of. They knew they were there, they just couldn't find them. The HTM itself, the [44:54] performance of it was buggy for quite a while, mostly caught in essentially live lock where [44:59] you would attempt to transact through a lock and that would fail for whatever reason and [45:03] so you try again and make no forward progress and endlessly failing. So, essentially, live [45:08] lock, fail, fail, fail. Eventually, you track those down and flip over to the OS lock. But [45:15] you have to--after you tracked it--you know, trapped--fail out to the OS lock and go ahead [45:19] and proceed to the lock and make progress. Periodically, you have to go back and retry [45:22] the HTM because there's a lot of starter conditions for which the HTM is just going to fail and [45:26] there's no point to doing it until the systems would hit steady state and then you could [45:30] start trying the hardware transactional memory again and if it works, you can sort of bump [45:33] to steady state up as you go and you can get higher and higher through and put your issues [45:36] out, right? At this point, it's been on--turned on by default, been shipping for three years [45:40] now. It rarely helps customers for--like I said, it's mostly in another talk--it never [45:46] hurts. And occasionally, you get big wins. You get a 2X speed up or something but the [45:50] usual case is there's nothing. We always transact a couple dozen locks. It's never enough locks [45:57] that they can actually get more--throughput out of the box and it's because of other issues [46:02] that they can't get throughput out. Either the--either the--you can't transact the locks [46:06] that you need to because of true data dependencies or else it's not locking as the scaling limit. [46:11] It's the network is not fast enough, the DB is not fast enough, whatever it is, right? [46:15] Stack allocation has more issues. The good case is really good. Big busy app source can [46:20] have huge percentage of objects stack allocated but the bad cases are really bad and we just [46:26] ran out of time to go get the bad cases all squared away and our standard GC is really [46:31] good. These days, our standard GC is--we'll do a three and--we have customs with 300 gigabytes [46:36] heaps in production. Three or four hundred, 500 gigabytes heaps with 35 gigabytes a second [46:45] allocation rates with max paused times in the low tens, like 10 to 15 milliseconds. [46:50] So that's, you know, day in and day out, running continuously. So, this several orders of magnitude [46:54] better than the best you can get on a--on an X86 these days. So, we don't have any drive [46:58] to fix the bad cases, so stack allocation just lost. Oh, okay here it is. GC works really [47:08] well now. First time with a new customer, it's really common to do this, you install [47:13] the gear, you take their current command line launch, strip out all their old GC args, double [47:18] the default heap size they were running with and run again and they never have a GC problem [47:23] ever again. Now, GC is probably--and double is probably too much. You dial it back, you [47:28] trade off CPUs for GC at some point down the road, you solve all the other problems before [47:32] you get into a sales job and let the customers do the dial back and figure out the right [47:36] trade off between CPU and memory there. >> But that--is that a--is that also a result [47:41] of the fact that you're now doubling [INDISTINCT] the fact that your GC is different? [47:47] >> CLICK: It's a combination. There's all these great tuning flags that don't make any [47:51] sense on our GC at all. >> Right. [47:52] >> CLICK: And, in fact, we have no tuning flags at all on the GC. If it doesn't perform [47:56] well, then it's a bug for us and we go fix it on whatever your app is, whatever shape [48:00] GC cycle thing it's doing. So, yes, there's some combination there. Doubling the default [48:05] heap size removes a lot of corny case issues people wedge themselves into that they've [48:10] pushed themselves up to the limit and then they do all these things to try to preserve [48:15] heap space that are kind of ugly internally because they can't get a bigger heap because [48:19] the GC pauses kill them. And so as soon as you, like, uncork the GC limit, like a lot [48:24] things from this like, the caches are all too small because they can't have a big cache [48:28] because they're heap's too big, right? So as soon as you say "Okay, double the heap [48:31] size," well, immediately, they grow their caches. Well, okay. Now everything--the cache [48:34] works well. So, we made a bunch of progress there, right? So there's a bunch of stuff [48:38] going on there. I had this really cool internal profiling tool. It has a horrible name. Customers [48:45] who first saw it, like, totally demanded it. It's like, "Oh, I got to have this thing. [48:48] We're going--you give it to us now." I said, "Okay, fine. We'll give it to you." And then [48:51] now it's a major selling point. We get to see the guts of a running JVM, of every running [48:57] JVM. It's like a--always a fun profiling tool you attach to with a browser on a VM that's [49:01] been running for a month in production and it will tell you everything you can ever hope [49:05] to and want to know about a VM, you know, right now as it's running. So, it's always [49:09] on, you thread stacks, you get GC cycles, feeds and fee, you can surf the heap, you [49:14] can look at all your hot locks and all the call backs, stack traces. You get, you know, [49:18] color or color saves profiling data. Always available, always on, just plug it and look [49:22] at it and figure out what's happening. So, that's how one of these deals were. You know, [49:27] the app--the VM has been up in production for a week and then some load spike hit and [49:31] throughput on the VM drops, you know, down the toilet. What the heck happened? I can't [49:35] repo this ever in QA because I can't ever get a week run followed by the right set of [49:40] magic conditions to make it fail, so. But now I can. I mean, I don't--now I don't care. [49:44] I pull this thing out and "Oh, what's going on? Okay, now I can see." Chips, OS, they're [49:51] solid now. We have over a year in uptimes in some systems. The standard engineering [49:57] box that they do daily work on at Azul now goes down when we have power failures and [50:02] that's it. The last time it went down hard was Google chopped our chilled waterline to [50:10] our data center. I guess it went down... >> [INDISTINCT] [50:15] >> CLICK: Wash your chips. Yes, okay. Oh, here's our TPM. Okay, I do have a slide on [50:23] this. Yes, #2 feature behind the GC and the stable performance and the under load thing, [50:27] like live peek into any JVM with any web browser. Always on, no overhead, always kind of cool [50:33] stuff. >> [INDISTINCT] [50:34] >> CLICK: I--yes, yes. Like you get a snap shot and you keep refreshing the browser, [50:41] you get the new snapshot of a new stack and it's running on for how many seconds, and [50:45] then here's the new stack. >> Oh, okay, but it doesn't like [INDISTINCT]? [50:47] >> CLICK: Well, no. You can get them as fast as your browser can refresh, right? But, of [50:53] course, you're going to get--no, no, no. >> [INDISTINCT] [50:57] >> CLICK: You couldn't keep up, obviously. No, no, no. Every time you ask, it's a pool [51:02] model. You ask, you get a new stack, right? It's what stack is right now. Okay. Well, [51:06] we also have all, like, network stuff and I already mentioned that. It's like net stats [51:11] on in the VM. We know all your sockets that are open, how much I/Os are going through [51:15] them and what is it doing, where it's going, that kind of stuff. Okay, rolling along. Yes, [51:20] [INDISTINCT] came out a couple of years ago; 48 CPUs per core, higher clock rate, faster [51:24] memory bus, some tweaks to the hardware, the read barrier had to be changed to support [51:30] generational GC. We dropped some less used instructions that were not binary compatible [51:34] from generation to generation. We also changed like the encoding layout for convenience for [51:38] the guys doing decoding. So, that wasn't an instruction change but the binary bits were [51:44] different for that piece. But we actually dropped some instructions and added some others. [51:49] In 2008, we announced Vega 3. It's 54 cores. Actually, we had nine cores per cluster in [51:55] Vega 2, but we had reserved them for yield issues. So, of the nine on a core, we would [52:02] look, and if there was one dead, we would whack it out with an eye on beam, you know, [52:05] mask out game. And then you have eight. And then you go to good chip where all 48 CPUs [52:10] where all 48 CPUs are available, right? By Vega 3, the yield is so high that we just [52:16] said that we'll just keep the nine as nine. Bigger cache, higher clock rate, generational [52:21] GC, better support for profiling and better HTM. Now, we're working on 4th fourth generation [52:27] which I can't talk much about. Let's see what else is in here. Okay, some lessons learned. [52:31] Some fun stuff here, right? If you own the whole stack, hardware and up, you can do progress [52:36] even with some of the real awful hardware bugs, right? We worked around some ridiculous [52:40] things in software. Some of them, we never bothered to fix in the hardware. We just fixed [52:45] in software and we're done. Some really hard hardware problems like running out of bandwidth [52:49] is a hard hardware problem. We fixed where we improved hugely by using CLZ to cut our [52:55] bandwidth by a third. That was a big ticket item. The hardware guys like, you know, we [52:59] can give you X bandwidth and all our predictions say that's going to be real marginal. And [53:03] we said okay, we'll cut a third off and suddenly you're on a sweet spot, right? GC, I claim [53:08] it solved. Well, at least it's solved in a certain domain of the small to very large, [53:14] but not the microscopic. Not hard real time, although it's getting closer or at least you [53:19] can handle something that's quite a bit larger than anything I've ever seen anyone else handle [53:23] by, you know, two as a magnitude. We can do lock elision with some very simple hardware [53:30] transactional memory and it doesn't really help. It's very sad. We might be able to get [53:35] some help doing like N-CAS in algorithms for people who are like [INDISTINCT] who are going [53:39] to write concurrent algorithms doing very specific things where an N-CAS is going to [53:43] let them do some fancy trick they can't do any other way, but it's not going to be like [53:47] it shows up in your everyday programming work. You can't just call out an HTM and have it [53:53] do something useful for you. Okay, huge counts of simple cores has turned out to be useful [53:59] in production. That was kind of surprising. I wasn't quite sure if that was true or not. [54:03] No question, we either have faster cores, but we can get away with simple cores and [54:07] loads of them and do jobs that you can't ever do on an X86. And that is probably it. Yes. [54:16] Okay, because I'll take questions. >> So, repeat the question after. [54:19] >> CLICK: Okay. >> So, it seems like the--a lot of the features [54:26] her revolve around the garbage collection and [INDISTINCT]? [54:34] >> CLICK: Okay, so a lot of the features--the question is something like a lot of the features [54:40] here revolve around GC and wouldn't it be feasible for Intel to do something along those [54:44] lines. And the answer is that we have talked a lot within Intel and it's like moving the [54:51] Titanic, you know. It doesn't matter how hard you push, it's just like a milliliters at [54:57] a time. I don't know what it would take to get them to move. It's like--for Intel not [55:04] to do a read barrier is like an obvious crying shame and a waste of, like, huge market potential [55:10] for them to suddenly own the whole Java server market, right? For Sun not to have done it [55:16] should have been a criminal offense on their--their stockholders should have sent their, you know, [55:21] exc staff to jail for being, like--you know, after we did it and said, "Oh, look what we [55:25] can do," that they didn't immediately announce that we're doing it on our next chip was just [55:29] like criminal. What the heck? >> [INDISTINCT] [55:34] >> CLICK: Yes. Well... >> And at Sun, they [INDISTINCT]. [55:38] >> CLICK: Okay. Fine. And at Sun, they haven't. Okay, yes. So, the answer is totally Intel [55:41] could do this and totally we've attempted and I can't say more about where that's at [55:47] other than say to I'm frustrated. >> But it wouldn't just be Java. I mean, also [55:53] be [INDISTINCT], you know, all the [INDISTINCT]. >> CLICK: As Jerry points out, it's not just [55:58] Java that would get helped here. Everyone doing a managed runtime with garbage collection [56:03] would get helped here. Seems an obvious win from all parties. [56:07] >> You mentioned binary compatibility. Do you actually shift to ECC? [56:13] >> CLICK: No, no. From our customer's point of view--okay, I mentioned binary compatibility, [56:19] do we shift to ECC. The answer is we do not shift to ECC. We are not binary compatible. [56:23] Our binary compatibility layer, if you will, is Java bytecodes and we're compatible in [56:28] that sense, but in not any other way. >> So you just mentioned that to illustrate [56:32] it? >> CLICK: Yes, yes, to illustrate the fact [56:34] that we've gotten rid of the binary incompatibility bugga-boo that bytes Intel by switching to [56:39] Java bytecodes as the binary compatibility layer. [56:42] >> Well, in the read-barrier, how do you negate the cost of traps? [56:48] >> CLICK: Yes. In the read-barrier, how do we negate the cost of traps? Okay. So, the [56:53] sort of the issue is we do and we don't and it doesn't matter all together at the same [56:57] time. The--we have, in the hardware support, support for fast user-mode traps. So when [57:04] I say "fast-user mode trap," when the read-barrier traps, essentially, you get a function call [57:08] to a fixed address, takes about four clocks to get things set up and you're in the function [57:13] call and a return takes you back to where you were and you re-execute--well, you return [57:18] to the following instruction. You have to [INDISTINCT] we're trying to see if you want [57:20] to re-execute the instruction that fault it, which would be the read-barrier at default. [57:24] Okay, fine. So, that's cheap in a sense that it's actually--there's no kernel hopping. [57:27] The kernel is not involved here at all. Then the algorithm, the way the algorithm works, [57:34] when you update the faulting value, which is the value in a register, you also update [57:38] the value that faulted in memory so the next time you load it, you won't trap. So there [57:43] is sort of a self-healing property here as you--as a mutator works through his working [57:48] set, he cleans out the pointers that are in front of him that are in his way as he goes [57:53] at a cost of, you know 40 or 50 clock cycles per fail. So at a GC phase clip boundary, [58:00] when you flip the magic bit on what's correct and what falls, the mutators all throw up [58:06] a few hundred trap before they get their working set and the GC threads all furiously charge [58:11] ahead of the mutators over what they hope is teh mutator's working set, flipping that's [58:15] ahead of the mutators. And in practice, after a few hundred traps, they didn't--they quit [58:20] trapping. You know, they have a steep tail-off and then they get occasional traps way out [58:23] there but, you know mostly they quit trapping. So, the cost of a phase slip--to trap storm [58:28] that happens on a phase slip is so small that we have trouble majoring it with good hardware [58:33] performance counter implementations. So, it's got to be there, we know the exact count of [58:37] traps, it's too few to get them out here. >> So with all these cores and threads, how [58:45] do you mitigate the cost of stopping larger threads on each GC cycle? [58:51] >> CLICK: Yes, how do we--okay. With all the cores and threads, how do we mitigate to stop [58:54] of--the cost of stopping all of them? Okay. So, the first thing is that GC cycle pauses [59:01] come every few minutes and then we do cooperative self preemption as a means to stopping them. [59:10] So most of the GC pauses--most the GC cycles phase slip things you would think about, we [59:15] do with a ragged barrier. In that case, each individual core passes some line and sand, [59:22] he calls his own stack which is hot on his cache, does some GC thing, he announces to [59:27] everyone else he's done it and he carries on. When everyone announces that they've all [59:30] done it, you're done with that phase. No one CPU has ever been halted except to do a stack [59:35] crawl and verify that this stack was, you know, pretty looking--however when it's done. [59:40] There are a couple times a minute where--points you have to stop everybody. And so there you [59:45] can't start the GC issue until the last guy checks in, right? So the longest pause is [59:50] the first guy who quits going to the last guy who checks in [INDISTINCT] your GC thing [59:54] and you'll let them all go. And the cooperative self preemption, what we do is we first announce [60:00] to all threads that we want them to come to a safe point as soon as they can. And on the [60:06] flip side, threads that are knowing that they're going to go do some sort of blocking operation [60:10] including getting preempted out of the process, all come to a safe point first. So the only [60:15] guys who are running or the guys are actually on the CPU's running, everyone else is at [60:18] a safe point, so cut the thousands down to hundreds as how many CPUs you're actually [60:22] running, then the hundreds all first attempt to cooperatively safe point while the GC guys [60:28] are trying individually to shoot down the non-cooperative guys. So they have a--we call [60:32] that, you know, night of the living dead kind of race, where each guy that checks in now [60:36] goes and helps the next guy check in kind of thing. So, it's a log tree effect and they [60:40] all pull to a halt. In practice, it's usually a handful of milliseconds to drag everyone [60:46] to a halt when you have hundreds of running threads. If you have tens of running threads, [60:50] it's usually microseconds to get them all to a halt. [60:55] >> [INDISTINCT] >> CLICK: It's at the hardware level, the [61:00] chips have a--have a bit per core that says that when you pass an instruction that contains [61:06] of the corporate flavor, you'll halt--you'll trap instead--your fast user mode trap instead [61:11] of executing. It's like a couple of branch instructions. So, backwards branches to do [61:14] it. Places you put safe points in. The test for this is done by running a single instruction. [61:21] So, you go to make it happen. You go to the OS and you say, "Please tell all the CPUs [61:25] to save point themselves" and the OS replicates the message throughout all the cores saying, [61:30] light up all the bits in all these cores and then the cores will start checking in. So, [61:35] that's all done in microseconds, you know, getting the OS and have them light up all [61:38] the chips and then all the threads start lighting--coming back in at you. So, there's some hardware [61:43] support there. >> [INDISTINCT] [61:50] >> CLICK: Yes. >> [INDISTINCT] [61:54] >> CLICK: No. The GC was so good that no one--that we never got around to doing the hardware's--the [62:03] stack--the stack escape analysis--stack allocation support. As far as I know--and then the question [62:11] says has anyone else done that--as far as I know, no one has gone ahead and attempted [62:14] to do escape detection in a soft--pure software level just to see how it would work. Although [62:19] I proposed it to a number of people, I haven't seen any literatures suggesting it's been [62:23] attempted. It seems obvious to me that it should work well. You can do that kind of [62:28] escape. We did a pretty aggressive one in hardware because we could. You could do a [62:32] simpler one that wouldn't be quite as pretty in software and a handful of instructions [62:37] and that would probably be good enough to get the 50% mark which would be a big win [62:42] for a lot of these big heaps. >> So, there's some algorithms in Java [INDISTINCT] [62:47] where that--where you can trade off volatile writes versus volatile reads. And so, the--since [62:54] you're writing this in Java code, you know, but it's really hardware dependent, you have [63:02] to, like, pick a number and you say, "Well," you know, or I'm also [INDISTINCT]. What's [63:06] a Java programmer supposed to do? >> CLICK: Throw up his hands. So, what's the [63:22] cost model? >> Yes. [63:23] >> CLICK: So the question is what is the cost model for a volatile read versus volatile [63:28] write? So, you know, to be honest, you have to code the X86 platform and what's the cost [63:33] model with volatile read versus a volatile on an X86 and everyone else has to live with [63:38] whatever you do, okay? So--and onto the X86, a volatile read, I believe is almost the same [63:44] as the centers of plain old read. And a volatile write has an extra fence. The extra fence [63:50] is a cache miss which an X86 is like a thousand clocks worth of issues that didn't happen [63:56] or something horrible. You know, 300 clocks times 4 write issues or something ridiculous, [63:59] a thousand ops that didn't happen. So, you should always favor volatile reads, just period. [64:05] >> But that may take this offer and run [INDISTINCT]. >> CLICK: And, you know, to be fair, that's [64:14] our--that's our problem. Now, having said that, for us... [64:18] >> [INDISTINCT] >> CLICK: No, in GC. All GC issues that don't [64:24] work or--yes or bugs. Yes, right. For us, reads or writes that don't contend with other [64:32] threads are one clock either way. So, if you do volatile reads or volatile writes, there's [64:38] a clock for the read or the write, there's a clock more for the fence. The fence is just [64:41] one clock if you're not--and actually got contention going on. And if you got contention [64:46] going on, you probably don't have an algorithm that scales to hundreds of CPUs unless you're, [64:51] you know, you've been on one of our boxes. So, it doesn't matter. You're not going to [64:54] scale worth doodle anyhow. And that's just the case. That's the way it goes. You know, [64:59] Doug's happy when he goes to 64, but then I beat on him and say, "No, no. Do this" and [65:02] it goes to hundreds. And I have algorithms that do go to the hundreds, that go to, you [65:05] know, full out a 64. So, it can be done, it's just that it's not--it's not strict for operation. [65:10] So, you know, if Doug's not going to do it, I'm not expecting your average guy's going [65:14] to do it. So, in favor, reads. >> [INDISTINCT] [65:22] >> CLICK: Yes. So, how much told we have? So, the usual story, the way it kind of goes [65:33] is the first time you get into a customer's site, it's always an oh-my-God-save-my-bacon [65:36] kind of thing. And they already have their best people on it and they're stuck. So, you [65:42] have really sharp eyes. And you show them what's going on, you explain how it works, [65:47] you show them the RTPM stuff and they get it and then they go after it. And they, you [65:52] know, RTPM gives them the tool that they've been missing for years and years and they [65:55] tear after their own code and lo and behold, it happens. They get the performance out. [65:59] Sometimes, there's a couple rounds of sort of a lecture by me or by somebody else doing [66:05] how to write scalable code, why this or that or whatever, but not much. And then the smart [66:09] guys go to town and then they make it work. After it's been in the customer's hands for [66:13] awhile, that knowledge spreads out to more and more people. And then they get apps that [66:19] they try testing on your gear and when it doesn't work, they go to talk to their in-house [66:23] expert and they fear what's going on. So, we've gradually seen an uplifting level of [66:28] education in the market as a whole of why it's--what scale and what's not and what's [66:33] a bottleneck and what's not, why and how it all works. So, things are improving slowly. [66:38] And Google's pushing at it as well in your own way. You have a different--you have distributed [66:44] memory, but you have the scalable issue and so I'm sure you have to educate every new [66:48] programmer who comes in the door. But then, some of them will walk out and talk to the [66:51] people and so there's some of education going there. Yes, sir? Oh, I thought you raised [66:57] your hand. You're eating like this. Okay. >> [INDISTINCT] [67:03] >> CLICK: We're gone back and forth on this. Mostly, we don't want to support--we don't [67:10] handle the level of support that--we don't have enough engineers to handle that level [67:14] of support and the university as well. And if we don't handle the tool chain and then [67:18] have to help the university guys figure out what they screwed up, so, to do it, we have [67:22] to really hand them a box and say if you're on Java, we'll honor the contract on maintenance [67:27] and guarantees and the works. If you're running with anything else, well then, that's just [67:30] your problem. And that's been a harder, you know, harder job we've got. And having said [67:35] that, we do have a number of people who are putting out for government grants for boxes [67:41] and we do do academic licenses [INDISTINCT] remotely on Azul box which Doug does but sort [67:48] of like [INDISTINCT]. Grad students log in pretty routinely and run big, parallel, weird, [67:54] you know, algorithms, but they're running in Java bytecodes. [67:59] >> [INDISTINCT] >> CLICK: Yes. Oh, it's Windows. So, [INDISTINCT] [68:09] has a registered spill fill. Yes, it is variable-sized Windows than in the hardware. [68:15] >> So it's two stacks [INDISTINCT]? >> CLICK: Yes, it's two stacks. You have a [68:18] register stack and a regular sort of C execution stack. It's just to make function calls faster. [68:23] And because of its variable size, you don't have the spark issue of every [INDISTINCT] [68:26] blowing your stack out by force or whatever. >> So, how big is the [INDISTINCT]? [68:32] >> CLICK: I believe, in the Vega 3, it ended up at 64 which, given the spill fill rate, [68:40] was plenty good enough. Like, you know, look at the instruction traces. So, looking at [68:44] those hardware level traces of where the cycles go, it's much less than 1% going the register [68:50] spill fill engine like I have no desire to speak to that guy up, right? It's not--that's [68:53] not what the time goes. >> [INDISTINCT] [68:58] >> CLICK: Yes, in Vega 3, it's two instead of one. It turns out that that's fine. And [69:06] that's because you don't stall for rights to the lines that you're immediately allocating [69:12] because you've pre-zeroed them in your L1 and they've arrived just in time. And so, [69:16] they're all hot in your L1. So, all your new allocation objects, you don't do the zeroing [69:20] rights in the first place. So, it's just less rights and you also don't have to wait for [69:25] them to come in. So, you need a big store buffer to handle the cache miss. So in X86, [69:29] you want a big store buffer because you're going to get a cache miss. He predicts some [69:33] of the time and brings that line and it has to do a read and make it coherent with the [69:37] bandwidth cost. But it's not always, so he wants to be able to eat an entire cache lines [69:42] where the writes and probably actually several cache lines with the writes because that's [69:45] how far you're going to get behind if he gets behind there, right? I know Spark has a giant [69:51] write buffer and they did it because they're running Java code for which what they would--but [69:53] what happened to them would be people, you know, do a bunch of writes and rode to zero [69:59] out new objects and they weren't in their cache and so they--suddenly they had to eat [70:03] those writes or stall. So, they put a giant write buffer in. [70:05] >> So, you mentioned that especially in the read-barrier that [INDISTINCT]. [70:15] >> CLICK: Yes >> So, are you saying [INDISTINCT]? [70:19] >> CLICK: So, the question is, you know, what's the collector style, is it a copying collector [70:22] or what? There are phase flips. It's a--there's a VEE 2005 paper that describes the algorithm [70:29] in a lot more detail. >> Paul Lucchesi? [70:31] >> CLICK: Yes, Paul Lucchesi paper. So, it's a--it's a copying collector. We copy every [70:35] cycle. We copy the whole heap every cycle and compact. [70:38] >> What wastage [INDISTINCT]? >> CLICK: Wastage in what way? [70:42] >> [INDISTINCT] >> CLICK: What? Extra what? Extra CPUs? We [70:47] always get extra CPUs. >> [INDISTINCT] [70:54] >> CLICK: Apparently, the GC guys never seem to mind or tear anything. There's no issue [71:04] there. One of the games that goes on is that we don't have to run the heap so close to [71:11] the auto-memory state that other collectors end up getting because of the pause issue. [71:17] So, we typically have a sort of a generous slop extra on the heap and then that eases [71:23] a lot of GC pressures. But when you run the box down to a tighter and tighter memory limits, [71:28] the GC cycle is faster and faster, it burns CPU. But it will comfortably run at, you know, [71:33] 10%, 20% over live heap. You'll just be burning a lot of CPU to do it. This is--it's not necessarily [71:42] where you want to set yourself. >> Great. Thanks. [71:48] >> CLICK: Thank you.