Tomorrow Corp Unveils In-House Stack With Reverse Time Debugging
retrogameinternals
Unifying the language, compiler, and engine offloads determinism directly to the development environment, enabling programmers to isolate memory corruptions and crashes backwards in time without defensive code.
AI-assisted summary of Tomorrow Corporation Tech Demo — original source. Check the original for full context.
Source published:
Key ideas
- Tomorrow Corporation engineered a completely custom, full-stack game development environment—including its own programming language, incremental compiler, editor, debugger, and engine—inspired by Naughty Dog's PS2-era GOAL toolchain. (0:00)
- The custom compiler generates native machine code on every keystroke with near-zero perceptual latency across 13,000-line files, while supporting always-on reverse execution without specialized build configurations. (1:40)
- A compact 64-bit intrinsic timestamp primitive allows developers to uniquely tag entities and allocations, enabling the debugger to teleport directly back to the exact machine state where an object was created. (4:11)
- Deterministic session replays recalculate simulation and rendering live across hot-reloaded assets and recompiles, and can be shared studio-wide without dirtying the recipient's local workspace. (7:33)
- Time-travel debugging with reverse data breakpoints allows developers to immediately pinpoint the root cause of off-by-one buffer overflows and memory stomps without reproducing them through trial-and-error logging. (12:31)
Detailed notes
## Background Published on YouTube by retrogameinternals (Tomorrow Corporation programmer Allan Blomquist) on February 21, 2023, this video showcases internal programming and debugging tools developed in-house at indie studio Tomorrow Corporation. According to the video description, it serves as a technical demonstration of the bespoke suite the team built over many years to make their video games.
## TL;DR Tomorrow Corporation engine programmer Allan Blomquist demonstrates the studio's custom, vertically integrated tech stack, which encompasses a bespoke programming language, instant incremental native compiler, code editor, debugger, and engine. Using a port of Human Resource Machine, he demonstrates keystroke-level hot-recompilation, live mid-frame rendering during debugger stepping, and dynamic call-graph profiling linked to compact 64-bit timestamps. The presentation highlights unified deterministic session scrubbing across code and runtime states, as well as portable session recordings that allow team members to seamlessly reproduce crashes and solve dreaded memory stomps using reverse data breakpoints.
## Atmosphere & style The presentation maintains a calm, measured, and refreshingly understated tone, unfolding as an intimate, practical developer-to-developer walkthrough rather than a glossy tech keynote. Blomquist speaks with quiet humility and dry humor, casually cracking jokes about canceling evening plans over memory stomps or pointing out the frowning boss on their custom panic screen. The viewing experience feels quietly revelatory, generating a sense of technical awe as notoriously difficult engineering challenges—like instant recompilation, time-travel debugging, and bit-accurate replay—are performed effortlessly without friction.
## Bulletin - [00:00](https://www.youtube.com/watch?v=72y2EC5fkcE&t=0s) Tomorrow Corporation engineered a completely custom, full-stack game development environment—including its own programming language, incremental compiler, editor, debugger, and engine—inspired by Naughty Dog's PS2-era GOAL toolchain. - [01:40](https://www.youtube.com/watch?v=72y2EC5fkcE&t=100s) The custom compiler generates native machine code on every keystroke with near-zero perceptual latency across 13,000-line files, while supporting always-on reverse execution without specialized build configurations. - [04:11](https://www.youtube.com/watch?v=72y2EC5fkcE&t=251s) A compact 64-bit intrinsic timestamp primitive allows developers to uniquely tag entities and allocations, enabling the debugger to teleport directly back to the exact machine state where an object was created. - [07:33](https://www.youtube.com/watch?v=72y2EC5fkcE&t=453s) Deterministic session replays recalculate simulation and rendering live across hot-reloaded assets and recompiles, and can be shared studio-wide without dirtying the recipient's local workspace. - [12:31](https://www.youtube.com/watch?v=72y2EC5fkcE&t=751s) Time-travel debugging with reverse data breakpoints allows developers to immediately pinpoint the root cause of off-by-one buffer overflows and memory stomps without reproducing them through trial-and-error logging.
## Key takeaways - [00:00](https://www.youtube.com/watch?v=72y2EC5fkcE&t=0s) Tomorrow Corporation developed a proprietary, bottom-up game creation toolchain encompassing a custom language, compiler, editor, debugger, and engine, inspired by Naughty Dog's GOAL toolchain. - [00:00](https://www.youtube.com/watch?v=72y2EC5fkcE&t=0s) The toolchain is general-purpose across Tomorrow Corporation's catalog, as evidenced by a fully functional internal port of their puzzle title Human Resource Machine. - [01:40](https://www.youtube.com/watch?v=72y2EC5fkcE&t=100s) Incremental native compilation executes on every single keystroke, allowing instant hot-reloading of executable game logic across 13,000-line source files without noticeable lag. - [01:40](https://www.youtube.com/watch?v=72y2EC5fkcE&t=100s) Deep coupling between the debugger and the engine keeps the rendering pipeline active during breakpoints, enabling incremental mid-frame draw-call inspection. - [01:40](https://www.youtube.com/watch?v=72y2EC5fkcE&t=100s) Reverse execution—including step-backward, backward breakpoints, and backward hardware data breakpoints—is an always-on feature requiring no specialized builds or recording runs. - [04:11](https://www.youtube.com/watch?v=72y2EC5fkcE&t=251s) Call graph profiling instrumentation can be dynamically injected into or removed from the compiled binary on the fly without restarting the game. - [04:11](https://www.youtube.com/watch?v=72y2EC5fkcE&t=251s) Clicking an execution timestamp directly inside the performance profiler header immediately teleports the live debugger into that exact historical invocation on that specific frame. - [04:11](https://www.youtube.com/watch?v=72y2EC5fkcE&t=251s) A cheap 64-bit runtime intrinsic timestamp enables developers to tag game entities and allocations to track their exact provenance and inspect their instantiation state retroactively. - [07:33](https://www.youtube.com/watch?v=72y2EC5fkcE&t=453s) The whole-session scrubber recalculates game simulation and graphics dynamically rather than streaming pre-recorded video, maintaining determinism across code changes and asset reloads. - [07:33](https://www.youtube.com/watch?v=72y2EC5fkcE&t=453s) The code editor maintains timeline synchronization with the engine, automatically displaying the exact historical state of the source code corresponding to the point being scrubbed. - [07:33](https://www.youtube.com/watch?v=72y2EC5fkcE&t=453s) By baking determinism into the language, compiler, engine, and debugger simultaneously, gameplay programmers are freed from writing fragile defensive code to maintain replay fidelity. - [10:07](https://www.youtube.com/watch?v=72y2EC5fkcE&t=607s) Lightweight deterministic recording sessions are generated routinely by artists, designers, and programmers alike to package reproducible issues across the studio. - [10:07](https://www.youtube.com/watch?v=72y2EC5fkcE&t=607s) The custom build pipeline virtualizes and isolates session dependencies, letting recipients replay foreign sessions without overwriting or conflicting with their local working copies. - [10:51](https://www.youtube.com/watch?v=72y2EC5fkcE&t=651s) When replaying fatal crashes, developers can scrub through the user's prior actions, jump from panic screens directly to source code, and step backward out of call stacks. - [12:31](https://www.youtube.com/watch?v=72y2EC5fkcE&t=751s) Setting reverse hardware data breakpoints on stomped memory addresses allows developers to run execution backwards directly to the off-by-one buffer write that caused the corruption. - [12:31](https://www.youtube.com/watch?v=72y2EC5fkcE&t=751s) Integrating time-travel debugging and deterministic replay directly into the development infrastructure eliminates the lengthy reproduction and print-debugging cycles common in native game programming.
## Detailed walkthrough ### [00:00](https://www.youtube.com/watch?v=72y2EC5fkcE&t=0s) Building a Custom Toolchain from Scratch
Allan Blomquist, the engine and low-level programmer at indie studio Tomorrow Corporation, introduces an internal suite of custom-built programming and debugging tools developed over more than a decade. Rather than relying on commercial engines or off-the-shelf IDEs, Tomorrow Corporation built an entirely custom tech stack spanning their own programming language, compiler front end and back end, code editor, debugger, build system, and game engine. Blomquist traces the origin of this ambition back years to reading about GOAL (Game Oriented Assembly Lisp), the proprietary language and toolchain created by Naughty Dog for their PlayStation 2 titles: “I remember reading about that and just thinking that this is obviously like the coolest thing that I've ever heard of it didn't seem like something that you could even do.”
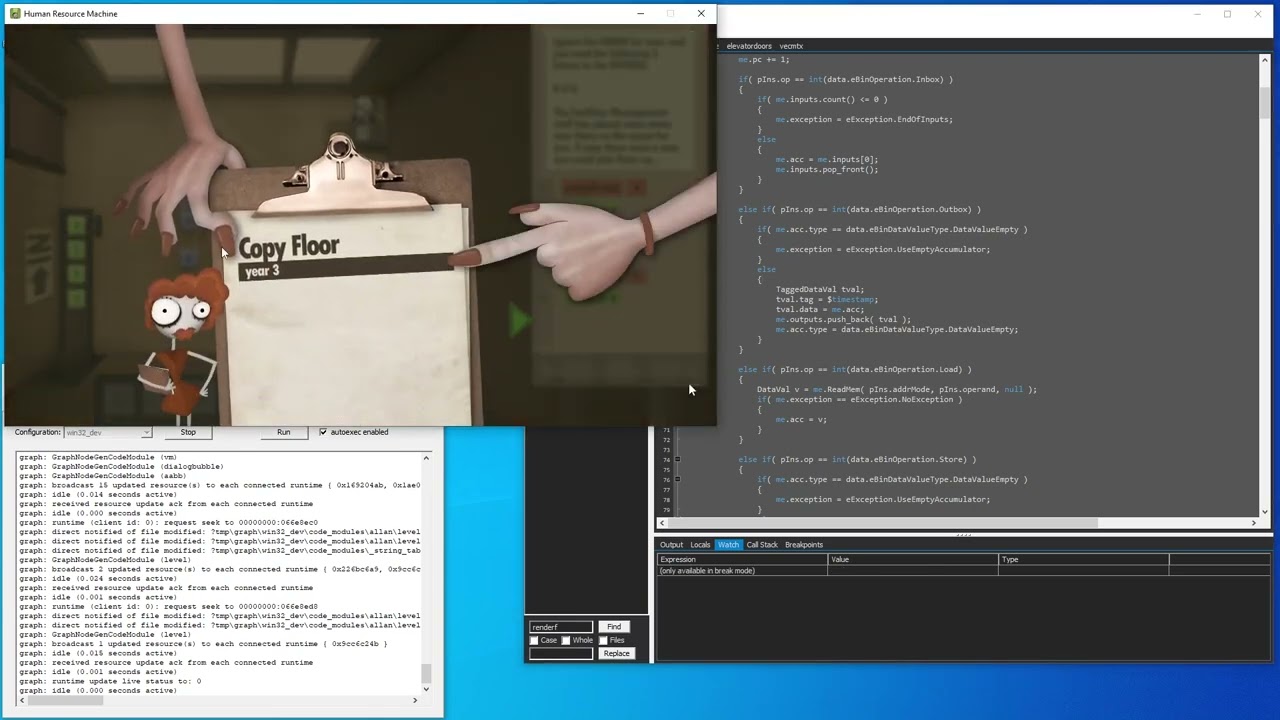
About four or five years prior to this demonstration, Blomquist received the opportunity to build a similar bespoke toolchain internally at Tomorrow Corporation, turning it into a dedicated passion project. To ground the showcase in a practical setting rather than an artificial toy example, Blomquist runs a port of the studio’s puzzle game *Human Resource Machine*. While *Human Resource Machine*—a game themed around assembly programming—was not originally developed with these tools, the port demonstrates that the environment is fully general and designed to support any of the company’s games.
- **Developer:** Allan Blomquist, Tomorrow Corporation. - **Scope of In-House Tech:** Custom programming language, custom compiler (front end and back end), code editor, debugger, build system, and game engine. - **Key Historical Inspiration:** Naughty Dog’s GOAL toolchain used during the PlayStation 2 era. - **Demonstration Game:** A port of *Human Resource Machine*.
---
[01:40](https://www.youtube.com/watch?v=72y2EC5fkcE&t=100s) Hot-Loading Assets, Fast Incremental Code Compilation, and Live Debugging
Blomquist begins with the standard foundation of interactive development: hot-loading data assets. Opening a game texture in an image editor, he draws on it and saves the file, showing how the sprite immediately refreshes inside the active game window without requiring a restart. From there, he extends the exact same interactive loop to executable code. In the custom code editor, he edits the logic governing the green UI boxes on the left side of the screen. Because the compiler is incremental and generates native machine code rapidly, it recompiles on every single keystroke. The game updates in real time with virtually zero perceptual latency, even when modifying a 13,000-line source file.
Moving to the rendering code for the blue floor tiles, Blomquist reveals how tightly the custom debugger is coupled with the custom engine. Setting a breakpoint at the start of a rendering function halts the game mid-frame, leaving the scene partially drawn. As Blomquist steps through draw calls one instruction at a time, each graphic element renders sequentially onto the viewport. Because the debugger controls the runtime engine, it keeps the graphics pipeline alive and interactive during stepping—functioning like a built-in graphics debugger to quickly isolate visual glitches.
Furthermore, the debugger includes full reverse execution. Blomquist steps backward using inverse variants of standard navigation: step into, step over, step out, run backward to breakpoint, and run backward to hardware data breakpoints. Blomquist highlights the massive debugging advantage of these backwards operations: “And being able to debug backwards from an assert or a crash especially with a data break point is insanely helpful in being able to figure out and fix bugs.” Crucially, reverse debugging is not a separate, high-overhead mode requiring a specialized executable; it operates natively all the time during everyday development.
```mermaid flowchart TD accTitle: Custom Toolchain Architecture accDescr: Diagram illustrating the interactive feedback loop between the editor, compiler, engine, and debugger.
subgraph DevEnvironment["Development Environment"] Editor["Custom Editor / Keypress"] Compiler["Incremental Native Compiler"] Debugger["Integrated Debugger"] end
subgraph Runtime["Live Game Runtime"] Engine["Custom Game Engine"] Viewport["Live Framebuffer Display"] end
Editor -->|"Every keystroke"| Compiler Compiler -->|"Native hot-patching"| Engine Debugger <-->|"Step forward / backward"| Engine Engine -->|"Partial frame rendering"| Viewport ```
- **Compilation Performance:** Native code generation on every keystroke with near-zero latency across 13,000-line files. - **Live Frame Stepping:** Keeps the swapchain/viewport alive during breakpoints, rendering draw calls incrementally. - **Reverse Debugging Capabilities:** Step backward (in, over, out), run backward to execution breakpoints, and run backward to hardware data breakpoints. - **Always-On Architecture:** Reverse execution requires no separate build configuration or recording pass.
---
[04:11](https://www.youtube.com/watch?v=72y2EC5fkcE&t=251s) Timestamp Profiling and 64-Bit State Intrinsic Tagging
Switching to the game window, Blomquist turns to the in-game performance profiler. By default, profiler instrumentation is omitted from builds to preserve execution speed. Clicking "Enable" triggers an immediate, seamless recompile of the game code with call graph instrumentation injected on the fly. Observing frame-time spikes in the profiler's call graph, Blomquist freezes data collection and inspects an expensive frame dominated by a single function. In a conventional profiler, clicking the function navigates to the static source code; here, Blomquist clicks an execution timestamp in the timeline header.
Because the system supports backward execution, clicking the timestamp teleports the debugger directly to that exact runtime invocation on that specific frame. Stepping into the frozen call, Blomquist inspects the local variables and discovers the delay was triggered by an unfavorable random number. Once identified, he deletes the offending code, resumes execution, re-profiles to confirm the spike is gone, and recompiles the instrumentation out of the binary without missing a beat.
Beyond automatic profiling tags, the programming language exposes an intrinsic that evaluates at runtime to return a compact 64-bit execution timestamp. Developers can attach this timestamp to game entities, allocations, and events to retain full provenance: “These time stamps are super cheap to generate and they're only 64 bits so you can use them to tag pretty much everything with what effectively is the entire state of the program and then you can go back later and inspect anything you need to if you want to find out where something came from or why it didn't get cleaned up or whatever you want to know.” In the demo, Blomquist breaks into the debugger to inspect three boxes placed on a conveyor belt. By reading the 64-bit timestamp stored in the middle box's struct, he instantly jumps the debugger back in time to the precise instant the character tossed that specific box onto the belt.
- **Dynamic Profiler Instrumentation:** On-the-fly native recompilation injects or removes call-graph profiling without restarting the game. - **Timestamp Navigation:** Clicking profiler frames transports the execution state directly to the exact call site and machine state of that frame. - **64-Bit Intrinsic Timestamps:** Cheap, low-overhead primitives that uniquely capture the complete execution state across time. - **Potential Use Cases:** Tracking memory allocations, enemy spawns, combat hit reactions, door transitions, or state leak debugging.
---
[07:33](https://www.youtube.com/watch?v=72y2EC5fkcE&t=453s) Whole-Session Deterministic Replay and Historical Code Scrubbing
Blomquist escalates the demonstration by bringing up the in-game developer console, revealing a full timeline scrubber and media playback controls that cover the entire session. The scrubber is not replaying a captured video recording; it is recalculating the game's actual simulation and rendering passes on demand. The timeline remains completely consistent across everything Blomquist did throughout the session—including hot-reloading textures, changing UI rendering code, and executing full compiler rebuilds for the profiler. Blomquist emphasizes that the system was deliberately designed to eliminate dead ends: “I specifically wanted to try not to have one-way streets in this functionality so using one feature doesn't rule out using a different one later on.”
When Blomquist scrubs the timeline back to a point prior to modifying the box-drawing routine, the code editor reflects the change. Opening the source while stopped at that past frame reveals the original code before it was edited, because the editor itself tracks timeline state alongside the runtime. This coherence enables retroactive profiling: if a hitch occurs while playtesting, the developer can pause, scrub back, inspect the performance spike, and debug without attempting to manually reproduce the bug.
Traditional deterministic replay architectures are notorious for being fragile, requiring developers to write defensive code to avoid desynchronization. Because Tomorrow Corporation built their language, compiler, engine, and debugger together, deterministic tracking is pushed into the infrastructure itself: “...in our case since we've created every level of this stack to support this we can super efficiently offload the determinism stuff to the development environment and essentially you can just write whatever code you want without having to spend any time thinking about whether or not you're breaking something.” Finally, the engine automatically outputs a lightweight session file containing this timeline on every game run. Integrated directly with their version control system, the stored session files remain tiny while allowing robust, bit-accurate replays far into the future.
- **Unified Scrubbing:** Re-simulates and re-renders full gameplay history on demand, surviving code recompilations and asset hot-loads. - **Time-Aware Editor:** The code editor displays the exact state of the source code corresponding to the point in time currently being scrubbed or debugged. - **Retroactive Hitch Profiling:** Spontaneous performance frame drops can be rewound and profiled after the fact without reproduction setups. - **Low-Overhead Session Files:** Session timelines serialize to small disk files tied into version control, ensuring long-term replay compatibility.
[10:07](https://www.youtube.com/watch?v=72y2EC5fkcE&t=607s) Portable Recording Sessions and Build System Integration
Allan Blomquist explains that recording session files are not merely produced by programmers; everyone across the entire studio team generates them routinely during development. These session packages are completely portable across machines and roles. If a level designer is tuning a puzzle and notices an unexpected behavior or encounters a random visual anomaly, they can instantly package the recorded session and send it to anyone else at the studio to be replayed live and debugged under full instrumentation.
Crucially, this system is tightly coupled with Tomorrow Corporation’s custom build pipeline and source control infrastructure. The tool guarantees that a session will replay deterministically on another developer's rig regardless of divergence in the underlying codebases:
```mermaid flowchart TD accTitle: Portable Session Debugging Architecture accDescr: Flow showing how a session recorded with local changes can be cleanly loaded on another developer machine without file conflicts.
subgraph Sender["Designer / Originating Machine"] A["Designer records session<br/>(contains uncommitted local edits)"] --> B["Portable Session Bundle<br/>(inputs, state, build artifacts)"] end
subgraph Receiver["Developer / Debugging Machine"] B --> C["Tomorrow Corp Build System"] C --> D["Isolates required assets & source revision"] D --> E["Live Deterministic Playback<br/>(Local files untouched & safe)"] end ```
The system retrieves and matches all exact dependencies, binaries, and state data required to execute the run without disturbing the recipient's working copy. Allan Blomquist underscores the safety and convenience of this design: “The system can get all the data it needs to play back the session and it doesn't touch any of my actual local files in the process so there isn't any risk of me losing work if something went wrong.”
- **Cross-discipline usage**: Designers, artists, and testers generate the identical deterministic recordings used by engine programmers. - **Revision tolerance**: Sessions remain functional even if the originating user had dirty uncommitted modifications and the recipient is sitting on a completely different source control commit with their own uncommitted edits. - **Local file isolation**: Playback environments virtualize the necessary dependencies so no active work in progress on the host machine is overwritten or dirtied.
---
[10:51](https://www.youtube.com/watch?v=72y2EC5fkcE&t=651s) Replaying a Crash and Navigating Backwards in the Call Stack
Blomquist loads a pre-packaged session recorded by a teammate whose build terminated abnormally with a fatal crash. Running the replay directly to its terminus reproduces an unhandled memory access violation. On the screen, the custom crash handler surfaces the distinctive supervisor character from *Human Resource Machine*, prompting Allan Blomquist to joke: “And you can see that the boss from Human Resource Machine lives on our Panic screen and he's not happy with me right now.”
Instead of staring at a static post-mortem crash dump, Blomquist leverages the timeline slider to scrub back through the user's run to observe the exact sequence of player actions that led to the failure. He watches the player successfully complete a level, return to the code workspace to optimize their assembly-like solution, run the level a second time, and immediately trigger the crash.
Blomquist clicks the top frame of the call stack, jumping directly from the interactive playback into the integrated source code editor right at the failing line. Recognizing that the access violation was caused by dereferencing a null pointer that had been passed into the function as a parameter, he executes a reverse step-out instruction to step execution back out of the function call to the callsite. There, he inspects the surrounding conditional block, which was supposed to assign that pointer depending on whether the game was executing in normal play mode or phone play mode.
Examining the conditional state exposes an immediate problem: the `playMode` variable holds an invalid integer value that does not correspond to any valid enumerator in the enumeration declaration. When he inspects the raw binary bit pattern of this corrupted variable, Blomquist recognizes the IEEE 754 bit layout for the floating-point value `1.0f`.
---
[12:31](https://www.youtube.com/watch?v=72y2EC5fkcE&t=751s) Reverse Data Breakpoints and Catching Memory Stomps
A corrupted variable displaying a floating-point pattern inside an integer enum field typically indicates an out-of-bounds write or memory stomp—one of the most dreaded bugs in native game programming. Allan Blomquist quips about the traditional despair such issues cause: “So at this point you're thinking this looks like a memory stomp and I better cancel my plans because who long who knows how long it's going to take me to figure this out.”
Instead of guessing or manually narrowing down writes, Blomquist drags the corrupted `playMode` variable directly into his debugger watch window and sets a reverse data breakpoint (watchpoint) directly on that memory address. He commands the execution engine to run backwards in time. The time-travel debugger instantly halts at the precise instruction that executed the offending memory write:
```mermaid flowchart LR accTitle: Buffer Overflow Memory Stomp Sequence accDescr: Sequence showing how an off-by-one bounds check caused a float write to stomp an adjacent playMode enum.
A["Buffer write index starts at 15"] --> B["Index increments to 16"] B --> C["Comparison checks: index > capacity (16)"] C -->|"Flawed check evaluates false"| D["Write float 1.0f past buffer bounds"] D --> E["Stomps memory address of playMode enum"] ```
The write instruction is an assignment writing `1.0` into a floating-point buffer. Stepping backward a few instructions before the assignment exposes an off-by-one bounds check error: - The buffer write index was initialized at `15`. - The index was incremented to `16`. - The bounds logic checked if the index was strictly greater than the buffer capacity of `16` (`index > capacity`), rather than checking if it was greater than or equal to the capacity (`index >= capacity`). - Because `16 > 16` evaluated to false, the index failed to wrap back around to zero, causing the code to write past the end of the array directly into the adjacent memory where the `playMode` enum resided.
Blomquist acknowledges that while this specific bug was contrived for the demonstration, real-world engine development is plagued by similar memory corruptions. He reflects on how painful such problems are with traditional toolchains: “And you can imagine that if I were attacking this with printfs or something instead I might be in for kind of a long night.” He notes that most everyday bugs do not even reach this level of complexity—they are simply mundane logic errors in gameplay scripts—making them trivial to isolate and resolve using deterministic time-travel replay tools. Blomquist then concludes the presentation by thanking the viewers and pointing them to Tomorrow Corporation's website for further updates.
## Notable quotes > [01:40](https://www.youtube.com/watch?v=72y2EC5fkcE&t=100s) And being able to debug backwards from an assert or a crash especially with a data break point is insanely helpful in being able to figure out and fix bugs. — Allan Blomquist
## Mentioned Allan Blomquist, Tomorrow Corporation, Human Resource Machine, GOAL (Game Oriented Assembly Lisp), Naughty Dog, PlayStation 2, IEEE 754
## Video description A demonstration of some of the internal programming and debugging tools we use at Tomorrow Corporation to make video games.
Our company website: https://tomorrowcorporation.com
My personal twitter: https://twitter.com/allan_blomquist
[Source](https://www.youtube.com/watch?v=72y2EC5fkcE)