Felix Sets 5% Rule on Home Costs to Debunk Rent-Versus-Mortgage Math
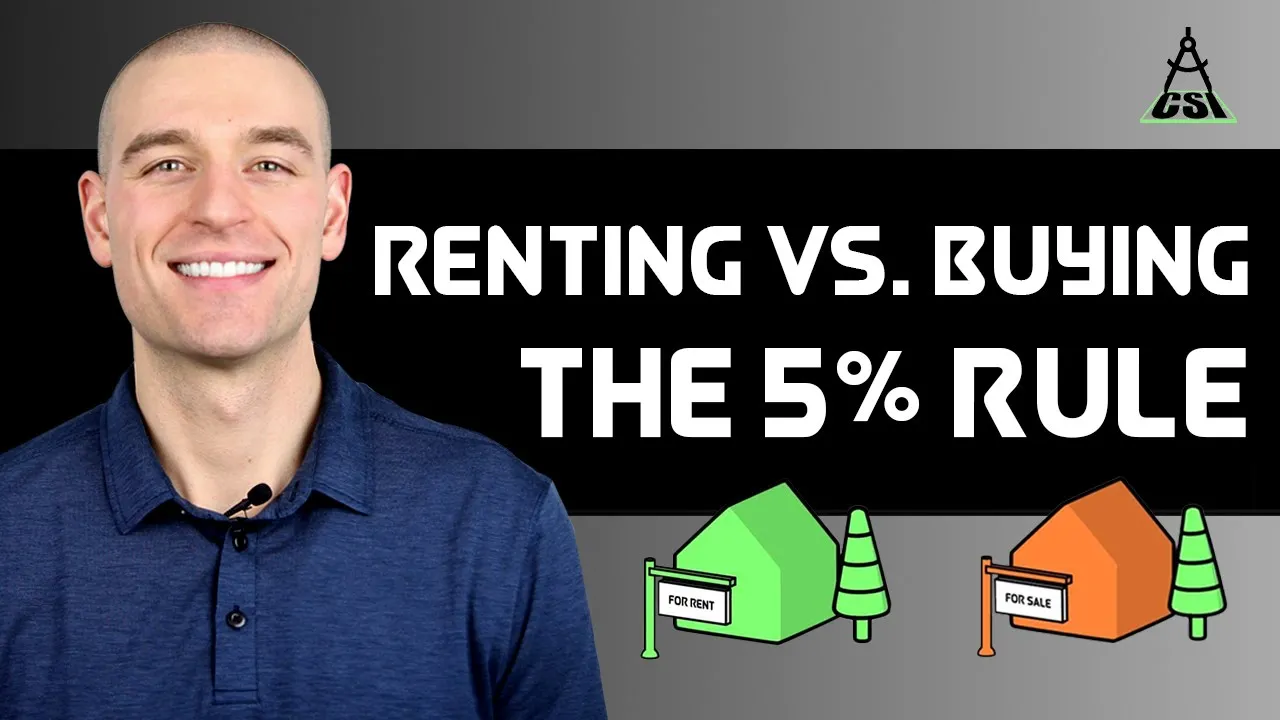
Ben Felix
Homeowners incur roughly 5% of property value each year in unrecoverable taxes, maintenance, and capital costs, making renting mathematically superior whenever monthly rent falls below that annual total divided by 12.
AI-assisted summary of Renting vs. Buying a Home: The 5% Rule — original source. Check the original for full context.
Source published:
Key ideas
- Comparing monthly mortgage payments directly to rent is fundamentally flawed because mortgage payments build equity while rent is purely an unrecoverable operational expense. (0:00)
- Homeownership incurs an estimated 5% annual unrecoverable cost consisting of property taxes (1%), maintenance (1%), and cost of capital (3%). (1:28)
- Under the 5% Rule, renting is mathematically preferable if equivalent housing can be rented for less than the purchase price multiplied by 5% and divided by 12. (6:13)
- The benchmark adjusts downward to 4% for conservative investors or those investing in taxable accounts, as lower expected investment returns reduce the opportunity cost of equity. (7:33)
Detailed notes
## Background Published by portfolio manager Ben Felix on YouTube on May 11, 2019, this video addresses the flawed intuition of comparing monthly mortgage payments directly to rent. The video description explains that a sound housing decision requires evaluating total unrecoverable costs, offering a simplified calculation originally framed for a Canadian audience.
## TL;DR Ben Felix argues that comparing a mortgage payment to monthly rent is fundamentally flawed because it ignores the unrecoverable operational and capital costs of homeownership. He establishes the '5% Rule,' which breaks down annual unrecoverable home costs into roughly 1% for property taxes, 1% for maintenance, and 3% for the cost of capital, reflecting both mortgage interest and the opportunity cost of forgone global stock returns. Multiplying a home's purchase price by 5% and dividing by 12 provides a clean monthly threshold where renting a comparable home becomes mathematically advantageous. The benchmark can also be adjusted down to approximately 4% for individuals in higher tax brackets or those maintaining conservative, bond-heavy portfolios.
## Atmosphere & style The presentation is calm, analytical, and intensely methodical, devoid of emotional real estate salesmanship. Felix speaks with deliberate, authoritative clarity, relying on historical market data and clean balance-sheet logic to unpack a topic often clouded by cultural assumptions. The experience feels like a grounded, academic consultation with a financial advisor who systematically replaces gut instinct with disciplined mathematical modeling.
## Bulletin - [00:00](https://www.youtube.com/watch?v=Uwl3-jBNEd4&t=0s) Comparing monthly mortgage payments directly to rent is fundamentally flawed because mortgage payments build equity while rent is purely an unrecoverable operational expense. - [01:28](https://www.youtube.com/watch?v=Uwl3-jBNEd4&t=88s) Homeownership incurs an estimated 5% annual unrecoverable cost consisting of property taxes (1%), maintenance (1%), and cost of capital (3%). - [06:13](https://www.youtube.com/watch?v=Uwl3-jBNEd4&t=373s) Under the 5% Rule, renting is mathematically preferable if equivalent housing can be rented for less than the purchase price multiplied by 5% and divided by 12. - [07:33](https://www.youtube.com/watch?v=Uwl3-jBNEd4&t=453s) The benchmark adjusts downward to 4% for conservative investors or those investing in taxable accounts, as lower expected investment returns reduce the opportunity cost of equity.
## Key takeaways - [00:00](https://www.youtube.com/watch?v=Uwl3-jBNEd4&t=0s) Evaluating rent versus buying requires comparing the total unrecoverable costs of both options rather than mortgage payments to rent. - [00:00](https://www.youtube.com/watch?v=Uwl3-jBNEd4&t=0s) An unrecoverable cost is capital spent that delivers zero residual equity or financial value to the spender. - [01:28](https://www.youtube.com/watch?v=Uwl3-jBNEd4&t=88s) Property taxes represent a pure unrecoverable fee averaging roughly 1% of a home's market value annually. - [01:28](https://www.youtube.com/watch?v=Uwl3-jBNEd4&t=88s) Ongoing home maintenance reliably costs approximately 1% of a home's asset value each year across routine fixes and major capital repairs. - [01:28](https://www.youtube.com/watch?v=Uwl3-jBNEd4&t=88s) The cost of capital covers both borrowed debt (mortgage interest) and equity capital committed as a down payment. - [01:28](https://www.youtube.com/watch?v=Uwl3-jBNEd4&t=88s) Mortgage debt interest averaged approximately 3% in prevailing market conditions, representing an unrecoverable financing cost. - [03:06](https://www.youtube.com/watch?v=Uwl3-jBNEd4&t=186s) Down payment equity carries an economic opportunity cost equivalent to the expected return premium of equities over real estate. - [03:06](https://www.youtube.com/watch?v=Uwl3-jBNEd4&t=186s) Historical data from 1900 to 2017 shows global real estate returned 1.3% real compared to 5.2% real for equities. - [03:06](https://www.youtube.com/watch?v=Uwl3-jBNEd4&t=186s) Recent regional real estate surges cannot be projected to continue indefinitely because markets price assets based on forward expectations. - [03:06](https://www.youtube.com/watch?v=Uwl3-jBNEd4&t=186s) PWL Capital models a forward nominal equity return of 6.57%, establishing a conservative 3% opportunity cost premium over real estate. - [06:13](https://www.youtube.com/watch?v=Uwl3-jBNEd4&t=373s) Because both the cost of debt and the cost of equity equal approximately 3%, the cost of capital totals 3% regardless of leverage. - [06:13](https://www.youtube.com/watch?v=Uwl3-jBNEd4&t=373s) Summing 1% property tax, 1% maintenance, and 3% cost of capital produces the 5% annual unrecoverable cost of homeownership. - [06:13](https://www.youtube.com/watch?v=Uwl3-jBNEd4&t=373s) A $500,000 property incurs roughly $2,083 per month in unrecoverable costs, making renting below that amount a financially sound alternative. - [06:13](https://www.youtube.com/watch?v=Uwl3-jBNEd4&t=373s) A $3,000 monthly rent payment is financially equivalent to the unrecoverable carrying costs of owning a $720,000 home. - [07:33](https://www.youtube.com/watch?v=Uwl3-jBNEd4&t=453s) Taxable investment accounts reduce after-tax expected equity returns, effectively lowering the equity opportunity cost of buying a home. - [07:33](https://www.youtube.com/watch?v=Uwl3-jBNEd4&t=453s) Investors with conservative asset allocations or taxable portfolios should adjust the benchmark downward to a 4% rule.
## Detailed walkthrough ### [00:00](https://www.youtube.com/watch?v=Uwl3-jBNEd4&t=0s) The Flawed Comparison of Rent vs. Mortgage
Portfolio manager Ben Felix begins by tackling a deeply ingrained real estate assumption: the belief that if someone can buy a house and pay a monthly mortgage that matches or undercuts their monthly rent, purchasing the property is automatically a smart financial choice. Felix rejects this intuition outright, insisting that this framework blinds prospective buyers to reality. A mortgage payment blends distinct financial mechanisms—repaying principal while servicing debt—whereas rent is a pure operational expense. Attempting to match these two numbers on a napkin is fundamentally comparing apples to oranges.
Instead, Felix argues that a sound financial evaluation requires comparing only the true "unrecoverable costs" of renting against the unrecoverable costs of owning. An unrecoverable cost represents money spent with zero residual value returned to the spender. For renters, identifying this unrecoverable cost is straightforward: it is simply the full amount paid in monthly rent. Homeowners, however, face unrecoverable costs that are far more concealed beneath monthly principal paydowns.
As Ben Felix puts it bluntly: > “Comparing a mortgage payment to rent is not an apples to apples comparison.”
[01:28](https://www.youtube.com/watch?v=Uwl3-jBNEd4&t=88s) Deconstructing Homeownership's Unrecoverable Costs
To evaluate the true ongoing drag of homeownership, Felix categorizes ownership costs into three core pillars: property taxes, maintenance, and the cost of capital. Property taxes represent a direct fee paid to local governments simply for owning the land and structure, carrying no residual equity whatsoever. As a baseline guideline, property taxes reliably average roughly 1% of the property's total market value each year, serving as the first constituent of his framework.
The second component is ongoing maintenance. Felix acknowledges that tracking maintenance expenses is notoriously difficult because reliable macroeconomic data is sparse, and the costs range from massive, lumpy capital outlays like replacing a roof or gut-renovating a kitchen down to small routine expenses like re-caulking a bathroom bathtub. Nevertheless, broad industry consensus sets long-term average maintenance reserves at 1% of the property's value annually.
Finally, Felix introduces the third and most consequential component: the cost of capital. This cost must be separated into debt capital and equity capital. If a buyer puts 20% down on a home purchase and finances the remaining 80% through a conventional mortgage, the borrowed debt accumulates explicit interest expenses. Observing market rates available online in April 2019, Felix identifies mortgage interest rates floating just above and below 3%, setting 3% as a reasonable unrecoverable debt financing cost.
```mermaid flowchart TD accTitle: The 5% Rule Cost Breakdown accDescr: Three unrecoverable costs of homeownership summing to five percent of property value.
subgraph OwnershipCosts["Homeownership Unrecoverable Costs (5% Total)"] PT["Property Taxes: 1%"] MC["Maintenance Costs: 1%"] subgraph Capital["Cost of Capital: 3%"] Debt["Cost of Debt (Mortgage Interest) ~3%"] Equity["Cost of Equity (Opportunity Cost) ~3%"] end end
PT --> Total["5% Total Unrecoverable Annual Cost"] MC --> Total Capital --> Total ```
[03:06](https://www.youtube.com/watch?v=Uwl3-jBNEd4&t=186s) The Cost of Equity and Long-Term Market Returns
While property taxes, maintenance, and debt interest are relatively intuitive, Felix emphasizes that the cost of equity capital is far less obvious to buyers. When an individual commits 20% cash down on a property, they forgo the opportunity to leave that capital compounded in global equities. This forgone return is not hypothetical; it represents a genuine economic opportunity cost. Estimating this opportunity cost requires establishing realistic, long-term expected returns for both real estate and equities.
Drawing on historical figures from *The Credit Suisse Global Investment Returns Yearbook 2018*, which tracks asset classes dating back to 1900, Felix notes that global real estate delivered an annualized real return (net of inflation) of 1.3% from 1900 through 2017, compared to 5.2% real for equities. Assuming a baseline inflation rate of 1.7%, nominal expected returns shake out to 3.0% for real estate and 6.9% for equities. Felix addresses common objections from Canadian viewers who argue that Ontario housing returns easily hit 5% to 10% annually:
> “We can't assume that high recent historical returns like we've had Canada will persist forever.”
Markets set asset prices according to current information; no seller would accept $500,000 today if they knew with certainty that a buyer could pocket $550,000 one year later. Historical global stock figures already incorporate catastrophic disruptions, such as the total wipeout of Russian and Chinese equity markets and the destruction of two World Wars. Rather than relying on simple past averages, PWL Capital models future stock returns by blending 50-year trailing returns with current cyclically adjusted valuations based on price-to-earnings ratios. Given elevated market valuations in 2019, PWL projects a forward nominal equity return of 6.57%.
- Real estate global real return (1900–2017): 1.3% (3.0% nominal at 1.7% inflation). - Global equity historical real return (1900–2017): 5.2% (6.9% nominal at 1.7% inflation). - PWL Capital forward nominal return projection for 100% equities: 6.57%. - Net difference in expected return (equity opportunity cost over real estate): 3.57%, rounded conservatively down to 3.0%.
[06:13](https://www.youtube.com/watch?v=Uwl3-jBNEd4&t=373s) The 5% Rule Mechanics and Practical Examples
Because the conservative 3% cost of equity capital mirrors the prevailing 3% cost of debt capital, the homeowner's total cost of capital comes out to 3% regardless of the exact leverage or down payment ratio used. Combining this 3% cost of capital with 1% for property taxes and 1% for ongoing property maintenance produces the overarching 5% Rule: a homeowner reliably pays approximately 5% of their home's total asset value every year in purely unrecoverable expenses.
To apply this rule in daily life, prospective movers can perform a quick two-way calculation: 1. **Evaluating a purchase:** Take the purchase price of the home, multiply it by 5%, and divide the result by 12. If comparable rental housing costs less per month than this calculated threshold, renting is the mathematically superior choice. For a $500,000 home, the annual unrecoverable cost is $25,000, which equals $2,083 per month. 2. **Evaluating a rental:** Take the monthly rental rate, multiply by 12, and divide by 5% (0.05). A $3,000 per month lease implies an annual cost of $36,000. Dividing by 0.05 reveals that renting at $3,000 per month is financially equivalent to shouldering the unrecoverable costs of owning a $720,000 home.
As Felix summarizes the decision boundary: > “Take the value of the home that you were considering, multiplied by 5% and divide by 12. If you can rent for less than that then renting is a sensible financial decision.”
| Home Value / Rent Metric | Calculation | Monthly Unrecoverable Equivalent | |:--- |:--- |:--- | | **$500,000 Home Purchase** | $(\$500,000 \times 0.05) \div 12$ | **$2,083 / month** in ownership costs | | **$3,000 / month Rental Unit** | $(\$3,000 \times 12) \div 0.05$ | **$720,000** equivalent home purchase price |
[07:33](https://www.youtube.com/watch?v=Uwl3-jBNEd4&t=453s) Nuances: Taxes, Asset Allocation, and the 4% Adjustment
Felix acknowledges that the standard 5% rule is necessarily an oversimplification. The equity opportunity cost hinges directly on tax shelters and risk tolerance. The baseline 6.57% expected equity return represents a pre-tax figure, which holds true inside registered tax-advantaged accounts such as a Canadian RRSP (Registered Retirement Savings Plan) or TFSA (Tax-Free Savings Account). However, for an investor subject to Ontario's top marginal tax bracket in 2019 investing in a taxable account, after-tax equity returns compress down toward roughly 4.6%.
Likewise, if an investor maintains a balanced or conservative portfolio containing bonds rather than a 100% equity allocation, the expected portfolio return falls, which shrinks the gap between real estate appreciation and alternative investment returns. When the opportunity cost of equity declines, the overall unrecoverable cost of homeownership drops along with it.
Felix highlights this counter-intuitive dynamic clearly: > “The cost of owning a home decreases if you have maxed out your registered accounts or if you can't handle the volatility of an aggressive portfolio.”
Consequently, while aggressive stock investors who have unused contribution room in their RRSP and TFSA should benchmark against the full 5% rule, taxable investors or those holding conservative portfolios should dial the ownership cost estimate downward to roughly 4%. Either way, framing the dilemma around true unrecoverable drag transforms an emotionally clouded housing decision into a disciplined, apples-to-apples comparison.
[10:04](https://www.youtube.com/watch?v=Uwl3-jBNEd4&t=604s) Outro and The Rational Reminder Podcast
Wrapping up the discussion, Ben Felix points viewers toward additional content if they have reached the end of his YouTube catalog. He invites the audience to seek out his other long-form audio discussions if they want to continue exploring evidence-based personal finance and investing concepts.
Ben Felix concludes the video with a direct invitation: “If you've run out of 'Common Sense Investing' videos to watch, you can tune into weekly episodes of The 'Rational Reminder' podcast wherever you get your podcasts.” The video then fades out to upbeat background music.
## Notable quotes > [06:13](https://www.youtube.com/watch?v=Uwl3-jBNEd4&t=373s) Take the value of the home that you were considering, multiplied by 5% and divide by 12. If you can rent for less than that then renting is a sensible financial decision. — Ben Felix
> [00:00](https://www.youtube.com/watch?v=Uwl3-jBNEd4&t=0s) Comparing a mortgage payment to rent is not an apples to apples comparison. — Ben Felix
> [07:33](https://www.youtube.com/watch?v=Uwl3-jBNEd4&t=453s) The cost of owning a home decreases if you have maxed out your registered accounts or if you can't handle the volatility of an aggressive portfolio. — Ben Felix
## Mentioned Ben Felix, PWL Capital, The Credit Suisse Global Investment Returns Yearbook 2018, RRSP, TFSA, The Rational Reminder podcast, Common Sense Investing
## Video description Meet with PWL Capital: https://calendly.com/d/3vm-t2j-h3p
Please note that while this content is broadly applicable, it was originally intended for a Canadian audience.
You can't compare rent to a mortgage payment. This way of thinking about the rent versus buy decision is extremely flawed. Comparing a mortgage payment to rent is not an apples to apples comparison. In order to properly assess the rent versus buy decision, we need to compare the total *unrecoverable costs* of renting to the total unrecoverable costs of owning.
That may sound like a complicated task, but I have boiled it down to a simple calculation.
Referenced in this video: The Case for Renting a Home – Part 1 - https://www.pwlcapital.com/the-case-for-renting-a-home-part-1/ The Case for Renting a Home – Part 2 - https://www.pwlcapital.com/the-case-for-renting-a-home-part-2/ The Case for Renting - https://www.pwlcapital.com/resources/the-case-for-renting/ The Credit Suisse Global Investment Returns Yearbook 2018 - https://www.credit-suisse.com/media/assets/corporate/docs/about-us/media/media-release/2018/02/giry-summary-2018.pdf
Read up on more investing advice, insights and white papers here. https://www.pwlcapital.com/teams/passmore-felix/?utm_source=youtube&utm_medium=copy&utm_campaign=ben2019&utm_content=5percent
------------------ Follow Ben Felix on - Twitter: https://twitter.com/benjaminwfelix - LinkedIn: https://www.linkedin.com/in/benjaminwfelix/
PWL Capital Blog Post: https://www.pwlcapital.com/rent-or-own-your-home-5-rule/
Follow PWL Capital on: - Twitter: https://twitter.com/PWLCapital - Facebook: https://www.facebook.com/PWLCapital - LinkedIn: https://www.linkedin.com/company/pwl-capital/
You can find the Rational Reminder podcast on Google Podcasts: https://www.google.com/podcasts?feed=aHR0cHM6Ly9yYXRpb25hbHJlbWluZGVyLmxpYnN5bi5jb20vcnNz Apple Podcasts: https://itunes.apple.com/ca/podcast/the-rational-reminder-podcast/id1426530582?mt=2 Spotify Podcasts: https://open.spotify.com/show/6RHWTH9iW7hdnA7eAg7ukO?si=hjZNfLKuSjSeWX38GPqhVA ------------------
[Source](https://www.youtube.com/watch?v=Uwl3-jBNEd4)