Kevin Chen Builds HDR Photo Processor Inside Microsoft Excel
!!Con 2017: HDR Photography in Microsoft Excel?! by Kevin Chen — Confreaks

Confreaks

Solving an overdetermined system of linear equations via pseudoinverse matrices allows basic spreadsheet cells to invert camera response curves and reconstruct high dynamic range photographs.

AI-assisted summary of !!Con 2017: HDR Photography in Microsoft Excel?! by Kevin Chen — original source. Check the original for full context.

Source published:

Key ideas

  • Kevin Chen demonstrated that foundational high dynamic range (HDR) photography algorithms can be executed entirely within Microsoft Excel by modeling the reconstruction as an overdetermined system of linear equations. (0:00)
  • Because camera sensors exhibit nonlinear response curves, merging bracketed exposures requires recovering the inverse response function using a Moore–Penrose pseudoinverse. (3:08)
  • Transforming Excel into a functional raster display using square cells and conditional formatting across eight exposure sheets consumed approximately 13 gigabytes of RAM. (7:06)
  • The final radiance calculation required writing an expansive formula in Sublime Text, successfully recovering blown-out stained-glass window details inside Excel. (9:59)

Detailed notes

## Background Presented by Kevin Chen at !!Con 2017 and published on YouTube by Confreaks on May 18, 2017, this talk demonstrates how to build an end-to-end High Dynamic Range (HDR) photography pipeline entirely inside Microsoft Excel. As detailed in the video description, Chen explains the foundational linear algebra behind HDR imaging algorithms—specifically solving systems of linear equations—and jokingly frames the spreadsheet implementation as the ultimate enterprise-ready alternative to specialized software.

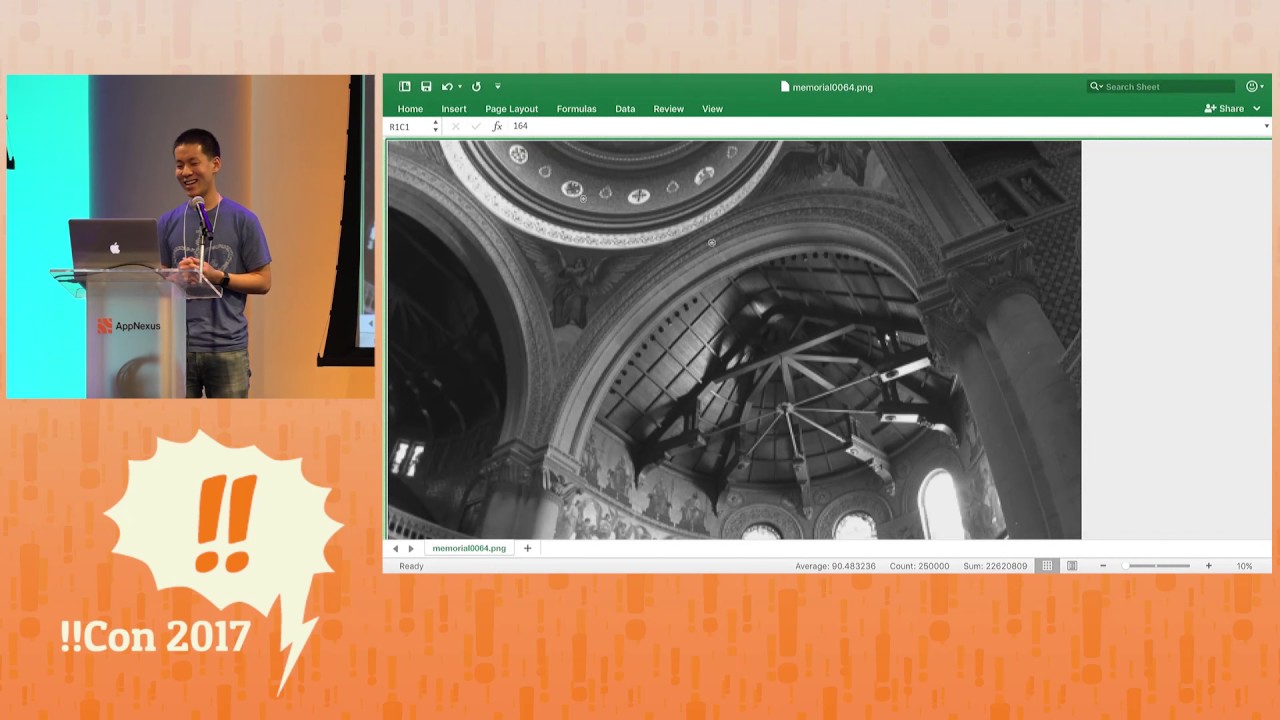
## TL;DR Chen demonstrates how high dynamic range photography merges bracketed exposures by resolving the camera's nonlinear response curve into a system of linear equations ($Ax = b$). Because Excel lacks native support for non-square matrix pseudoinverses, he uses an algebraic decomposition to recover the inverse camera response function. He then imports eight exposure brackets into separate spreadsheet tabs, turning the cell grid into a functional raster display using conditional formatting gradients. After assembling a massive formula drafted in Sublime Text to compute a weighted radiance map, Excel successfully computes and renders a composite HDR image that restores blown-out details in church stained-glass windows.

## Atmosphere & style The presentation is a hilarious blend of deadpan technical comedy and genuine computational ingenuity, playing straight into corporate office satire. Chen maintains an earnest, lighthearted delivery as he juxtaposes complex camera sensor physics with vintage WordArt, 13-gigabyte RAM spikes, and absurdly oversized spreadsheet formulas. Watching it feels like a joyful hackathon stunt where rigorous image science meets deliberate software misuse, culminating in a triumphant, applause-filled payoff when the spreadsheet actually renders a readable photograph.

## Bulletin - [00:00](https://www.youtube.com/watch?v=bkQJdaGGVM8&t=0s) Kevin Chen demonstrated that foundational high dynamic range (HDR) photography algorithms can be executed entirely within Microsoft Excel by modeling the reconstruction as an overdetermined system of linear equations. - [03:08](https://www.youtube.com/watch?v=bkQJdaGGVM8&t=188s) Because camera sensors exhibit nonlinear response curves, merging bracketed exposures requires recovering the inverse response function using a Moore–Penrose pseudoinverse. - [07:06](https://www.youtube.com/watch?v=bkQJdaGGVM8&t=426s) Transforming Excel into a functional raster display using square cells and conditional formatting across eight exposure sheets consumed approximately 13 gigabytes of RAM. - [09:59](https://www.youtube.com/watch?v=bkQJdaGGVM8&t=599s) The final radiance calculation required writing an expansive formula in Sublime Text, successfully recovering blown-out stained-glass window details inside Excel.

## Key takeaways - [00:00](https://www.youtube.com/watch?v=bkQJdaGGVM8&t=0s) High dynamic range photography resolves scenes with extreme highlight and shadow contrasts by capturing and blending multiple bracketed exposures. - [00:00](https://www.youtube.com/watch?v=bkQJdaGGVM8&t=0s) The fundamental principle of reciprocity dictates that doubling the shutter duration admits twice as much light into the camera. - [01:46](https://www.youtube.com/watch?v=bkQJdaGGVM8&t=106s) Digital cameras exhibit nonlinear response curves, meaning doubling exposure time does not simply double stored JPEG pixel values. - [01:46](https://www.youtube.com/watch?v=bkQJdaGGVM8&t=106s) The implementation relies on foundational 1990s research by Debevec and Malik from UC Berkeley on recovering high dynamic range radiance maps. - [03:08](https://www.youtube.com/watch?v=bkQJdaGGVM8&t=188s) The camera's response can be expressed mathematically as g(Z) = ln(radiance) + ln(Δt), where g represents the unknown inverse response function. - [03:08](https://www.youtube.com/watch?v=bkQJdaGGVM8&t=188s) Evaluating sample pixels across multiple shutter speeds forms an overdetermined system of linear equations Ax = b. - [03:08](https://www.youtube.com/watch?v=bkQJdaGGVM8&t=188s) Because Excel lacks native non-square matrix inversion, the Moore–Penrose pseudoinverse was implemented using the algebraic expansion (A^T A)^-1 A^T. - [07:06](https://www.youtube.com/watch?v=bkQJdaGGVM8&t=426s) Excel was turned into a raster display by resizing cells into small squares and applying color gradient conditional formatting over the raw integer data. - [07:06](https://www.youtube.com/watch?v=bkQJdaGGVM8&t=426s) Handling eight sheets of conditionally formatted raw image data required 13 gigabytes of RAM, prompting a system reboot. - [07:06](https://www.youtube.com/watch?v=bkQJdaGGVM8&t=426s) To keep the linear system computationally feasible, Chen sampled a targeted subset of pixel coordinates across the image rather than the entire frame. - [09:59](https://www.youtube.com/watch?v=bkQJdaGGVM8&t=599s) The final tone-mapping formula required external drafting in Sublime Text because it was too large for Excel's standard formula bar. - [11:10](https://www.youtube.com/watch?v=bkQJdaGGVM8&t=670s) The final composite successfully reconstructed stained glass imagery depicting Jesus on the cross that was completely blown out in standard exposures.

## Detailed walkthrough ### [00:00](https://www.youtube.com/watch?v=bkQJdaGGVM8&t=0s) The Premise: High Dynamic Range in Microsoft Excel

Kevin Chen introduces a classic photography dilemma: taking a picture where highlights are blown out or shadows are crushed, obscuring the detail in the scene. While photographers solve this by shooting bracketed exposures and fusing them using a high dynamic range (HDR) algorithm, Chen connects this to corporate office culture, deadpanning: “And as any business person will tell you the right platform to implement your Solutions is always Microsoft Excel.” He concludes that the only sensible course of action is building an HDR pipeline inside a spreadsheet.

He breaks down the intuitive idea of merging pictures: take two photographs of the same scene where one is brighter than the other, cut out the blown-out portions of the brighter image, and paste in the preserved details from the darker exposure. However, to seamlessly blend them, the pasted darker areas must be brightened up to match the surrounding scene. Doing so requires knowing exactly how much to brighten the pixel values, which leads into camera mechanics.

- Camera shutters open and close to admit light onto the sensor or film. - The fundamental rule of exposure discussed is the principle of reciprocity: keeping the shutter open twice as long allows twice as much light into the camera.

[01:46](https://www.youtube.com/watch?v=bkQJdaGGVM8&t=106s) Camera Response Curves and Nonlinearity

At first glance, doubling the exposure time might seem like a simple arithmetic operation where every pixel value in the image file can simply be multiplied by two. However, digital cameras exhibit nonlinearity: the sensor and onboard image processing pipeline do not map incoming light directly to pixel values on a purely proportional scale. A graph of the camera response curve demonstrates that stepping up the light on the horizontal axis by equal increments yields varying changes in the resulting output JPEG numbers. As Chen points out, “two times more light doesn't mean you're going to get a twice as big number inside your file.”

To combine exposures correctly, one must deduce the camera’s internal response curve. Chen reassures the audience that this problem was solved in the 1990s by researchers at UC Berkeley (referencing the foundational Debevec and Malik paper on recovering high dynamic range radiance maps). However, their paper relies heavily on rigorous mathematical equations, which Chen jokes would bore corporate business stakeholders. To fix this, he frames the solution with emojis, diagrams, and corporate buzzwords, remarking that “now there's a lot of synergy right now.”

```mermaid flowchart LR accTitle: Camera Response Nonlinearity accDescr: Diagram showing how physical scene radiance through exposure time maps nonlinearly into stored digital values.

subgraph Scene["Physical World"] L["Light / Scene Radiance (E)"] DeltaT["Shutter Time (Δt)"] L --> Exposure["Exposure (E × Δt)"] DeltaT --> Exposure end

subgraph Camera["Camera Pipeline"] Exposure -->|"Nonlinear Response F(E × Δt)"| JPEG["Digital Pixel Value (Z)"] end

subgraph Recovery["Inverse Mapping"] JPEG -.->|"Inverse Function g(Z)"| Exposure end ```

[03:08](https://www.youtube.com/watch?v=bkQJdaGGVM8&t=188s) Formulating the System of Linear Equations

To explain how the unknown response curve is reconstructed without intimidating equations, Chen analyzes a single roof pixel across three photos taken at doubling shutter speeds.

- The first pixel starts with a digital brightness value of 31. - Doubling the light for the second shot does not yield 62, but an arbitrary value like 78 due to the nonlinear response. - Doubling the light again for the third shot similarly results in a non-doubled value.

Plotting these data points reveals the relative amount of light separating those specific digital levels. While a single pixel location only provides a few sample points, repeating this measurement across multiple distinct pixel locations throughout the image fills in the gaps, ultimately reconstructing the entire inverse response function, denoted as $g$.

Chen formalizes the relationship mathematically. The digital pixel value $Z$ is generated by an unknown function $f$ operating on exposure, which equals scene radiance (brightness) multiplied by shutter duration ($\Delta t$):

$$Z = f(\text{radiance} \times \Delta t)$$

Because the digital values $Z$ are known and the physical radiance is unknown, the goal is to invert $f$. Defining $g = f^{-1}$ produces an equation for each pixel $i$ in each exposure $j$:

$$g(Z_{ij}) = \ln(\text{radiance}_i) + \ln(\Delta t_j)$$

Chen explains that this is not merely a single equation: “now this actually this equation down here I've written it as one equation but it's actually a template that can be used to create many equations”. Evaluating this template for every sampled pixel across all exposures forms an overdetermined system of linear equations $Ax = b$. Setting up and solving this requires linear algebra. To invert the non-square matrix $A$, a Moore–Penrose pseudoinverse (denoted with a plus superscript) is necessary. Because Microsoft Excel only provides standard matrix inversion functions (`MINVERSE`) for square matrices, Chen searches the web for a workaround, discovering an algebraic decomposition on a site called *Math Asse*:

$$(A^T A)^{-1} A^T$$

He jokes to the audience: “and you know that this equation is legit because it comes from a website called math ass”.

[07:06](https://www.youtube.com/watch?v=bkQJdaGGVM8&t=426s) Building the Spreadsheet Image Engine

With the mathematical formulation established, Chen transitions into Microsoft Excel to construct the solver and visualizer. Raw pixel intensity numbers are pasted into cells across eight sheets corresponding to eight bracketed exposures. To make these grids of raw integers visually intelligible, Chen relies on Excel's conditional formatting, assigning a color gradient from dark to light across the cell ranges and resizing the cells into tiny squares. Zooming out transforms the spreadsheet into a functioning raster display. Chen humorously summarizes the milestone: “so that's the first step to Turning Excel into an image editor.”

Running eight full sheets of conditionally formatted pixel cells quickly consumes 13 gigabytes of RAM. Staying in character as an “obedient Microsoft customer,” Chen reboots his computer to clear memory before proceeding.

- Rather than calculating every pixel across the large images, he selects a subset of sample coordinates across the scene to keep the system tractable. - To document his spreadsheet logic, he uses WordArt instead of regular comments, lamenting that modern Excel lacks the classic styles: “these are all really boring Styles um you know I want like the rainbow one and like the 3D one um but fortunately fifth grade me had the foresight to save one of each type of word art into this file.” - An extraction sheet aggregates the chosen pixel coordinates across all eight exposures, arranging the values into organized columns. - The matrix sheet, zoomed out to 10%, visualizes the giant $A$ matrix by conditionally formatting non-zero values in red to display the matrix structure.

```mermaid flowchart TD accTitle: Excel HDR Processing Pipeline accDescr: The workflow used inside Microsoft Excel to sample pixels, build the A matrix, compute the response function, and output an HDR image.

subgraph DataPrep["1. Exposure Grid & Sampling"] P["8 Bracketed Exposures<br>(Pixel values in cells)"] --> CF["Square Cells + Conditional Formatting<br>(Visual raster preview)"] CF --> Samp["Coordinate Sampling Sheet<br>(Select representative points)"] end

subgraph LinearAlgebra["2. Linear System & Response Curve"] Samp --> MatA["Matrix Assembly Sheet<br>(Sparse A Matrix highlighted in red)"] MatA --> PInv["Pseudoinverse Calculation<br>((A^T A)^-1 A^T)"] PInv --> GFunc["g Function Recovery<br>(Inverse camera response curve)"] end

subgraph Rendering["3. Final Radiance Map"] GFunc --> Subl["Sublime Text Formula<br>(Weighted averaging across 8 shots)"] Subl --> Output["Final Tone-Mapped Canvas<br>(Restored stained-glass detail)"] end ```

[09:59](https://www.youtube.com/watch?v=bkQJdaGGVM8&t=599s) Solving and Tone-Mapping the Final Result

Applying the pseudoinverse formula directly within Excel's formula bar extracts the vector representing the discrete points of the $g$ response function. With the camera response function calibrated, the final radiance map must be reconstructed and displayed. The Excel formula required to map each cell’s pixel value through the recovered $g$ function, normalize by exposure duration, and apply a weighted average across all eight exposures grew too unwieldy for the spreadsheet's native formula bar, forcing Chen to compose it in Sublime Text.

Chen pastes the massive formula into the master sheet. The computation freezes Excel for approximately 30 seconds before rendering the finished composite. The resulting image successfully recovers both shadows and highlights, clearly revealing stained-glass artwork in bright church windows that was completely blown out to pure white in the standard exposures.

[11:10](https://www.youtube.com/watch?v=bkQJdaGGVM8&t=670s) Reconstructed Stained Glass and Endorsements for Microsoft Office

Kevin points to the final high dynamic range image rendered inside the spreadsheet to show that the technique worked. Looking closely at the previously blown-out church window, the newly recovered detail reveals stained glass artwork depicting Jesus on the cross alongside imagery in the neighboring windows. Because the algorithm successfully captured and combined the full range of exposures, the mission is officially complete. Playing into the running joke about enterprise tools, Kevin notes that corporate users everywhere can celebrate the victory: “And so this means we’re successful and our business people are so happy now because they can uninstall Photoshop and only use Microsoft Excel.”

Wrapping up the presentation to audience laughter, Kevin makes a humorous parting request to anyone who enjoyed watching an image processing pipeline built inside a grid of cells. He invites attendees to visit his website, navigate over to his LinkedIn profile, and submit a very specific recommendation: “So that’s all I have, if you like this please go to my website, click on LinkedIn, and don’t forget to endorse me for Microsoft Office.” The talk concludes with a warm round of applause from the audience.

## Notable quotes > [01:46](https://www.youtube.com/watch?v=bkQJdaGGVM8&t=106s) two times more light doesn't mean you're going to get a twice as big number inside your file. — Kevin Chen

## Mentioned Kevin Chen, Microsoft Excel, !!Con, Confreaks, Columbia University, UC Berkeley, Debevec and Malik, Math Asse, Sublime Text, Adobe Photoshop, Microsoft Office, LinkedIn, WordArt

## Video description HDR Photography in Microsoft Excel?! by Kevin Chen

Have you ever taken a photo with areas that are too bright or too dark? As any photographer will tell you, high dynamic range photography is the right way to solve your problem. And, as any businessperson will tell you, Microsoft Excel is the right platform to implement your solution.

In this talk, I’ll explain the algorithm from one of the foundational papers about HDR imaging — no prior image processing knowledge required. Turns out, it’s just a system of linear equations! So, obviously, the next step is to implement HDR in a spreadsheet. Because we can. The end result reveals how this complicated-sounding algorithm boils down to a few simple ideas.

Kevin is an amateur photographer and Microsoft Office enthusiast. He also studies computer science at Columbia University.

[Source](https://www.youtube.com/watch?v=bkQJdaGGVM8)

中文简报

Kevin Chen 在微软 Excel 中构建 HDR 照片处理器 通过伪逆矩阵求解超定线性方程组,使基础电子表格单元格能够反转相机响应曲线并重建高动态范围照片。 Chen 展示了高动态范围摄影如何通过将相机的非线性响应曲线解析为线性方程组($Ax = b$)来合并包围曝光图像。由于 Excel 原生不支持非方阵的伪逆运算,他利用代数分解来还原相机的反响应函数。随后,他将八张包围曝光照片导入到不同的电子表格标签页中,利用条件格式渐变将单元格网格转化为功能性的光栅显示器。在利用 Sublime Text 编写并组合出一个用于计算加权辐射度图的庞大公式后,Excel 成功计算并渲染出一张复合 HDR 图像,还原了教堂彩色玻璃窗中过曝的细节。 Kevin Chen 演示了通过将重建建模为超定线性方程组,基础高动态范围(HDR)摄影算法完全可以在微软 Excel 中运行。 (0:00) 由于相机传感器具有非线性响应曲线,合并包围曝光图像需要使用摩尔-彭罗斯伪逆来恢复反响应函数。 (3:08) 在八个曝光工作表中使用方形单元格和条件格式将 Excel 转换为功能性的光栅显示器,消耗了约 13 GB 的内存。 (7:06) 最终的辐射度计算需要先在 Sublime Text 中编写一个庞大的公式,并成功在 Excel 内部恢复了过曝的彩色玻璃窗细节。 (9:59)

Reading summary

Kevin Chen demonstrates how to build an end-to-end High Dynamic Range (HDR) image processing pipeline inside Microsoft Excel, using foundational computer vision algorithms and spreadsheet linear algebra to reconstruct lost scene details. Camera Nonlinearity and the Reciprocity Principle (1:46) Standard high dynamic range photography combines bracketed exposures to resolve scenes where highlights are blown out or shadows are crushed. While the principle of reciprocity dictates that doubling the shutter duration doubles the light reaching the camera sensor, digital cameras exhibit a nonlinear response curve. The sensor and onboard image pipeline do not map incoming light proportionally to file values; for example, doubling the exposure of a pixel with a value of 31 might produce a value like 78 rather than 62. To accurately blend darker and brighter shots without visible seams, the camera's internal response curve must be deduced and inverted. Chen grounds his approach in the 1990s UC Berkeley research by Debevec and Malik, which established that measuring changes in pixel intensity across varying exposure times enables recovery of the scene's original physical radiance. Formulating the Overdetermined Linear System (3:08) Chen models digital pixel values as an unknown nonlinear function operating on exposure, defined as scene radiance multiplied by shutter duration ($Z = f(\text{radiance} \times \Delta t)$). Inverting this into $g = f^{-1}$ yields the equation template $g(Z_{ij}) = \ln(\text{radiance}_i) + \ln(\Delta t_j)$ for every pixel $i$ and exposure $j$. Evaluating this template across sampled pixels from multiple photographs creates an overdetermined system of linear equations, $Ax = b$. Because Excel's native `MINVERSE` function is restricted to square matrices, Chen bypasses this limitation by setting up the Moore–Penrose pseudoinverse using the algebraic decomposition $(A^T A)^{-1} A^T$ to solve for the inverse response curve $g$. Transforming Spreadsheet Grids into Raster Displays (7:06) To render images inside Excel, Chen pasted raw integer pixel values across eight separate sheets corresponding to eight bracketed exposures. Resizing the cells into tiny squares and applying conditional formatting gradients converted the sheets into functioning raster displays. However, loading eight full sheets of conditionally formatted cells consumed 13 gigabytes of RAM, requiring a system reboot to clear memory. To make processing computationally tractable, Chen extracted a representative subset of pixel coordinates across the exposures into a dedicated extraction sheet. He also created an assembly sheet zoomed out to 10%, conditionally formatting non-zero matrix values in red to visualize the sparse structure of the large $A$ matrix. Pseudoinverse Computation and Final Radiance Recovery (9:59) Using the pseudoinverse formula in Excel, Chen extracted the discrete values for the inverse response function $g$. To generate the final tone-mapped composite, each pixel across the exposures had to be mapped through $g$, normalized by its shutter speed, and combined using a weighted average. Because the resulting mathematical formula exceeded the input limits of Excel's native formula bar, Chen authored it externally in Sublime Text before pasting it into the master sheet. The final calculation froze the application for approximately 30 seconds before rendering a composite image. The reconstruction successfully recovered blown-out highlights in a church window, revealing detailed stained-glass artwork depicting Jesus on the cross alongside neighboring panels. Chen's demonstration proves that core computer vision algorithms can be fully executed within a spreadsheet environment, albeit constrained by memory overhead, square-matrix function limitations, and formula bar length restrictions.

精炼阅读摘要

Kevin Chen 在演讲中展示了如何完全利用电子表格软件 Microsoft Excel 构建高动态范围(HDR)图像处理流水线,通过线性代数求解相机非线性响应曲线,成功复原高光与阴影中的图像细节。 相机响应的非线性与互易律限制 (1:46) HDR 摄影的核心目标是解决单张照片中高光过曝或阴影死黑的细节缺失问题,通常做法是对同一场景拍摄不同曝光时间的包围曝光照片并进行融合。摄影学中的互易律指出,快门开启时间延长一倍,进入传感器的光线量便翻倍。然而,由于数字相机的传感器与机载图像处理管线存在非线性特征,物理光照强度的翻倍并不会直接使图像文件中的像素数值翻倍。例如,同一屋顶像素在曝光时间成倍增加时,像素亮度可能仅从 31 变为 78,而非成比例的 62。因此,无法仅通过简单的数值乘法完成不同曝光图像的无缝拼接,必须先反向推导相机的内部响应曲线。 基于超定方程组的响应曲线数学建模 (3:08) 为反推相机响应曲线,Chen 借鉴了 1990 年代加州大学伯克利分校 Debevec 与 Malik 提出的辐射度图恢复理论。该方法将数字像素值 $Z$ 表示为未知函数 $f$ 对实际曝光量(场景辐射度乘以快门时间 $\Delta t$)的作用结果。通过对未知函数求逆,并定义 $g = f^{-1}$,可以为每一个样本像素 $i$ 在曝光 $j$ 下列出方程:$g(Z_{ij}) = \ln(\text{radiance}_i) + \ln(\Delta t_j)$。在多个曝光图像中采集不同位置的代表性像素点后,该模板公式构成了一个超定线性方程组 $Ax = b$。由于设计矩阵 $A$ 并非方阵,无法直接使用标准逆矩阵求解,Chen 引入了摩尔-彭罗斯伪逆(Moore–Penrose pseudoinverse),通过 $(A^T A)^{-1} A^T$ 的代数分解形式在仅支持方阵求逆函数 MINVERSE 的 Excel 中成功实现矩阵求逆,进而解出代表离散响应函数 $g$ 的向量。 在 Excel 中搭建图像显示与矩阵运算引擎 (7:06) 在实际工程实现层面,Chen 将 8 张包围曝光照片的原始像素强度数值分别填入 8 个工作表。为了将数字网格转化为可视化的光栅显示器,他利用 Excel 的条件格式功能为单元格赋予从暗到亮的渐变颜色,并将单元格压缩为微小的正方形,通过缩小显示比例呈现图像。该操作使 8 张包含完整条件格式的表格瞬间消耗了高达 13 GB 的内存。为了控制计算规模,Chen 提取了部分代表性坐标样本建立提取表,并在专门的矩阵表中排列构建庞大的 $A$ 矩阵,同时用条件格式将非零单元格标红以检验稀疏矩阵结构。针对整个逻辑流程的标注,Chen 则选择插入早期样式的 WordArt 进行文档化记录。 复杂公式计算与最终辐射度图色调映射 (9:59) 在通过伪逆公式提取出离散的 $g$ 响应函数后,Chen 需要为每个像素计算加权平均辐射度以生成最终结果。由于该计算需要对 8 张曝光切片中的各单元格像素值套用 $g$ 函数、按曝光时间归一化并执行加权计算,其嵌套复杂度超出了 Excel 公式栏的原生编辑体验,Chen 转而在外部文本编辑器 Sublime Text 中编写完成该庞大公式并贴回主表。公式贴入后,系统经历约 30 秒的计算卡顿,成功输出了完整的合成图像。原本在常规曝光中呈现纯白过曝的教堂窗户被清晰还原,暴露出包括十字架上的耶稣等精致的彩色花窗玻璃细节,证明了该算法在电子表格系统中的可行性。 该项目以幽默的极客视角验证了 Microsoft Excel 在常规办公场景之外作为数值计算与图像渲染平台的技术潜力;尽管其最终成功复原了高动态范围图像,但极高的内存开销与公式计算停顿也体现出电子表格在处理大规模光栅数据时的性能局限与工程妥协。

Detailed notes — zh

## Background 该视频由 Confreaks 频道于 2017 年 5 月 18 日发布在 YouTube 上,记录了 Kevin Chen 在 !!Con 2017 大会上的技术演讲。简介介绍了他如何将高动态范围(HDR)摄影算法拆解为线性方程组,并在“商务人士最钟爱的工具”Microsoft Excel 中完全依靠电子表格实现图像合成。 ## TL;DR 演讲首先剖析了相机传感器记录光线的非线性难题,指出单纯翻倍快门时间无法直接线性合并不同曝光的照片。随后,Kevin 借助基础线性代数将求解相机反响应曲线转化为超定方程组,并利用 Excel 支持的矩阵转置和逆矩阵函数推导求解伪逆矩阵。最后,他将 8 张不同曝光的照片导入表格,通过条件格式渲染图像、编写 WordArt 注释,最终成功在 Excel 单元格中合成出细节完好的 HDR 彩色玻璃窗画面。 ## Atmosphere & style 整场演讲充满极客式的冷幽默与荒诞趣味,主讲人一本正经地将专业图像学难题与严肃企业办公软件生硬绑定,笑果十足。台下观众反应热烈,每当出现内存飙升到 13GB 重启电脑、用小学五年级 WordArt 写注释等离谱操作时都爆发出会心笑声。现场节奏轻快且思路清晰,在硬核数学推导与戏谑调侃的交替推进中,带给观众一种既震撼又捧腹的技术狂欢感。 ## Bulletin - [00:00](https://www.youtube.com/watch?v=bkQJdaGGVM8&t=0s) Kevin Chen 在 !!Con 2017 上演示了仅使用 Microsoft Excel 原生功能实现高动态范围(HDR)图像合成算法的全过程。 - [03:08](https://www.youtube.com/watch?v=bkQJdaGGVM8&t=188s) HDR 合成的核心在于利用快门互易律与多曝光采样,通过求解超定线性方程组反演相机的非线性响应函数 g。 - [04:38](https://www.youtube.com/watch?v=bkQJdaGGVM8&t=278s) 由于 Excel 仅内置方阵求逆函数 MINVERSE,演讲者通过转置与乘法公式 A⁺ = (Aᵀ A)⁻¹ Aᵀ 在表格中成功实现了摩尔-斯彭罗斯伪逆矩阵计算。 - [09:22](https://www.youtube.com/watch?v=bkQJdaGGVM8&t=562s) 最终工作簿通过条件格式着色完成图像与矩阵可视化,并在耗时 30 秒的公式加权计算后,成功还原出过曝窗户中彩绘玻璃的精细图像。 ## Key takeaways - [00:00](https://www.youtube.com/watch?v=bkQJdaGGVM8&t=0s) 针对拍摄中常见的过曝与欠曝问题,摄影标准方案是通过多张不同曝光照片合成 HDR,而 Kevin Chen 幽默地选择在商务软件 Microsoft Excel 中落地该算法。 - [00:57](https://www.youtube.com/watch?v=bkQJdaGGVM8&t=57s) 快门控制进光量遵循物理上的互易律(开门时间翻倍则进光量翻倍),但数字图像传感器与文件存储之间存在非线性关系,不能简单通过乘法提亮像素。 - [03:08](https://www.youtube.com/watch?v=bkQJdaGGVM8&t=188s) 为了将数字像素值还原为真实物理辐射照度,必须求解相机内部未知的反向响应函数 g = f⁻¹。 - [03:08](https://www.youtube.com/watch?v=bkQJdaGGVM8&t=188s) 通过对多张不同曝光照片中相同像素位置的亮度值变化进行追踪与采样,可以将成像物理过程转化为离散的数学反演问题。 - [04:38](https://www.youtube.com/watch?v=bkQJdaGGVM8&t=278s) 全图采样像素组合后构成巨大的超定线性方程组 Ax = b,需要借助线性代数的矩阵求逆来求解未知向量。 - [04:38](https://www.youtube.com/watch?v=bkQJdaGGVM8&t=278s) 针对非方阵矩阵 A,Excel 缺乏直接的伪逆函数,演讲者利用基础矩阵函数组合公式 A⁺ = (Aᵀ A)⁻¹ Aᵀ 巧妙绕过了原生功能限制。 - [07:06](https://www.youtube.com/watch?v=bkQJdaGGVM8&t=426s) 将 8 张曝光图像数据导入表格后,利用正方形单元格、视窗远景缩放以及条件格式颜色渐变,将 Excel 单元格直接变成了像素渲染画布。 - [07:06](https://www.youtube.com/watch?v=bkQJdaGGVM8&t=426s) 多图高密度条件格式渲染曾导致工作簿内存飙升至 13GB,逼迫演讲者通过重启电脑与精简采样坐标来平衡性能负荷。 - [09:22](https://www.youtube.com/watch?v=bkQJdaGGVM8&t=562s) 演讲者利用经典 WordArt 艺术字为庞大的表格充当“代码注释”,并利用条件格式标红直观展示了矩阵 A 的稀疏几何结构。 - [09:22](https://www.youtube.com/watch?v=bkQJdaGGVM8&t=562s) 计算真实光强加权平均的公式过长,需在 Sublime Text 中编辑后贴回 Excel,执行耗时约 30 秒即完成了最终图像合成。 - [11:10](https://www.youtube.com/watch?v=bkQJdaGGVM8&t=670s) 合成结果成功恢复了原本死白过曝的彩色玻璃窗细节,印证了复杂图形学算法本质可简化为基础线性方程组的计算原理。 - [11:10](https://www.youtube.com/watch?v=bkQJdaGGVM8&t=670s) 演讲以调侃“商务人士现在可以卸载 Photoshop 并为自己点亮 LinkedIn 的 Microsoft Office 技能”幽默收尾。 ## Detailed walkthrough ### [00:00](https://www.youtube.com/watch?v=bkQJdaGGVM8&t=0s) HDR 摄影问题与最不可思议的解决方案 如果你拍过照片,往往会遇到某些区域过曝发白、完全看不清细节的困扰。摄影师们给出的标准解决方案非常直接:多拍几张不同曝光的照片,然后利用计算机上的高动态范围(HDR)算法将它们合成在一起。但对于商务人士而言,任何解决方案的最佳落地平台永远只有一个。Kevin Chen 幽默地指出:“And, as any businessperson will tell you, the right platform to implement your solutions is always Microsoft Excel.” 经过深思熟虑后,他得出的结论是在 Microsoft Excel 中实现 HDR 图像合成。 ```mermaid flowchart LR accTitle: HDR in Excel Overview accDescr: A visual representation of combining multiple exposures into an HDR image within Microsoft Excel. A["不同曝光的照片<br>(暗部保留 / 亮部保留)"] --> B["找回相机响应曲线<br>(求解反函数 G)"] B --> C["线性代数矩阵运算<br>(伪逆矩阵求解)"] C --> D["在 Excel 中渲染合成结果<br>(条件格式绘图)"] ``` ### [00:57](https://www.youtube.com/watch?v=bkQJdaGGVM8&t=57s) 相机快门、互易律与非线性难题 假设我们有两张不同曝光的照片,一张较亮,一张较暗。简单的想法是将较亮照片中过曝发白的部分扣掉,把较暗照片中保留了细节的相同区域复制粘贴过来。但因为右侧照片整体更亮,要使两张图拼合自然,必须先把粘贴过来的像素提亮,这就引出了一个核心难题:究竟该提亮多少? 相机的快门通过开合控制进光量,快门开启的时间越长,进入的光线就越多,这一物理规律被称为“互易律”(reciprocity)。如果快门开启时间延长一倍,进入相机的光线总量也会翻倍。然而,我们不能单纯把暗图中的像素数值乘以 2,因为相机传感器到最终数字文件之间存在“非线性”(nonlinearity)关系: - 横坐标(进光量)按固定步长增加时,JPEG 文件中记录的数值增幅却完全不同。 - 两倍的进光量并不等于图像文件中记录的数值翻倍。 - 只有找到相机内部特定的响应函数,才能将数字图像中的像素值准确还原为真实的物理进光量。 正如 Kevin 所调侃的,早在 1990 年代,加利福尼亚大学伯克利分校的一群聪明学者就已经解决了这个问题,但原论文中充斥着复杂的数学公式和方程,容易让商务人士感到枯燥无聊。 ### [03:08](https://www.youtube.com/watch?v=bkQJdaGGVM8&t=188s) 追踪单像素:从对应关系中恢复 G 函数 为了通俗地解释这个算法,Kevin 避开繁复的整张图像,仅截取三张不同曝光照片中屋顶的同一个像素位置进行观察。假定第一张较暗照片中的像素亮度值为 31;已知第二张照片进光量是第一张的两倍,但由于非线性,得到的数值并不是 62,而是略微不同的数值(例如 78);同理,第三张照片再次将进光量翻倍,像素值同样不会线性翻倍。 将这些数据点重新绘制在图表上,就能清晰地看出:当文件显示为 31 与另一文件显示为 78 时,两者对应的物理光照差异正好是两倍。如果对整张图像的每个像素位置都收集类似的数据并填补间隙,就能完整还原出相机未知的反响应函数 $g$。 ```mermaid flowchart TD accTitle: Camera Response Function Derivation accDescr: The process of taking raw exposure inputs and inverting the camera function to recover radiance. subgraph Forward["物理成像过程"] P1["辐射照度 (E) × 曝光时间 (t)"] -->|"未知函数 f"| P2["数字像素值 (Z)"] end subgraph Inverse["数学反演求解"] P2 -->|"反函数 g = f⁻¹"| P3["真实物理光照对数值"] P3 -->|"组合全图点位"| P4["超定线性方程组 (A·x = b)"] end ``` ### [04:38](https://www.youtube.com/watch?v=bkQJdaGGVM8&t=278s) 建立线性方程组与伪逆矩阵技巧 在数学表述上,设未知函数 $f$ 接收曝光量(即亮度乘以快门时间)并输出存储在数字文件中的像素值 $Z$。但实际处理时,手中已有的正是数字像素值 $Z$,因此需要求其反函数 $g = f^{-1}$: - 针对每张图像里的每一个像素值 $Z$,都可以套用该公式写出一个方程。 - 所有图像中的全部采样像素组合在一起,形成了一个庞大的线性方程组。 - 求解该方程组,即可得出离散的反响应函数 $g$。 在求解这个方程组时,需要借助线性代数将其组织成巨大的矩阵方程 $Ax = b$。解出未知向量需要对矩阵 $A$ 求逆。然而,由于该方程组属于超定方程组,矩阵 $A$ 并非方阵,只能计算摩尔-斯彭罗斯广义逆(Moore–Penrose pseudoinverse,即用加号标记的“伪逆”)。Kevin 发现:“as it turns out Excel only has real inverses”,而原生 Excel 仅支持方阵的标准矩阵求逆函数(`MINVERSE`)。经过一番搜索,他在一个名为 Math Ass 的网站上查到了如何用 Excel 原生支持的基础矩阵转置与乘法运算组合出伪逆矩阵的公式:$A^+ = (A^T A)^{-1} A^T$。 ### [07:06](https://www.youtube.com/watch?v=bkQJdaGGVM8&t=426s) 在 Excel 中搭建图像编辑器与 WordArt 注释 在进入实际操作时,Kevin 将 8 张不同曝光的黑白图像数据导入电子表格中。起初单元格中只是一堆难以辨认的密密麻麻的数字,但借助商务办公常用的“条件格式”(Conditional Formatting),设定最低值对应一种颜色、最高值对应另一种颜色,并在中间生成渐变填充,再将所有单元格调整为正方形并将视图缩放拉远,整张图像便直接在表格中显现出来。 由于连续对全部 8 张图片进行这种格式渲染,工作簿的内存占用迅速飙升到了 13GB。Kevin 戏称:“so like any obedient Microsoft customer I rebooted my computer in order to continue working.” 重启电脑后,他继续录入各张照片对应的快门时间,并从全图中挑选若干具有代表性的采样坐标以降低计算负荷。为了给日益复杂的表格写“代码注释”,他选择使用经典的 WordArt(艺术字);由于当前版本的预设样式过于单调,他还特意翻出了小学五年级时保存的珍贵艺术字样式库,复制粘贴出彩虹与 3D 样式的醒目标题。 ### [09:22](https://www.youtube.com/watch?v=bkQJdaGGVM8&t=562s) 求解矩阵并生成最终 HDR 图像 后续工作表用于提取选定坐标上的像素值并重构数据布局:每张图片对应一列,随后构筑起巨大的矩阵 $A$。在 10% 的极小缩放级别下,单元格中的数值已无法肉眼辨别,Kevin 通过条件格式将非零单元格标红,从而直观展现矩阵 $A$ 的稀疏结构与几何轮廓。 利用前面推导的矩阵伪逆公式求解后,终于成功提取出反响应曲线 $g$。紧接着,需要将各曝光图像映射回真实亮度并进行加权平均以生成最终画面。由于计算公式过长,Kevin 不得不在 Sublime Text 中编辑该长公式再粘贴回 Excel: - 该公式核心逻辑是调用求出的 $g$ 函数查询各个像素对应的真实光强,随后进行加权平均。 - 粘贴回电子表格后,计算耗时大约 30 秒。 - 最终结果对比十分显著:原图中由于窗外光线过强导致一片死白的区域,在 Excel 运算合成出的 HDR 图像中清晰呈现出了精美的彩色玻璃窗(stained glass artwork)细节。 ### [11:10](https://www.youtube.com/watch?v=bkQJdaGGVM8&t=670s) 在 Excel 中完美合成 HDR 图像与幽默收尾 在展示最终渲染结果时,Kevin Chen 指出原本过曝或欠曝的窗户细节如今清晰可辨,甚至能够辨认出彩色玻璃窗上的图案:“tell there's like a picture of Jesus on the cross and like some other stuff in the other windows and so this means we're successful and our business people are so happy now because they can uninstall Photoshop and only use Microsoft Excel.”(可以看出有一扇窗户上是耶稣受难的画像,其他窗户里也显现出了别的内容;这意味着我们成功了,我们的商务人士现在超级开心,因为他们终于可以把 Photoshop 卸载掉,只用 Microsoft Excel 就够了。)整个过程证明了哪怕是像高动态范围(HDR)图像重建这种复杂的算法,本质上也只是一组线性方程组,完全能够在电子表格中实现。 在演讲尾声,Kevin Chen 不忘以一种极具个人特色的幽默方式与现场观众互动。他向大家呼吁,如果喜欢这个项目,欢迎访问他的个人网站并点击跳转到 LinkedIn,而且千万别忘了顺手给他在技能栏里点一个“Microsoft Office”的技能背书(endorse)。在全场会心的大笑与热烈掌声中,这场展示 Excel 极限玩法与硬核图形学算法的技术分享圆满落幕。 - **最终合成细节**:窗户暗部与亮部细节得到全面恢复,甚至能清晰看清彩绘玻璃上的耶稣十字架图案。 - **商务人士的“终极利器”**:调侃 Excel 已经强大到足以替代专业图像处理软件 Photoshop。 - **终极求赞**:希望观众在 LinkedIn 上为他的“Microsoft Office”专业技能进行认证背书。 ## Mentioned Kevin Chen, Microsoft Excel, Photoshop, Sublime Text, WordArt, 加利福尼亚大学伯克利分校, LinkedIn, Math Ass ## Video description HDR Photography in Microsoft Excel?! by Kevin Chen Have you ever taken a photo with areas that are too bright or too dark? As any photographer will tell you, high dynamic range photography is the right way to solve your problem. And, as any businessperson will tell you, Microsoft Excel is the right platform to implement your solution. In this talk, I’ll explain the algorithm from one of the foundational papers about HDR imaging — no prior image processing knowledge required. Turns out, it’s just a system of linear equations! So, obviously, the next step is to implement HDR in a spreadsheet. Because we can. The end result reveals how this complicated-sounding algorithm boils down to a few simple ideas. Kevin is an amateur photographer and Microsoft Office enthusiast. He also studies computer science at Columbia University. [Source](https://www.youtube.com/watch?v=bkQJdaGGVM8)

Source quotes

[1:46] Kevin Chen: two times more light doesn't mean you're going to get a twice as big number inside your file.

Original transcript

[0:00] [Music] [0:08] [Music] [0:12] if you've taken photos before um you [0:14] might realize that there are some areas [0:16] that are too bright and you can't really [0:18] see what's going on in there um and so [0:20] photographers will tell you that there's [0:22] a solution for this you just take more [0:24] photos and then you combine them [0:26] together on the computer using a high [0:28] dynamic range algorithm [0:31] and as any business person will tell you [0:33] the right platform to implement your [0:34] Solutions is always Microsoft [0:41] Excel so I thought long and hard about [0:43] this and the conclusion I came to was [0:45] that we need to do HDR in Microsoft [0:49] Excel so I'll just skip straight to the [0:55] [Applause] [0:57] background so let's let's try to think [0:59] about like what we might need for an HDR [1:01] algorithm so let's say we have these two [1:03] pictures here and one's brighter than [1:05] the other so we'll just take these areas [1:07] that are kind of blown out and copy and [1:10] paste them from the darker picture where [1:12] they're a little more detailed to The [1:14] Brighter picture and we also need to [1:16] brighten them up a little bit because [1:18] the picture on the right is brighter and [1:19] we want everything to match up now the [1:22] problem here is that we don't know how [1:24] much we should brighten up this image so [1:26] let's learn about cameras for 30 seconds [1:29] um this is a shut shutter and it opens [1:31] and closes to let in light now the [1:33] longer this shutter is open the more [1:35] light is going to come in and this [1:38] principle is called reciprocity so if we [1:41] open the shutter for twice as long we're [1:43] going to let in twice the amount of [1:44] light into our [1:46] camera okay so I'm just going to go [1:48] through take all these numbers in my [1:50] image and multiply them by two times and [1:53] we're good right um but it's not that [1:55] simple because there's this thing called [1:58] nonlinearity so I have this chart here [2:01] and what it shows is basically um how [2:04] the camera responds to different amounts [2:07] of light coming in so uh you can see [2:10] here that if we increase the amount of [2:12] light on the bottom axis by the same [2:14] step each time we're going to get a [2:16] different number in our JPEG file when [2:18] we take a picture um so two times more [2:21] light doesn't mean you're going to get a [2:23] twice as big number inside your [2:26] file um so if only we had some way of [2:29] knowing what this function in our camera [2:31] is um we would be able to fix our images [2:34] so that this statement down here is [2:36] actually true and fortunately we don't [2:39] have to figure this out for ourselves [2:40] because some smart kids in the 90s um at [2:43] Berkeley already did um but the way they [2:45] solved this was with a lot of math and a [2:47] lot of equations and this is making our [2:49] business people kind of bored [2:52] um but I it's okay cuz I I told them at [2:55] the beginning that I'm going to explain [2:57] this using emoji and pictures and uh now [3:02] there now there's a lot of synergy right [3:05] now [3:08] so let's let's get started back to these [3:11] three pictures but I'm not going to look [3:12] at the whole thing I'm only going to [3:14] care about these pixels in the roof so [3:17] I'm looking at the same location in [3:19] three different [3:20] images and I'll tell you that this first [3:23] pixel has a brightness value of [3:25] 31 and because we took these pictures [3:28] you know we know that to get from the [3:29] first picture to the second picture we [3:31] let in twice the amount of light as [3:34] before but we're also not tricked by [3:36] this because we know we're not going to [3:38] get 62 we're going to get something [3:40] slightly different and the same thing [3:43] happens when we go from the second [3:44] picture to the third picture we get [3:46] twice the amount of light but we're not [3:48] going to get a number that's twice a big [3:50] as big so now I'll take these data [3:52] points and I'll rearrange them on a [3:55] graph um and this is the same thing we [3:57] saw earlier so this tells me that when I [4:00] have uh when I open my file and I see 31 [4:03] here and then when I open a different [4:05] file and I see 78 there I know that the [4:07] difference between these two pixels is [4:10] twice the amount of light um that was [4:12] coming into to the camera at that [4:15] time uh and so this is just the [4:17] information we get from looking at a [4:19] single location in the image what if we [4:21] could look at every pixel in the image [4:23] and collect a bunch of data that's just [4:25] like this and as it turns out when we do [4:28] that we fill in all these gaps in the [4:30] middle and we recover the G function uh [4:33] the function that we were looking for [4:35] earlier okay so now let's write all this [4:38] down using math so of course we know [4:40] there's some function that we don't know [4:42] uh and it takes in the amount of light [4:44] and gives us a number that we can store [4:46] in our digital [4:48] files and we also know that the amount [4:50] of light is just the brightness [4:53] multiplied by how long we let the [4:54] shutter stay [4:56] open so now I'll just give these some [4:58] letters [5:00] and uh you know this function f doesn't [5:02] actually do what we want right it takes [5:04] in light and gives us a digital number [5:06] but in this case we already have our [5:08] digital files with our digital numbers [5:10] so we actually want to go the other way [5:13] so I'll invert this function f then I'll [5:16] just rename it so I'll make another [5:17] function G that is just F inverse and [5:20] this function G is the one that we want [5:22] to [5:23] recover uh now this actually this [5:26] equation down here I've written it as [5:27] one equation but it's actually [5:30] a template that can be used to create [5:32] many equations right so for each pixel [5:34] value in our images for each Z value [5:37] we're just going to write this equation [5:38] out another time and we're going to end [5:40] up with one equation for every pixel in [5:43] every image and so this system of [5:45] equations when you solve it it gives you [5:48] the G function that we've been looking [5:50] for so okay um now let's solve it and [5:53] the way you do this is you use linear [5:55] algebra so you put everything into a [5:57] very big Matrix and then when you solve [5:58] this equation um you get your answers [6:01] out now I didn't really understand how [6:03] to set up this problem uh so I Googled [6:05] around and uh basically this is what I [6:08] found this is how you slice and dice [6:09] your pictures to form those uh matrices [6:13] and so I was like all right sounds [6:17] good so that's how we set it up and now [6:20] we have to solve it and to do that we [6:22] need to invert this Matrix a here that's [6:25] the key part of solving the system of [6:27] equations and there's two types of [6:30] inverse there's like a real inverse and [6:32] then there's like a fake inverse and [6:36] this plus sign means the fake inverse um [6:39] but as it turns out Excel only has real [6:43] inverses uh and so I Googled around some [6:45] more and I found this website that told [6:47] me how to rewrite this um fake inverse [6:50] in terms of only things that we have [6:52] available in Excel and you know that [6:54] this equation is legit because it comes [6:56] from a website called math ass [7:04] so that's what we're going to go with [7:06] now it's Microsoft Excel time so I put [7:09] all my data into this spreadsheet I made [7:11] the images black and white um but you [7:13] can't really tell what's going on here [7:15] um it's just a bunch of numbers um but [7:17] don't worry because the business people [7:18] have us covered they have this thing [7:20] called conditional formatting where you [7:22] give it uh one color for the bottom [7:26] range another color for the top range [7:28] and it fills in everything in [7:30] between so now all we have to do is make [7:33] our cells square and then once we set [7:36] the zoom level [7:50] here so that's the first step to Turning [7:52] Excel into an image [7:55] editor so I did this eight seven more [7:57] times for all of my images [8:00] and after that Excel started [8:03] using 13 gigs of RAM so like any [8:06] obedient Microsoft customer I rebooted [8:08] my computer in order to continue [8:13] working and so the next thing I did was [8:15] I just started entering more things like [8:18] this is all the shutter times for all my [8:20] eight pictures and um you know we don't [8:23] want to use the entire image in our [8:24] calculations because it's pretty big so [8:26] I'm just going to pick a few coordinates [8:29] to take out and use those values in my [8:31] calculations and it's starting to get [8:33] very complicated and you can't really [8:35] tell what's going on so we need to leave [8:37] comments in the program that we're [8:39] writing in Excel and the way to do that [8:41] is you use word [8:44] art uh but if you zoom in here there's a [8:46] little bit of problem these are all [8:48] really boring Styles um you know I want [8:51] like the rainbow one and like the 3D one [8:54] um but fortunately fifth grade me had [8:56] the foresight to save one of each type [8:59] of work word art into this [9:05] file so now all I have to do is copy and [9:08] paste and so now you know exactly what [9:11] this sheet is trying to [9:16] calculate and so this is the first step [9:19] on the road to success for this [9:22] project uh now this is another sheet [9:26] that uses the sheet I made before um so [9:29] before we were picking which coordinates [9:30] we're interested in in the image and [9:32] this is actually pulling out the values [9:35] at those locations um and so I have one [9:37] column for each image and this is just [9:39] reformatting it for my next sheet um [9:42] which is also zoomed out at 10% and it's [9:45] so small that we don't actually look at [9:46] the numbers um we just look at whether [9:49] there is a number there or whether it's [9:50] zero so if there is a number um I [9:53] basically make it red um so you can kind [9:55] of see the shape of this a matrix [9:59] then I solve it and this is the G [10:01] function that we've been looking for [10:02] this whole time um and this equation up [10:05] here this formula up here looks kind of [10:07] um long and confusing but it's just the [10:10] way that you write this thing that we [10:11] saw before in Excel um so just [10:16] uh so I've pulled out this G function [10:19] here um and as we remember this is going [10:21] to take our digital number and give us a [10:23] brightness value but we're not quite [10:25] there yet we still need to Output our [10:28] final image so that we can can get into [10:29] National Geographic cuz this isn't going [10:32] to make [10:33] it uh and this got so long that I had to [10:36] edit this formula in Sublime but it's [10:38] actually pretty simple this basically [10:40] just um calls into this G function to [10:42] get the light intensity and then the [10:44] rest of it is just doing some fancy [10:46] averaging um so I pasted this into um [10:53] my [10:55] spreadsheet and uh it actually took [10:58] about 30 seconds to calculate but I cut [11:00] that part out um and so this is our [11:02] final result so you can see here that [11:05] the windows on the right you can [11:07] actually see the stained glass artwork [11:08] where you can't on the left so you can [11:10] tell there's like a picture of Jesus on [11:12] the cross and like some other stuff in [11:13] the other windows and so this means [11:15] we're successful and our business people [11:17] are so happy now because they can [11:19] uninstall [11:20] Photoshop and only use Microsoft [11:23] Excel so that's all I have if you like [11:26] this please go to my website click on [11:28] LinkedIn and don't forget to endorse me [11:29] from Microsoft Office [11:34] [Applause]