Nuclear Plants Outearn Gas at Year 18 as Fuel Costs Offset Debt
Illinois EnergyProf
Utilities favor natural gas for its two-year construction window, but cheap uranium allows capital-heavy nuclear reactors to surpass gas in cumulative profit by year 18 and generate quadruple the annual cash flow once debt expires.
AI-assisted summary of Economics of Nuclear Reactor — original source. Check the original for full context.
Source published:
Key ideas
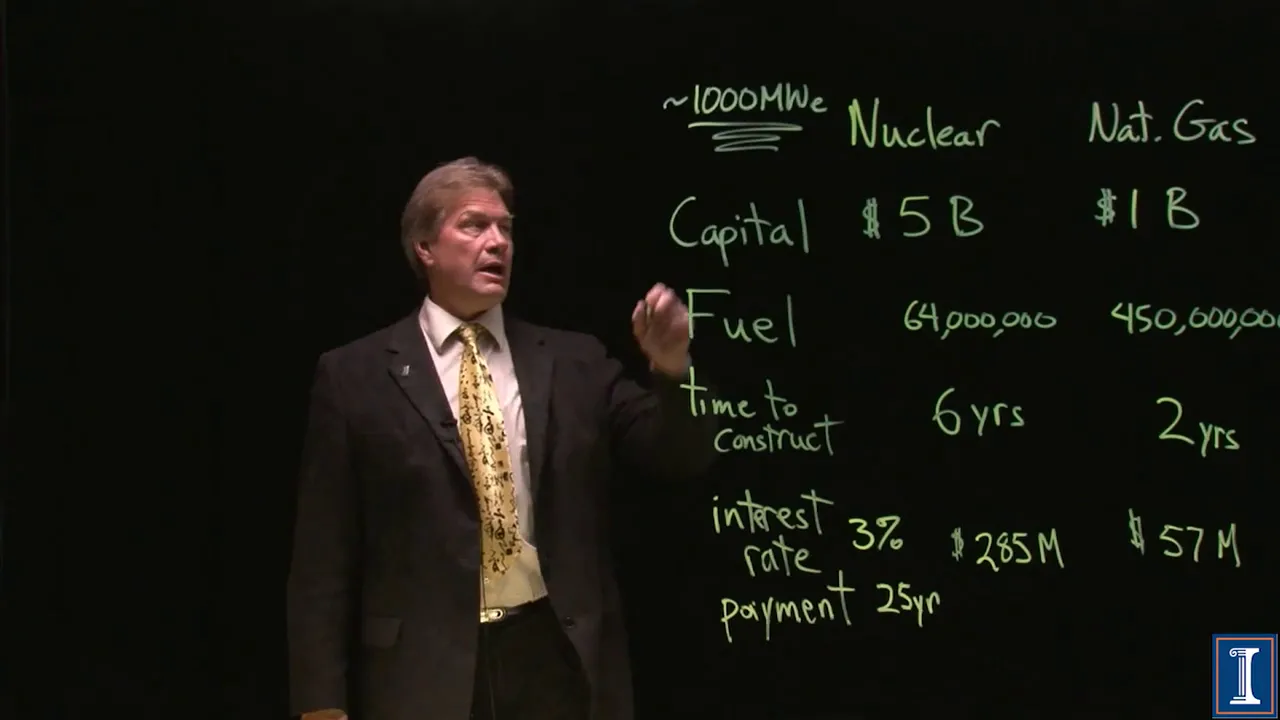
- For an equivalent 1,000 MWe baseload plant, nuclear costs roughly $5 billion up front with just $64 million in annual fuel costs, whereas natural gas requires only $1 billion to construct but burns through $450 million in annual fuel. (0:03)
- A standard combined-cycle natural gas plant breaks even in Year 4, whereas a nuclear plant requires six years of construction debt, reaching the black only in Year 13. (9:06)
- The cumulative financial returns of nuclear surpass natural gas at Year 18, generating an astounding net cash flow jump from +3 to +8 operational units annually once the 25-year mortgage is retired. (15:23)
- To bypass the deep multi-year borrowing deficits that make traditional gigawatt-scale reactors financially risky for utilities, the nuclear industry is increasingly prioritizing Small Modular Reactors (SMRs). (21:04)
Detailed notes
## Background Published on YouTube by the educational channel Illinois EnergyProf on May 14, 2019, this video examines the economics of constructing, fueling, and operating a nuclear power plant compared to a natural gas facility. The presentation visually walks through capital expenditures, fuel costs, construction timelines, interest rates, and multi-decade payoff milestones, while also evaluating broader fuel production costs across the power sector.
## TL;DR Evaluating nuclear against natural gas reveals fundamentally inverted cost structures: nuclear requires enormous upfront capital (~$5 billion over six years) but negligible annual fuel costs (~$64 million), while a natural gas plant is cheap to build (~$1 billion in two years) but consumes hundreds of millions in fuel annually. Tracking cash flow year by year demonstrates that while natural gas turns a profit by Year 4, nuclear sinks into deep carrying debt before entering the black in Year 13 and surpassing natural gas in cumulative lifetime earnings at Year 18. Once 25-year mortgages are retired, nuclear transforms into a massive long-term cash generator over its 40-plus-year operating life. However, because political and corporate planning horizons heavily favor the rapid turnaround and lower initial risk of gas, the industry is increasingly looking toward Small Modular Reactors to capture nuclear's low fuel costs without the crushing upfront financial exposure.
## Atmosphere & style The presentation carries the deliberate, engaging tone of a masterclass lecture, using accessible block-by-block accounting ledgers to demystify complex corporate financing. Illinois EnergyProf speaks with measured, calm authority, pacing the financial timeline with a quiet sense of mounting anticipation as the nuclear ledger slowly claws its way out of the red. Watching the breakdown feels grounded and pragmatic, capturing the stark tension between short-sighted political decision-making and patient, decades-long engineering investments.
## Bulletin - [00:03](https://www.youtube.com/watch?v=cbeJIwF1pVY&t=3s) For an equivalent 1,000 MWe baseload plant, nuclear costs roughly $5 billion up front with just $64 million in annual fuel costs, whereas natural gas requires only $1 billion to construct but burns through $450 million in annual fuel. - [09:06](https://www.youtube.com/watch?v=cbeJIwF1pVY&t=546s) A standard combined-cycle natural gas plant breaks even in Year 4, whereas a nuclear plant requires six years of construction debt, reaching the black only in Year 13. - [15:23](https://www.youtube.com/watch?v=cbeJIwF1pVY&t=923s) The cumulative financial returns of nuclear surpass natural gas at Year 18, generating an astounding net cash flow jump from +3 to +8 operational units annually once the 25-year mortgage is retired. - [21:04](https://www.youtube.com/watch?v=cbeJIwF1pVY&t=1264s) To bypass the deep multi-year borrowing deficits that make traditional gigawatt-scale reactors financially risky for utilities, the nuclear industry is increasingly prioritizing Small Modular Reactors (SMRs).
## Key takeaways - [00:03](https://www.youtube.com/watch?v=cbeJIwF1pVY&t=3s) Nuclear and natural gas power plants possess fundamentally inverted cost structures regarding upfront capital vs. operational fuel expenses. - [00:03](https://www.youtube.com/watch?v=cbeJIwF1pVY&t=3s) A 1,000 MWe nuclear plant requires roughly $5 billion in overnight capital costs, compared to only $1 billion for an equivalent natural gas plant. - [00:03](https://www.youtube.com/watch?v=cbeJIwF1pVY&t=3s) Fuel expenses heavily favor nuclear due to uranium's immense energy density, costing roughly $64 million annually versus $450 million per year for natural gas. - [04:08](https://www.youtube.com/watch?v=cbeJIwF1pVY&t=248s) Regulated utilities cannot bill ratepayers until a facility begins commercial power generation, making construction duration and interest rates crucial economic drivers. - [04:08](https://www.youtube.com/watch?v=cbeJIwF1pVY&t=248s) Under a 3% 25-year mortgage, annual debt servicing diverges sharply: $57 million per year for natural gas versus $285 million per year for nuclear. - [04:08](https://www.youtube.com/watch?v=cbeJIwF1pVY&t=248s) While operating with debt service, natural gas generates approximately 1 unit (~$60 million) of annual net profit, while nuclear yields roughly 3 units (~$180 million). - [09:06](https://www.youtube.com/watch?v=cbeJIwF1pVY&t=546s) The natural gas plant achieves cumulative financial break-even by Year 4, having taken just two years to construct. - [09:06](https://www.youtube.com/watch?v=cbeJIwF1pVY&t=546s) Nuclear construction requires six years of accumulating debt before entering commercial operation in Year 7, finally erasing its capital deficit in Year 13. - [15:23](https://www.youtube.com/watch?v=cbeJIwF1pVY&t=923s) At Year 18, cumulative net earnings from the nuclear plant officially cross over and surpass those of the natural gas plant. - [17:01](https://www.youtube.com/watch?v=cbeJIwF1pVY&t=1021s) Retiring the 25-year mortgage leaves nuclear at +36 cumulative units versus +21 for gas, and nuclear's ongoing annual cash flow jumps from +3 to +8 units once debt service vanishes. - [19:15](https://www.youtube.com/watch?v=cbeJIwF1pVY&t=1155s) Despite nuclear plants having operational lifespans of 40+ years, political and corporate decision-makers favor natural gas due to short-term planning horizons and lower upfront risk. - [21:04](https://www.youtube.com/watch?v=cbeJIwF1pVY&t=1264s) On a levelized cost of electricity (LCOE) basis, nuclear and coal have historically provided stable baseload power, domestic gas has achieved price parity, and petroleum oil remains unviable. - [21:04](https://www.youtube.com/watch?v=cbeJIwF1pVY&t=1264s) Small Modular Reactors (SMRs) are being developed to avoid the massive upfront capital deficits of conventional reactors while retaining nuclear's low-cost fuel advantage.
## Detailed walkthrough ### [00:03](https://www.youtube.com/watch?v=cbeJIwF1pVY&t=3s) Capital vs. Fuel: The Dilemma of Nuclear and Natural Gas
Economics is the underlying engine driving energy decisions. While individuals occasionally make choices that run counter to their wallets, utility companies deciding what kind of electrical generation to build will always place economics near the top of the list: “generally if something is cheaper people buy it.” Evaluating how expensive nuclear power actually is turns out to be a deceptively difficult question because its cost structure is completely inverted when compared to its primary modern competitor, natural gas.
To create a fair comparison, the analysis models two large baseload facilities of identical capacity: approximately 1,000 megawatts electric ($1{,}000\text{ MWe}$). When looking strictly at overnight capital cost—the upfront expense required to build the plant—nuclear appears wildly uncompetitive. Advanced Generation III/III+ reactors like the first-of-a-kind units carry price tags that escalate rapidly, with a baseline estimate sitting around $5 billion. By comparison, an equivalent $1{,}000\text{ MWe}$ natural gas plant requires roughly $1 billion. Although a billion dollars is still a massive sum with nine zeros requiring heavy machinery, boilers, and turbine generators, its capital expenditure is only one-fifth that of the nuclear alternative.
When fuel expenses are factored in, however, the financial equation flips entirely. Uranium has an astonishingly high energy density; even though it must be enriched to roughly 3% uranium-235 and costs far more pound-for-pound than fossil fuels, very little is required. Just one ton of U-235 can fuel a plant for three years, resulting in an annual nuclear fuel expenditure of approximately $64 million—about one-hundredth of the plant’s capital cost. Natural gas, by contrast, burns through roughly $450 million worth of fuel every single year at wholesale prices, meaning the fuel expense every two years nearly equals the cost of constructing the entire power station.
| Parameter (1,000 MWe Plant) | Nuclear Power Plant | Natural Gas Power Plant | |:--- |:--- |:--- | | **Capital Construction Cost** | ~$5,000,000,000 ($5 billion) | ~$1,000,000,000 ($1 billion) | | **Annual Fuel Expense** | ~$64,000,000/year | ~$450,000,000/year | | **Annual Fuel Cost vs. Capital Cost** | ~1/100th of plant build cost | ~1/2 of plant build cost | | **Construction Duration** | ~6 years | ~2 years |
---
[04:08](https://www.youtube.com/watch?v=cbeJIwF1pVY&t=248s) The Financing Burden and Construction Timelines
The real economic driver between these two technologies hinges on the time required to build them and the cost of capital. In the United States and many regulated markets, utilities cannot begin recouping costs by billing electricity ratepayers while a facility is still a construction site; the plant must be actively producing power before revenue flows in. As a result, the owner must carry all accumulated debt and interest throughout the entire construction window. A combined-cycle natural gas plant can be erected quickly in roughly two years. Estimating nuclear build times is harder due to limited recent construction in the West, though historical series production by the French brought builds down to four years, and recent Chinese construction of Westinghouse AP1000 passively safe Generation III reactors suggests six years is an achievable modern benchmark.
No utility has five or six billion dollars in liquid cash sitting in a pocket, and even if an entity had that cash, standard financial logic dictates comparing project returns against safe baseline investments like government bonds. Financing is therefore mandatory. Assuming a favorable large-scale utility borrowing environment with a 3% interest rate on a 25-year mortgage covering both principal and interest, the annual debt servicing costs diverge radically: - The natural gas plant requires an annual debt service of $57 million per year. - The nuclear plant requires a staggering annual debt service of $285 million per year.
Once operational, a $1{,}000\text{ MWe}$ facility operating at baseline wholesale prices brings in roughly $525 million per year in gross electrical revenue. To make the long-term cash flow modeling intuitive, the figures can be simplified into operational units where 1 unit equals approximately $60 million.
```mermaid flowchart TD accTitle: Annual Cash Flow Model per 60 Million Dollar Unit accDescr: Comparison of annual revenue, capital debt payments, and fuel expenses for nuclear and natural gas plants.
subgraph Revenue["Gross Revenue (1,000 MWe)"] REV["Electricity Sales: +9 units (~$525M)"] end
subgraph GasCash["Natural Gas Cash Flow (Operational)"] G_DEBT["Debt Service: -1 unit (~$57M)"] G_FUEL["Fuel Cost: -7 units (~$450M)"] G_NET["Net Cash Flow: +1 unit/year (~$60M)"] REV --> G_NET G_DEBT --> G_NET G_FUEL --> G_NET end
subgraph NucCash["Nuclear Cash Flow (Operational)"] N_DEBT["Debt Service: -5 units (~$285M)"] N_FUEL["Fuel Cost: -1 unit (~$64M)"] N_NET["Net Cash Flow: +3 units/year (~$180M)"] REV --> N_NET N_DEBT --> N_NET N_FUEL --> N_NET end ```
- **Gross Revenue**: 9 units per year (~$525 million) - **Gas Plant Annual Costs**: 1 unit debt payment + 7 units fuel = 8 units outgoing (Net: +1 unit/year profit) - **Nuclear Plant Annual Costs**: 5 units debt payment + 1 unit fuel = 6 units outgoing (Net: +3 units/year profit)
---
[09:06](https://www.youtube.com/watch?v=cbeJIwF1pVY&t=546s) The 13-Year Tipping Point: Tracking Cash Flow and Break-Even
To demonstrate how the upfront deficit is worked off over time, a year-by-year ledger tracks both plants on a profit-loss line separating the red (debt) from the black (accumulated profit). Money is drawn down in increments during construction rather than borrowed all at once. In Year 1, both projects borrow their initial capital increment, incurring interest of -1 unit each. By Year 2, the gas plant borrows its remainder and sits at -2 units, while the nuclear project borrows another tranche, pushing its debt to -3 units.
In Year 3, the gas plant is finished and immediately goes into commercial operation. Earning +9 units from power sales while spending -1 unit on debt and -7 units on fuel leaves it with a net gain of +1 unit per year. That positive cash flow cancels one unit of debt, leaving the gas plant at -1 unit. By Year 4, the gas plant adds another +1 unit and reaches a clean break-even point. From Year 5 onward, the gas plant delivers steady accumulated profits (+1 unit in Year 5, +2 in Year 6, +3 in Year 7, and so forth).
Meanwhile, nuclear construction slogs through years of compounding carrying costs without producing a single kilowatt-hour: - **Year 3**: Nuclear borrows a third tranche; interest mounts to -3 units (accumulated debt: -6 units). - **Year 4**: Nuclear borrows a fourth tranche; annual interest is -4 units (accumulated debt: -10 units). - **Year 5 & Year 6**: The full capital is drawn down, accumulating -5 units of debt service each year, driving the project into a deep financial hole of over -20 units while natural gas steadily compiles profits. - **Year 7**: Nuclear finally begins commercial operation. Its superior margin takes over: +9 units of revenue minus -5 units of debt and only -1 unit of fuel yields a powerful net positive cash flow of +3 units per year.
From Year 7 through Year 12, the nuclear plant chips away aggressively at its accumulated deficit, erasing three red units every single year while the gas plant ticks upward by one unit annually. As the instructor highlights upon reaching the end of that stretch: “finally finally on year 13 lookie here... the nuclear power plant has been operating now for six years they finally have turned the corner and are in the black.” At Year 13, the massive initial capital hole is fully erased, setting up the long-term competition over which asset generates superior lifetime returns.
[15:23](https://www.youtube.com/watch?v=cbeJIwF1pVY&t=923s) The Crossover Point: Nuclear Surpasses Gas at Year 18
Continuing the visual financial accounting year by year, the nuclear plant adds three positive units of net margin each year, while the natural gas plant contributes a single positive unit. Year after year—fourteen, fifteen, sixteen, and seventeen—the steady, low fuel costs of the operating nuclear plant gradually chip away at the head start natural gas established during the initial construction years. By year eighteen, the lines finally cross: the cumulative earnings of the nuclear plant officially surpass those of the natural gas plant.
Reaching this crossover validates the immense capital gamble taken nearly two decades earlier. Building the nuclear facility required sinking billions into deep negative territory and enduring six long years of construction without a cent of operational revenue, whereas the gas plant was up and running in just three years with minimal initial capital risk. At year eighteen, the patient investor’s ledger turns dramatically rosier, demonstrating that nuclear power’s ultra-low operating expenses eventually outpace the cheaper-to-build competitor over long time horizons. As Illinois EnergyProf observes at this milestone: “You know what, we've just surpassed eighteen years later the people that said hey they're now making more money and then the people who made the gas plant took a lot more risk there's a lot here in the negative area but now things are looking rosier how far will this go what happens when the plants are paid off.”
- **Year-by-Year Net Annual Additions:** Nuclear adds +3 net units per year of operation; Natural Gas adds +1 net unit per year. - **Breakeven / Crossover Year:** At Year 18, the cumulative net profit of the nuclear project exceeds that of the natural gas project for the first time. - **Risk Comparison:** Natural gas carried far less early financial downside, while nuclear bore substantial early debt and delayed cash flows before overtaking gas in cumulative returns.
[17:01](https://www.youtube.com/watch?v=cbeJIwF1pVY&t=1021s) Paying Off the Mortgage: Year 25 and Post-Debt Cash Flows
Tracking the operational tally from year nineteen through year twenty-five brings both power plants to the end of their initial financing terms. Once year twenty-five concludes, the capital debt—the plant mortgage—is officially paid off. Looking at the cumulative visual grid, the nuclear plant stands at a 6-by-6 block representing a net surplus of +36, whereas the natural gas plant reaches +21. Even with conservative operating assumptions, building nuclear proves to be the more lucrative financial bet over this twenty-five-year stretch.
```mermaid flowchart TD accTitle: Power Plant Cash Flow Transition at Debt Payoff accDescr: Flowchart illustrating how annual cash flows shift for nuclear and gas plants after their 25-year mortgage is eliminated.
subgraph DebtPhase["Years 1 to 25: Debt Service Active"] N1["Nuclear Net Cash Flow: +3/yr<br>(+8 Operational - 5 Debt)"] G1["Gas Net Cash Flow: +1/yr<br>(+2 Operational - 1 Debt)"] end
subgraph DebtFree["Year 25+: Mortgage Paid Off"] N2["Nuclear Net Cash Flow: +8/yr<br>(-5 Debt Eliminated)"] G2["Gas Net Cash Flow: +2/yr<br>(-1 Debt Eliminated)"] end
N1 -->|"Mortgage Retired"| N2 G1 -->|"Mortgage Retired"| G2 ```
What happens immediately after year twenty-five is even more striking because of the way debt service structured each plant's annual balance sheet. For the nuclear plant, five units of annual mortgage expense vanish overnight, allowing annual net earnings to jump from +3 to potentially +8. For the natural gas plant, shedding its smaller capital debt only eliminates one unit of annual expense, bumping net profits from +1 to +2 per year. Freed from its heavy capital payments, the nuclear facility transforms into an overwhelming cash generator. As Illinois EnergyProf puts it: “The potential in the long run for a nuclear power plant to make more money is astounding.”
| Power Plant Type | Cumulative Margin at Year 25 | Annual Debt Service Removed | Post-Debt Annual Net Cash Flow | |:--- |:--- |:--- |:--- | | **Nuclear** | +36 units | -5 units/year | +8 units/year | | **Natural Gas** | +21 units | -1 unit/year | +2 units/year |
[19:15](https://www.youtube.com/watch?v=cbeJIwF1pVY&t=1155s) Short-Term Horizons vs. Long Plant Lifetimes
Although commercial nuclear power plants are amortized over twenty or twenty-five years, they possess an operational lifetime of at least forty years, with many licensed to run far longer. However, real-world operation is not entirely frictionless; as a plant ages, expenditures beyond simple fuel costs inevitably rise. Routine operations, periodic refurbishment, inspections, and component maintenance mean that actual late-life profits will be somewhat smaller than a theoretical frictionless cash windfall. Even with those realistic operational deductions factored in, nuclear remains highly economical over four decades if conditions remain stable.
The fundamental dilemma in the energy market stems from a mismatch between technical operating lifetimes and institutional planning horizons. Political leaders rarely think beyond the next election cycle, and few corporate boardrooms are willing to bet on returns twenty years out. Consequently, utility developers across the globe overwhelmingly choose to construct natural gas turbines: they require far lower capital investments up front, can be completed in a fraction of the time, and carry dramatically less financing and regulatory uncertainty. Despite these advantages for gas, nuclear remains a compelling moneymaker when capital costs can be kept around $5 billion, construction completed within six years, and interest rates held low. Highlighting this disconnect between political incentives and long-term planning, Illinois EnergyProf reflects: “Very few governments look beyond the length of time where the officials are actually in power maybe there's some exceptions and let's hope our politicians have long foresights in front of them.”
- **Design and Operating Lifespans:** Standard nuclear reactor operating licenses typically span 40 years minimum, with potential license renewals extending well beyond debt retirement. - **Rising O&M Overhead:** Operating and maintenance expenses rise naturally as plants age, trimming back peak post-debt profit margins. - **Why Gas Dominates New Builds:** Low upfront capital expenditures, rapid 2-to-3-year construction turnaround, and drastically reduced financing risk make gas the default corporate choice despite nuclear's superior long-term fuel economics.
[21:04](https://www.youtube.com/watch?v=cbeJIwF1pVY&t=1264s) Levelized Cost of Electricity and the Promise of Small Modular Reactors
When economists evaluate generation sources systematically, they turn to the levelized cost of electricity (LCOE), which integrates upfront capital expenditure, fuel expenses, routine operations, and maintenance, averaging them across the full operational life of the facility. On a levelized cost graph, nuclear holds a very competitive position over time due to negligible fuel price volatility. Historically, coal shared a comparable cost profile and was long treated as the cheapest, most dependable baseload choice, though it produces the highest volume of greenhouse gas emissions. Meanwhile, natural gas used to be an expensive peak-power option, but the advent of cheap domestic gas supplies driven by modern extraction drove gas costs down into the same competitive range as coal and nuclear. Petroleum oil remains the clear outlier: even when crude prices collapse from $100 down to $50 a barrel, burning oil to generate utility-scale electricity remains entirely uncompetitive.
Because traditional nuclear economics is hypersensitive to assumptions regarding construction duration, interest rates, and multi-billion-dollar cost overruns, the global nuclear industry is pivoting aggressively toward Small Modular Reactors (SMRs). SMRs directly target the structural flaw of conventional gigawatt-scale plants: the crushing upfront capital burden and the multi-year delay before generating a single kilowatt-hour. By pre-fabricating smaller reactors in factory settings and deploying them incrementally, developers can avoid sinking into deep negative financial territory while preserving nuclear power's core advantage of rock-bottom fuel expenses. Illinois EnergyProf sums up the global motivation behind this shift: “And that's what people are working on across the world today because if you didn't have to go into such a large negative territory if you didn't have to build such an expensive power plant up front and take so long before you got to actually make any electricity from it given the low fuel cost for nuclear power it could be a very smart bet.”
- **Fuel Cost Stability:** Nuclear and coal historically provided predictable baseload costs; cheap domestic gas recently brought gas LCOE into parity with both. - **Oil Power Inefficiency:** Oil at $50/barrel remains uneconomical for baseload electric generation compared to coal, gas, or nuclear. - **Small Modular Reactor (SMR) Rationale:** SMRs shrink initial capital outlays, shorten project development schedules, and avoid the deep, multi-year negative cash flows that make conventional large-scale nuclear plants financially precarious.
## Notable quotes > [17:01](https://www.youtube.com/watch?v=cbeJIwF1pVY&t=1021s) The potential in the long run for a nuclear power plant to make more money is astounding. — Illinois EnergyProf
## Mentioned Illinois EnergyProf, Westinghouse AP1000, Small Modular Reactors (SMRs), Generation III/III+ reactors
## Video description What are the costs to construct, fuel and operate a nuclear power plant compared to a natural gas power plant. Compares capital cost and fuel costs and looks at how the cost over time should be analyzed. This is done in a visual manner. The time to construct the plant is shown to be a critical variable along with interest rates. The years when the investment is paid off, when the costs are equal and the variables which could change in value over time are all discussed. Electric production costs of all different types of fuels are compared.
[Source](https://www.youtube.com/watch?v=cbeJIwF1pVY)