Transit Networks Absorb Induced Demand While Urban Highways Choke
Oh The Urbanity!
All transportation infrastructure generates induced demand, but rail and cycling convert higher volumes into increased service frequency and public benefits rather than the gridlock produced by car expansion.
AI-assisted summary of What People Get Wrong About Induced Demand — original source. Check the original for full context.
Source published:
Key ideas
- Studies indicate that between 50% and 100% of newly constructed urban highway capacity is absorbed by additional traffic within just a few years, returning congestion to baseline levels. (0:48)
- While Toronto's six-lane Don Valley Parkway moves only 6,000 to 8,000 people per direction per hour at peak, the two-track Yonge Subway line currently carries roughly 30,000, projected to reach 40,000 with signaling upgrades. (0:01)
- Induced demand is not exclusive to road infrastructure; it applies equally to transit, walking, and cycling, but the resulting network effects and societal impacts differ drastically by mode. (0:48)
- Unlike automobile congestion, transit demand produces positive feedback loops, allowing agencies to justify higher service frequencies, grade separation, and larger capacity vehicles. (3:30)
Detailed notes
## Background Published on YouTube by the urban planning channel Oh The Urbanity! on August 29, 2021, this video re-examines the mechanics of induced demand. According to the video description, while the phenomenon is frequently cited to oppose road expansions that fail to relieve congestion, the discussion explores why induced demand applies equally to transit, walking, and cycling infrastructure, but yields fundamentally different consequences.
## TL;DR While induced demand is commonly weaponized against highway widening because new lanes rapidly refill with cars, the video demonstrates that all functional transportation infrastructure naturally induces travel demand. Comparing Toronto's Don Valley Parkway with its subway corridors illustrates that mass transit absorbs vastly higher passenger volumes across a tiny footprint, turning high demand into a marker of success rather than a failure mode. Furthermore, while automobile congestion degrades travel conditions and carries steep spatial and environmental costs, induced demand in transit and active transportation triggers positive network effects, such as improved service frequencies and enhanced public health. Ultimately, the central question for city planners is not how to avoid inducing demand, but deciding which specific type of travel behavior a city wants to induce.
## Atmosphere & style The presentation carries a calm, measured, and intellectually constructive tone that swaps anti-car rhetoric for clear-headed structural analysis. Guided by an articulate, unhurried voiceover, the pacing feels methodically reasoned as it unpacks transit planning metrics and real-world Toronto case studies. The viewing experience feels quietly eye-opening, prompting the audience to move beyond standard urbanist catchphrases and look directly at the underlying mechanics of network capacity and urban geometry.
## Bulletin - [00:48](https://www.youtube.com/watch?v=8wlld3Z9wRc&t=48s) Studies indicate that between 50% and 100% of newly constructed urban highway capacity is absorbed by additional traffic within just a few years, returning congestion to baseline levels. - [00:01](https://www.youtube.com/watch?v=8wlld3Z9wRc&t=1s) While Toronto's six-lane Don Valley Parkway moves only 6,000 to 8,000 people per direction per hour at peak, the two-track Yonge Subway line currently carries roughly 30,000, projected to reach 40,000 with signaling upgrades. - [00:48](https://www.youtube.com/watch?v=8wlld3Z9wRc&t=48s) Induced demand is not exclusive to road infrastructure; it applies equally to transit, walking, and cycling, but the resulting network effects and societal impacts differ drastically by mode. - [03:30](https://www.youtube.com/watch?v=8wlld3Z9wRc&t=210s) Unlike automobile congestion, transit demand produces positive feedback loops, allowing agencies to justify higher service frequencies, grade separation, and larger capacity vehicles.
## Key takeaways - [00:01](https://www.youtube.com/watch?v=8wlld3Z9wRc&t=1s) Passenger throughput differences between mass transit and urban highways are immense, with a two-track subway moving up to five times more people per hour than a six-lane highway. - [00:01](https://www.youtube.com/watch?v=8wlld3Z9wRc&t=1s) Subway infrastructure carries vast crowds while occupying a minimal surface footprint compared to the massive urban land requirements of highways. - [00:48](https://www.youtube.com/watch?v=8wlld3Z9wRc&t=48s) Induced demand—or induced traffic—occurs because expanded road capacity incentivizes drivers to alter trip timing, take additional journeys, and relocate closer to the expanded corridor. - [00:48](https://www.youtube.com/watch?v=8wlld3Z9wRc&t=48s) Using induced demand solely as a weapon against car infrastructure is intellectually incomplete because transit and active mobility also induce demand. - [02:09](https://www.youtube.com/watch?v=8wlld3Z9wRc&t=129s) In transit planning, induced demand is intentionally sought as 'induced ridership' to validate investments and encourage transit-oriented growth. - [02:09](https://www.youtube.com/watch?v=8wlld3Z9wRc&t=129s) High transit ridership and occasional overcrowding are viewed as indicators of success and signals to expand network capacity, whereas road congestion represents systemic operational failure. - [03:30](https://www.youtube.com/watch?v=8wlld3Z9wRc&t=210s) Mass transit can absorb substantially greater passenger volumes before reaching full capacity compared to automotive lanes. - [03:30](https://www.youtube.com/watch?v=8wlld3Z9wRc&t=210s) High transit ridership triggers positive network improvements such as increased service frequency and vehicle upgrades, benefiting individual riders instead of merely slowing them down. - [03:30](https://www.youtube.com/watch?v=8wlld3Z9wRc&t=210s) Transit systems feature built-in pricing levers through fares and subsidies, whereas road pricing and tolls face intense public and political pushback in North America. - [05:43](https://www.youtube.com/watch?v=8wlld3Z9wRc&t=343s) Expanding pedestrian and cycling infrastructure induces active trips, yielding public health benefits without the lethal safety risks, air pollution, or noise generated by cars. - [05:43](https://www.youtube.com/watch?v=8wlld3Z9wRc&t=343s) Active transportation and mass transit demand relatively modest capital and spatial footprints, avoiding the neighborhood demolition historically required for urban highways. - [05:43](https://www.youtube.com/watch?v=8wlld3Z9wRc&t=343s) The primary flaw of automotive infrastructure is not that it induces trips, but rather the severe negative externalities and spatial inefficiency of cars in dense urban environments. - [05:43](https://www.youtube.com/watch?v=8wlld3Z9wRc&t=343s) The fundamental policy question for cities is not which transportation infrastructure induces demand, but which type of demand a community chooses to induce.
## Detailed walkthrough ### [00:01](https://www.youtube.com/watch?v=8wlld3Z9wRc&t=1s) The Capacity Chasm: Subways vs. Urban Highways
While it is widely accepted that public transit moves large crowds far more efficiently than private automobiles, public discourse rarely emphasizes the staggering scale of that gap. A direct comparison between two major corridors in Toronto illustrates this disparity vividly. On the Don Valley Parkway (DVP), a six-lane highway, observing peak rush-hour traffic reveals that only about 6,000 to 8,000 people pass by in the busier direction over the course of an entire hour. Meanwhile, on the nearby Yonge Subway line, the system currently moves roughly 30,000 people per direction per hour, with in-progress signal modernizations expected to elevate that threshold to 40,000.
```mermaid flowchart LR accTitle: Capacity Comparison Between Highway and Subway accDescr: Chart comparing passenger throughput per direction per hour between the Don Valley Parkway and the Yonge Subway.
subgraph Highway["Six-Lane Highway (DVP)"] DVP["6,000 to 8,000<br/>passengers/hr/dir"] end
subgraph Subway["Two-Track Subway (Yonge Line)"] YCurrent["Current: 30,000<br/>passengers/hr/dir"] YFuture["Future Upgrades: 40,000<br/>passengers/hr/dir"] YCurrent -.-> YFuture end ```
The physical footprint makes the numbers even more striking: the subway achieves this massive volume occupying only two tracks, primarily buried underground, whereas the highway consumes six full lanes of valuable urban surface. As the narrator underscores: “Subways don’t carry freight, but when it comes to carrying lots of people, mass transit wins hands down and it’s not even close.”
- **Don Valley Parkway (DVP)**: 6 lanes carrying 6,000–8,000 people per direction per hour at peak. - **Yonge Subway line**: 2 tracks carrying 30,000 people per direction per hour currently; projected to reach 40,000 with signaling upgrades.
---
[00:48](https://www.youtube.com/watch?v=8wlld3Z9wRc&t=48s) The Mechanics and Misconceptions of Induced Demand
Anyone following debates over roadway expansions is likely familiar with "induced demand"—often more accurately described as "induced traffic"—popularized by media outlets like Vox with colorful ball visualizations to campaign against new highway projects. The core premise is straightforward: expanding road capacity fails to resolve traffic congestion over the long term because it incentivizes more driving. Motorists who previously adjusted their schedules to avoid rush hour become careless about departure times and trip frequency. Concurrently, residents and commercial enterprises migrate toward the expanded corridor to capitalize on the open asphalt. Consequently, congestion inevitably returns to baseline levels.
Empirical urban research confirms this is not an illusion: studies show that between 50% and 100% of newly constructed road capacity in urban centers is absorbed by additional traffic within just a few years. It is not an infinite phenomenon—building a massive highway in remote wilderness will not magically conjure traffic—but it holds true in populated areas. Yet, framing induced demand exclusively as a weapon against car infrastructure remains intellectually incomplete. If building a new subway route leads to packed trains a few years down the line, critics could theoretically argue that subways suffer from the exact same failure mode.
> “However, the induced traffic argument against new car infrastructure has always seemed, maybe not wrong, but certainly incomplete, because why does it only mention cars?”
---
[02:09](https://www.youtube.com/watch?v=8wlld3Z9wRc&t=129s) Induced Ridership: The Goal of Mass Transit
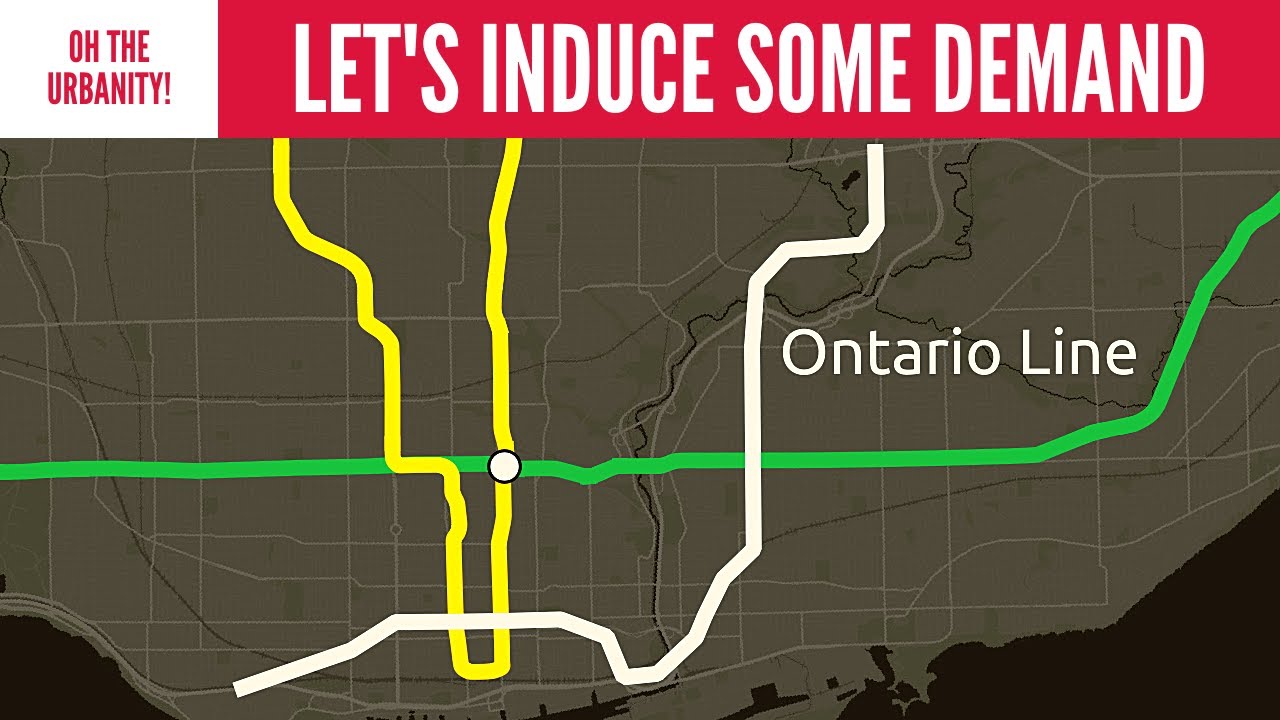
To resolve overcrowding along the Yonge line and its bottleneck transfer point at the Bloor-Danforth Line, Toronto transit planners designed the Ontario Line, an automated rapid transit line intended to supply much-needed capacity through the city's east end. This project functions under the exact same dynamic as road building, except planners designate it "induced ridership." The line will encourage existing residents to take more journeys and attract new residents into growing east-end transit-oriented neighborhoods. Eventually, the Ontario Line will likely become congested as well.
The critical distinction lies in planning intent. While traffic engineers view traffic gridlock as a systemic failure, mass transit authorities view high ridership as success. Even though excessive overcrowding degrades the passenger experience, safety, and operating efficiency, reaching maximum capacity does not invalidate the original investment. Rather, it validates the project's utility and signals the necessity of building the next line. As the narrator observes: “The Yonge line is overcrowded now and no one thinks that means it shouldn’t have been built.”
- **Planned Ontario Line top capacity**: 34,000 passengers per hour per direction. - **Overcrowding perspective**: High passenger volume proves utility and justifies follow-up transit infrastructure; having an overcrowded transit line is far preferable to lacking one entirely.
---
[03:30](https://www.youtube.com/watch?v=8wlld3Z9wRc&t=210s) Why Induced Demand Favors Transit Over Cars
The reason induced demand feels threatening when applied to cars, but positive when applied to trains, rests on structural differences in capacity, system dynamics, and economic mechanisms:
```mermaid flowchart TD accTitle: Mode Dynamics Under High Demand accDescr: Diagram illustrating how added demand impacts driving negatively versus transit positively.
subgraph Driving["Car Driving Infrastructure"] CarD["Increased Road Demand"] --> Congest["Severe Traffic Congestion"] Congest --> CarWorse["Experience Degrades for All Users"] CarWorse --> RoadTolls["Pricing (Tolls) Politically Unpopular"] end
subgraph Transit["Public Transit Infrastructure"] TrD["Increased Transit Demand"] --> AgencyAction["Agency Adds Capacity<br/>(Higher Frequencies, Grade Separation)"] AgencyAction --> TrBetter["Service Improves for Individual Riders"] TrBetter --> Farebox["Built-In Pricing Mechanism<br/>(Fares & Subsidies)"] end ```
First, transit can absorb immense passenger volumes before becoming overwhelmed. Pitting the planned Ontario Line (34,000 passengers per hour per direction) against a hypothetical six-lane highway matching the DVP (6,000 to 8,000 passengers per direction per hour) reveals that both attract trips, but the car highway will choke on its own demand orders of magnitude faster.
Second, mass transit exhibits positive network feedback where high ridership triggers operational improvements. When a transit agency responds to rising demand, the remedies—elevating service frequencies, substituting buses with rail vehicles, granting transit signal priority, or converting surface routes into tunneled or elevated rights-of-way—directly improve convenience for individual passengers. For motorists, other cars represent purely negative competition that slows down travel. The narrator crystallizes this dynamic: “No one wishes for more drivers on their road to get more lanes, but you might wish for more ridership on your transit route so that you can get better frequency.”
Third, transit systems possess a built-in pricing lever. A transit agency can manage demand simply by raising standard ticket or transit pass prices, accompanied by targeted low-income subsidies to safeguard equity. In contrast, managing car traffic requires cordon pricing or toll roads, which face intense political resistance across Canada and North America. Relying on fuel taxes remains ineffective as a congestion pricing substitute because drivers easily evade it by purchasing fuel-efficient cars or refueling in adjacent tax jurisdictions.
---
[05:43](https://www.youtube.com/watch?v=8wlld3Z9wRc&t=343s) Active Mobility and the Core Question of Urban Planning
Induced demand also governs active transportation, including walking and cycling infrastructure. If an overcrowded multi-use trail is expanded to provide segregated facilities for cyclists and pedestrians, the improvement will induce more people to walk and ride bikes. Rather than sparking municipal backlash, this shift yields widespread public benefits: - **Public Health**: Elevated levels of routine physical activity directly bolster public health outcomes. - **Absence of Negative Externalities**: Pedestrians and cyclists generate virtually no noise pollution, toxic exhaust, or lethal safety risks for surrounding neighborhoods. - **Spatial and Financial Footprint**: Active infrastructure demands minimal capital expenditure and physical space. While countless historic North American urban neighborhoods were bulldozed in the mid-20th century to construct urban highways, modern protected bike lanes require no neighborhood demolition.
```mermaid flowchart TD accTitle: The Universal Mechanism of Induced Demand accDescr: Flowchart demonstrating how urban infrastructure design choices dictate travel behavior and personal lifestyle decisions.
Choice{"Infrastructure Built"}
Choice -->|"Wider Roads"| DriveLife["People drive more & organize lives around cars"] Choice -->|"Fast Transit Lines"| TransitLife["People ride transit & organize lives around transit"] Choice -->|"Safe Bike Networks"| BikeLife["People bike more & organize lives around cycling"] ```
Ultimately, invoking induced demand solely as a generic weapon against road expansion misses the forest for the trees. The core flaw of automotive infrastructure is not merely that it induces trips—every well-designed transportation system induces trips by connecting destinations. The fatal flaw lies in the negative externalities of the automobile and the unforgiving spatial geometry of cars operating within dense cities. In the narrator's concluding words: “The question isn’t really which types of transportation infrastructure induce demand, because they all do; the question is which type of demand you want to induce.”
## Notable quotes > [05:43](https://www.youtube.com/watch?v=8wlld3Z9wRc&t=343s) The question isn’t really which types of transportation infrastructure induce demand, because they all do; the question is which type of demand you want to induce.
> [03:30](https://www.youtube.com/watch?v=8wlld3Z9wRc&t=210s) No one wishes for more drivers on their road to get more lanes, but you might wish for more ridership on your transit route so that you can get better frequency.
> [00:01](https://www.youtube.com/watch?v=8wlld3Z9wRc&t=1s) Subways don’t carry freight, but when it comes to carrying lots of people, mass transit wins hands down and it’s not even close.
## Mentioned Oh The Urbanity!, Don Valley Parkway, Yonge Subway line, Vox, Bloor-Danforth Line, Ontario Line, Metrolinx, Toronto
## Video description Induced demand (probably more accurately called induced traffic) is the phenomenon where building or expanding roads and highways doesn't help congestion because it results in more people driving. This is often used as an argument against building the new car infrastructure, but people don't talk often about how induced demand applies to other modes. In this video we explain why induced demand does apply to transit, walking, and cycling infrastructure, but with different consequences.
Support our work/watch more: Patreon: https://www.patreon.com/ohtheurbanity Urbanism playlist: https://www.youtube.com/playlist?list=PLN3OhfIDlvuMjcg36sdLJuxaXi6OaOWFD Subscribe for more videos: https://www.youtube.com/channel/UCN5CBM1NkqDYAHgS-AbgGHA?sub_confirmation=1
More information: Visualizing the Footprint of Highways in American Cities: https://www.visualcapitalist.com/visualizing-the-footprint-of-highways-in-american-cities/ Metrolinx Ontario Line report: http://www.metrolinx.com/en/docs/pdf/board_agenda/20190912/20190912_BoardMtg_Ontario_Line_Initial_Business_Case_EN.pdf
#urbanism #induceddemand #transit #toronto #ontarioline #metrolinx
[Source](https://www.youtube.com/watch?v=8wlld3Z9wRc)