Bret Victor Pitches Live Behavior Interfaces to Replace Static Code
Colin McDonnell
Modern computing remains trapped in paper-era text conventions that blind engineers to dynamic behavior, requiring interactive media that engage visual and physical cognition directly.
AI-assisted summary of Bret Victor - Media for Thinking the Unthinkable — original source. Check the original for full context.
Source published:
Key ideas
- Human thought about systems remains trapped in the static paradigms of pencil and paper, leaving modern computer tools underutilized as cognitive media. (0:02)
- Challenging Richard Hamming's concept of inherently 'unthinkable thoughts,' new computational media can act like cognitive prosthetics—akin to microscopes or mathematical notation—to translate complex dynamics into human sensory and mental channels. (8:09)
- Effective thinking environments integrate Jerome Bruner's three cognitive modalities simultaneously: symbolic logic, visual pattern recognition, and interactive tactile manipulation. (12:50)
- System comprehension requires interacting directly with live behavior—measuring, searching, and parameterizing output spaces across entire families of systems—rather than merely manipulating inert structural code. (19:19)
Detailed notes
## Background Published on YouTube by Colin McDonnell on June 17, 2015, this video captures Bret Victor's presentation delivered at the MIT Media Lab on April 4, 2013. The description outlines Victor's talk 'Media for Thinking the Unthinkable' and provides links to his essay outlines, notes, and interactive software demonstrations spanning scientific communication, dynamic circuit schematics, signal processing filters, and vector drawing tools.
## TL;DR Bret Victor argues that human comprehension of complex systems is severely constrained by legacy media like static text, formulas, and paper schematics, which force thinkers into mentally exhausting symbolic simulations. Drawing on cognitive models like Jerome Bruner's modes of representation and Richard Hamming's concept of 'unthinkable thoughts,' Victor demonstrates how computing can serve as an active cognitive prosthesis by engaging symbolic, visual, and interactive channels simultaneously. Through interactive prototypes—including live circuit networks, multi-perspective digital filters, linked pipeline code inspectors, and dynamic vector drawing tools—he shows how software can render hidden internal behavior visible and directly manipulable. The talk concludes with an urgent plea to move beyond paper-derived programming paradigms and discover a true computational medium for understanding dynamic systems.
## Atmosphere & style The lecture carries an intellectually electrifying yet understated and focused atmosphere, characteristic of a visionary masterclass. Victor speaks with quiet, deliberate conviction, effortlessly pairing rigorous historical reflections with dazzling, real-time software demonstrations that make standard industry tools look primitive by comparison. Watching the presentation feels like peering into an alternate future of human cognition, progressing from analytical critique to wonder and culminating in an inspiring, open-ended challenge to the audience to reinvent how minds reason about the universe.
## Bulletin - [00:02](https://www.youtube.com/watch?v=oUaOucZRlmE&t=2s) Human thought about systems remains trapped in the static paradigms of pencil and paper, leaving modern computer tools underutilized as cognitive media. - [08:09](https://www.youtube.com/watch?v=oUaOucZRlmE&t=489s) Challenging Richard Hamming's concept of inherently 'unthinkable thoughts,' new computational media can act like cognitive prosthetics—akin to microscopes or mathematical notation—to translate complex dynamics into human sensory and mental channels. - [12:50](https://www.youtube.com/watch?v=oUaOucZRlmE&t=770s) Effective thinking environments integrate Jerome Bruner's three cognitive modalities simultaneously: symbolic logic, visual pattern recognition, and interactive tactile manipulation. - [19:19](https://www.youtube.com/watch?v=oUaOucZRlmE&t=1159s) System comprehension requires interacting directly with live behavior—measuring, searching, and parameterizing output spaces across entire families of systems—rather than merely manipulating inert structural code.
## Key takeaways - [00:02](https://www.youtube.com/watch?v=oUaOucZRlmE&t=2s) The representations we use to depict systems define how we think about them and set the boundaries of what we can understand in both science and engineering. - [02:24](https://www.youtube.com/watch?v=oUaOucZRlmE&t=144s) Traditional scientific communication compresses multidimensional mental models into low-bandwidth strings of text and equations, forcing readers to perform grueling internal simulations. - [02:24](https://www.youtube.com/watch?v=oUaOucZRlmE&t=144s) Dynamic, sequential visual representations externalize state transitions and mathematical scaling, allowing direct perception of algorithms instead of mental decompression. - [05:10](https://www.youtube.com/watch?v=oUaOucZRlmE&t=310s) Circuit design tools should replace inert symbols with coordinated, live waveforms and behavioral current blocks displayed across the entire system simultaneously. - [08:09](https://www.youtube.com/watch?v=oUaOucZRlmE&t=489s) While Richard Hamming posited biological limits create 'unthinkable thoughts,' humanity has consistently bypassed cognitive and sensory barriers by inventing external instruments and notations. - [09:35](https://www.youtube.com/watch?v=oUaOucZRlmE&t=575s) Representational leaps such as written literacy and symbolic mathematical notation were fundamentally user interface innovations that permanently altered human cognitive capabilities. - [12:50](https://www.youtube.com/watch?v=oUaOucZRlmE&t=770s) Human cognition operates across three channels—enactive (interactive), iconic (visual), and symbolic—and breakthroughs frequently occur by switching problems out of the symbolic channel into the other two. - [16:43](https://www.youtube.com/watch?v=oUaOucZRlmE&t=1003s) Presenting synchronized, multi-perspective views of dynamic systems (equations, step responses, pole-zero plots, frequency spectra) enables holistic, intuitive system exploration. - [19:19](https://www.youtube.com/watch?v=oUaOucZRlmE&t=1159s) Direct interaction should operate on behavioral outputs rather than just structural parameters, turning algebraic solving into dynamic search queries over time-series data. - [23:03](https://www.youtube.com/watch?v=oUaOucZRlmE&t=1383s) Correlating parameters directly to measured behavioral features enables thinkers to abstract and reason across entire families of systems rather than individual instances. - [24:51](https://www.youtube.com/watch?v=oUaOucZRlmE&t=1491s) Domain-specific stream languages like Nile can express complex rendering in minimal code, but require linked intermediate visualizations to reveal pipeline behavior. - [28:25](https://www.youtube.com/watch?v=oUaOucZRlmE&t=1705s) Because visual thinking relies on spatial perception, authoring system visualizations must be done through direct visual manipulation rather than symbolic coding. - [31:17](https://www.youtube.com/watch?v=oUaOucZRlmE&t=1877s) Dynamic drawing tools allow data-driven graphics to combine the directness and immediacy of drawing on paper with programmatic reusability. - [38:16](https://www.youtube.com/watch?v=oUaOucZRlmE&t=2296s) Modern computing remains constrained by a legacy of paper-oriented thinking, epitomized by static handwritten code that prioritizes syntax over runtime behavior.
## Detailed walkthrough ### [00:02](https://www.youtube.com/watch?v=oUaOucZRlmE&t=2s) Media for Thinking About Systems
Bret Victor opens his presentation at the MIT Media Lab by remarking that while it is natural to discuss media in a media lab, his focus is specifically on “media for thinking in,” applied toward a fundamental cognitive goal: understanding systems. Whether examining the natural world—such as observing the planets orbiting the Sun, taking measurements, discovering patterns, and constructing a theoretical model (science)—or starting from theory to engineer artificial systems like a spacecraft to reach those planets (engineering), the core challenge remains identical. Both disciplines, and everything between them, pivot entirely on comprehending how systems behave.
Victor argues that media serve as thinking tools. The representations humans invent to portray a system dictate how they can conceptualize it and govern what can be understood about it. To comprehend more complex systems and construct more ambitious ones, society requires entirely new representations, along with a powerful new medium in which to create and manipulate them. Most contemporary tools, even those running on modern computers, remain deeply chained to the paradigm of pencil and paper. Victor contends that computing presents an enormous, largely untapped opportunity to rethink how humans reason about systems. Across varied domains like programming, circuit design, and signal processing, the technical specifics matter less than the underlying representational principles. As Victor states: “The representations that we use of the system are how we think about it our representations are um how we understand this system and what we understand about it and so if we want powerful new ways of understanding complex systems if we want to build powerful new systems we need powerful new representations and we need a powerful new medium in which we can create and work with those representations.”
```mermaid flowchart LR accTitle: Science versus Engineering System Thinking accDescr: Science moves from physical systems to theoretical models, while engineering moves from theory to constructing systems.
subgraph ScienceFlow["Science"] S1["Observed System<br/>(e.g., Planetary Orbits)"] -->|"Measure & Model"| T1["Theoretical Model"] end
subgraph EngFlow["Engineering"] T2["Theory & Principles"] -->|"Design & Build"| S2["Constructed System<br/>(e.g., Spacecraft)"] end ```
- Understanding systems lies at the heart of both science (system to theory) and engineering (theory to system). - Current digital tools still force thinkers into static pencil-and-paper mental models. - The examples presented across diverse disciplines all share generalizable representational principles.
---
[02:24](https://www.youtube.com/watch?v=oUaOucZRlmE&t=144s) Redesigning the Scientific Paper as Sequential Art
To demonstrate how traditional media fail system comprehension, Victor examines an influential network theory paper published in *Nature* that helped launch modern network science. While written by talented authors, its dense algebraic exposition—packed with conditions like $n \gg k \gg \ln(n) \gg 1$ and variable behaviors where $L$ scales as $2k \gg 1$ and $C$ approaches $3/4$ as $p \to 0$—renders it essentially unreadable on first pass. Victor diagnoses this as an information-theory bottleneck: the researchers harbor a vibrant, multidimensional picture inside their heads, but are forced to pass it through a severely lossy, low-bandwidth channel composed of linear strings of static text, symbols, and isolated static figures. Readers are then left with the grueling, error-prone task of decompressing those abstract symbols back into an active mental model.
Victor presents his own redesign of the paper, using a format where explanatory prose and dynamic sequential diagrams are woven together step by step. Rather than forcing the reader to mentally simulate the paper's network-generation algorithm, the layout visually illustrates each discrete state change across time: starting with a ring of $n = 12$ vertices, connecting each to its $k = 4$ nearest neighbors, selecting an edge, and rewiring it at probability $p$ while iterating clockwise around the circle. Mathematical relationships are similarly externalized; when describing how characteristic path length $L$ scales linearly or logarithmically while clustering coefficient $C$ remains constant or drops reciprocally, the graphs sit right alongside the text. Readers immediately perceive the relationships rather than struggling to reconstruct mathematical curves from memory. As Victor explains: “So what I'm doing here it's it's really just a very simple trick it's to understand the picture that's in the author's head and just reproduce that so we're showing the state of the system we're showing the behavior of the system as it goes through this algorithm.”
- Traditional papers compress multidimensional mental models into a low-bandwidth stream of words and equations. - Victor's redesign depicts the discrete internal state of the graph algorithm at each step ($n=12$, $k=4$, rewiring with probability $p$). - Mathematical trends (linear versus logarithmic scaling of $L$ and reciprocal behavior of $C$) are shown directly in context rather than left to internal visualization.
---
[05:10](https://www.youtube.com/watch?v=oUaOucZRlmE&t=310s) Live Data Representations in Circuit Design
Victor applies this identical principle to electrical engineering. He shows an interactive circuit schematic tool where he finishes drawing a connection, making the circuit functional. However, because traditional schematics are inert line drawings, nothing visibly happens on screen. In a physical laboratory, an engineer would at least pick up an oscilloscope probe to inspect individual voltages node by node. Victor adds a simulated real-time oscilloscope trace to an active node, but points out that this still falls short of providing a systemic understanding. To truly grasp how a circuit operates, an engineer cannot inspect isolated variables in isolation; they must perceive all voltages across the network simultaneously.
```mermaid flowchart TD accTitle: Evolution of Circuit Schematic Representations accDescr: Progressing from dead schematics to single-node probes, multi-node voltage plots, and complete embedded voltage-current behavior.
A["Dead Schematic<br/>(Pencil & Paper Symbols)"] --> B["Single Node Scope<br/>(One Voltage Over Time)"] B --> C["Coordinated Voltage Traces<br/>(Interactive Scrubbing & Overlays)"] C --> D["Embedded Behavior Blocks<br/>(Live Voltage & Component Currents)"] ```
Victor spreads the schematic components apart, replacing static wires with synchronized, real-time voltage waveforms across every junction. Scrubbing over any trace casts a comparative shadow overlay across all other plots, and tweaking a parameter—like dialing a resistor up or down—instantly recalculates and renders the ripple effect through the entire network. Taking the concept further, Victor notes that voltage represents only half of an electronic system's behavior; the other half is current. He transforms the circuit elements themselves: instead of dead, paper-era schematic squiggles for resistors and capacitors, each component becomes an active blue block displaying the real-time current flowing through it, marked with a small identifying badge. The representation retains all classic topological connectivity, but trades inert symbols for live behavior. As Victor observes: “The difference is now instead of just being made out of these squiggly symbols that were designed for pencil and paper now it's made out of live data where you can see what the system's doing.”
- Traditional schematics conceal internal dynamics, forcing engineers to simulate states mentally. - Victor's tool displays coordinated waveforms at every node, complete with scrubbable timelines and comparative cursor shadows. - Static resistor and capacitor symbols are replaced with active behavioral blocks rendering live current waveforms. - Adjusting component values immediately propagates behavioral changes throughout every voltage and current visualization.
---
[08:09](https://www.youtube.com/watch?v=oUaOucZRlmE&t=489s) Unthinkable Thoughts and Cognitive Prosthetics
Zooming out to theoretical foundations, Victor frames his design philosophy through the writings of mathematician and Bell Labs computer pioneer Richard Hamming. In his famous essay, *The Unreasonable Effectiveness of Mathematics*, Hamming reflected on the biological constraints of human perception and cognition:
> “Just as there are odors that dogs can smell and we cannot, as well as sounds that dogs can hear and we cannot, so too there are wavelengths of light we cannot see and flavors we cannot taste. Why then, given our brains wired the way they are, does the remark ‘Perhaps there are thoughts we can't think’ surprise you? Evolution, so far, may have blocked us from being able to think in some directions; there could be unthinkable thoughts.”
Victor praises Hamming's brilliance, but points out a glaring blind spot in his fatalistic conclusion. While humans lack the biological organs to naturally perceive ultraviolet light, infrared radiation, or ultrasonic audio, civilization does not simply shrug and accept those limitations. Instead, people engineer scientific instruments—such as infrared sensors, radio receivers, and oscilloscopes—that translate phenomena occurring outside natural perceptual ranges into sensory inputs the human body can interpret. Victor suggests the exact same strategy applies to cognition: rather than accepting complex systems as fundamentally “unthinkable,” we can build cognitive tools that map previously inaccessible systemic behaviors directly into human perceptual channels.
- Richard Hamming proposed that human evolutionary wiring creates inherent cognitive blind spots, leading to “unthinkable thoughts.” - Victor argues that humanity has always overcome sensory limitations by inventing instruments that adapt imperceptible phenomena to human senses. - The true objective of new computational media is to act as an equivalent cognitive prosthesis, transforming abstract, unthinkable systems into visible, manipulable thinking tools.
[09:35](https://www.youtube.com/watch?v=oUaOucZRlmE&t=575s) Adapting Unthinkable Thoughts: Writing and Mathematical Notation
Humans are biologically constrained by their evolutionary sensory apparatus: people cannot hear ultrasound, nor can they directly see microscopic cellular machinery or distant galaxies. Yet humanity bypasses these physical limitations by constructing oscilloscopes, microscopes, and telescopes—instruments that translate invisible physical phenomena into signals that can be perceived with ordinary human eyes. Responding to Richard Hamming’s assertion that there may exist concepts that are fundamentally unthinkable to human minds, Bret Victor argues that tools can perform the exact same adaptation for cognition. By engineering external representations that align with the architecture of the human mind, we can render previously unthinkable thoughts fully comprehensible.
```mermaid flowchart TD accTitle: Tool Mediation for Human Perception and Cognition accDescr: Diagram contrasting sensory tools that adapt physical phenomena with cognitive representations that adapt unthinkable thoughts to the mind.
subgraph PhysicalWorld ["Sensory Adaptation"] P1["Physical Phenomena<br/>(Ultrasound, Cells, Galaxies)"] T1["Physical Tools<br/>(Oscilloscopes, Microscopes, Telescopes)"] S1["Human Senses<br/>('Plain Old Monkey Eyes')"] P1 --> T1 T1 --> S1 end
subgraph CognitiveWorld ["Cognitive Adaptation"] C1["Unthinkable Concepts<br/>(Complex Systems, Dynamic Equations)"] T2["Cognitive Media<br/>(Writing, Math Notation, Interactive UI)"] M1["Human Mind<br/>(Visual, Interactive, Symbolic Channels)"] C1 --> T2 T2 --> M1 end ```
The history of intellectual progress is marked by representational leaps. The most significant cognitive tool in human history was the invention of writing. Before literacy, human thought and speech were ephemeral, vanishing the moment they were uttered. Writing stabilized thought into an external, visible artifact that could be scrutinized, manipulated, and systematically refined—an advance widely viewed as the foundation of rational deliberation. As media theorist Marshall McLuhan argued, introducing a medium alters the cognitive habits of an entire culture: a literate person thinks differently even when not actively holding a pen.
Centuries later, mathematical notation triggered a comparable revolution. Around 900 AD, the mathematician Muhammad ibn Musa al-Khwarizmi described quadratic relationships purely through narrative prose recipes (e.g., asking what square combined with ten of its roots yields thirty-nine, followed by verbal steps to divide, multiply, and add). It took roughly eight hundred years to compress those cumbersome rhetorical instructions into symbolic notation ($x^2 + 10x = 39$). This concise visual syntax exposed deep structural symmetries that remained invisible in narrative prose, allowing mathematicians to manipulate equations algebraically and generalize variables beyond numbers into velocities, matrices, or elements of abstract algebraic groups.
- “So when Hamming says there could be unthinkable thoughts, we have to take that as: yes, but we build tools that adapt these unthinkable thoughts to the way that our minds work and allow us to think these thoughts that were previously unthinkable.” — Bret Victor - “I think it's really interesting that the birth of modern mathematics is considered to be not any particular mathematical concept, but a user interface.” — Bret Victor
---
[12:50](https://www.youtube.com/watch?v=oUaOucZRlmE&t=770s) Bruner’s Three Modes of Thinking and Cognitive Channel Switching
Just as designing an effective optical instrument requires understanding human visual perception, designing cognitive tools requires a clear model of human thought. Victor adopts the cognitive framework proposed by Jerome Bruner (synthesized from Jean Piaget), which categorizes human cognition into three distinct mentalities: 1. **Enactive (Interactive):** Thinking by doing, manipulating physical objects, physical performance, and spatial embodiment. 2. **Iconic (Visual):** Thinking by seeing, inspecting parallel arrangements, recognizing shapes, and drawing spatial analogies. 3. **Symbolic:** Thinking through language, formal symbols, and sequential, step-by-step logical deduction.
```mermaid flowchart LR accTitle: Bruner's Three Cognitive Channels accDescr: Three interconnected modes of thinking identified by Jerome Bruner: Interactive, Visual, and Symbolic.
I["Interactive (Enactive)<br/>• Physical manipulation<br/>• Thinking by doing<br/>• Embodied spatial action"] V["Visual (Iconic)<br/>• Parallel comparison<br/>• Pattern and shape recognition<br/>• Spatial analogies"] S["Symbolic<br/>• Sequential logic<br/>• Language and formulas<br/>• Step-by-step deduction"]
I <--> V V <--> S S <--> I ```
Major conceptual breakthroughs often occur when thinkers shift an intractable problem from the symbolic domain into the interactive or visual channels. A prime historical example of shifting into the interactive channel was the discovery of the molecular structure of DNA by James Watson and Francis Crick. Despite possessing Rosalind Franklin’s X-ray crystallography data and chemical formulas, they could not deduce the double helix purely through symbolic analysis. Instead, they retreated to the machine shop, fabricated mechanical parts out of brass and wire, and manually fitted pieces together in three dimensions. Though peers mocked them for playing with toys, physically manipulating the models enabled them to solve a structure that had eluded purely abstract contemplation.
A parallel shift into the visual channel took place in 1786 when political economist William Playfair authored a treatise on European commercial trade balances. Rather than forcing readers to parse dense pages of numerical tables tallying exports and imports between nations, Playfair conceived what he described as a "map of numbers." By plotting data along coordinates, he published the world's first statistical data graphics, establishing the foundation of modern data visualization by transforming abstract symbolic columns into immediate visual comparisons.
- “The structure of DNA was unthinkable—like, literally nobody could think of it; they were able to think this thought by moving it from the symbolic channel to the interactive channel where they could think with their hands.” — Bret Victor
---
[15:32](https://www.youtube.com/watch?v=oUaOucZRlmE&t=932s) Firing on All Three Cylinders: Multi-Modal Interfaces
Traditional technical media force practitioners to operate almost exclusively in the symbolic channel. In a standard electronics textbook or schematic editor, understanding an analog circuit requires an engineer to perform a grueling mental simulation: remembering the governing symbolic equations for a resistor or capacitor, tracking state changes step by step, and holding the sequential voltages in working memory.
Victor’s interactive circuit environment rebalances this cognitive load by activating all three of Bruner’s mental channels at once: - **Symbolic retention:** The structural diagram retains circuit symbols so the schematic remains recognizable. - **Visual augmentation:** The behavioral output is rendered visually through real-time waveforms displayed across the entire circuit in parallel. Users recognize patterns, compare phase shifts, and inspect wave shapes instantly without mental simulation. - **Interactive tactile loop:** Designers directly scrub and tweak component values, observing live behavioral changes as they drag sliders or adjust parameters.
This creates a tight feedback loop where users formulate a hypothesis, manipulate a control, and watch the visual system respond in real time. Rather than relying on static formulas, the medium allows human spatial intuition, visual pattern processing, and symbolic logic to reinforce one another simultaneously.
- “We're kind of firing on all three cylinders here: instead of this just being a big pile of symbols, we've got the symbolic, we've got the visual, and we've got the interactive, and they're all kind of working together and reinforcing each other.” — Bret Victor
---
[16:43](https://www.youtube.com/watch?v=oUaOucZRlmE&t=1003s) Multiple Simultaneous Representations and Developing System Intuition
To show that interactive thinking media can scale beyond simple circuit diagrams, Victor presents a design environment for a digital filter in signal processing. Dynamic systems are typically defined by differential or difference equations whose operational reality is difficult to grasp from mathematical notation alone. In this interface, the filter is governed by two core parameters: the cutoff frequency and the quality factor ($Q$). Rather than typing numerical constants into code or static formulas, the user manipulates a single 2D control point, dragging horizontally to modulate the cutoff frequency and vertically to tune $Q$.
```mermaid flowchart TD accTitle: Coordinated Dynamic Perspectives in a Digital Filter Tool accDescr: Diagram showing how a single 2D control knob dynamically updates five simultaneous system representations.
Knob["2D Control Point<br/>(Horizontal: Cutoff Frequency | Vertical: Quality Factor Q)"]
subgraph Views ["Five Synchronized Behavioral Views"] V1["Concrete Algebraic Equations<br/>(Abstract variables like Kf become live numbers)"] V2["Time-Domain Step Response<br/>(Transient oscillations and damping)"] V3["z-Plane Pole-Zero Constellation<br/>(System stability and resonance)"] V4["Fourier Transform Spectrum<br/>(Frequency response peaks and roll-off)"] V5["Dynamic Transfer Function Graph<br/>(Direct amplitude/frequency curve)"] end
Knob ==>|"Real-time manipulation"| V1 Knob ==>|"Real-time manipulation"| V2 Knob ==>|"Real-time manipulation"| V3 Knob ==>|"Real-time manipulation"| V4 Knob ==>|"Real-time manipulation"| V5 ```
Static equations obscure magnitude; for example, an abstract gain coefficient like $k_f$ gives the reader no hint whether its practical value is near zero, one, one hundred, or negative. In Victor’s dynamic interface, interacting with the system replaces abstract variables with live, concrete numbers and updates intermediate mathematical expressions on the fly.
As the control point is dragged, the system updates five distinct analytical perspectives in real time: 1. **Concrete equations:** Equations with live numerical coefficients and expression values. 2. **Step response:** A time-domain plot showing the system’s physical transient reaction and settling time. 3. **Complex $z$-plane:** The pole-zero layout mapping frequency domain characteristics and stability. 4. **Fourier transform:** The frequency response spectrum illustrating harmonic attenuation. 5. **Interactive parameter response curve:** The primary transfer function showing bandwidth and resonance.
By seeing these five representations react and "dance together" in direct response to their touch, the user observes how shifting poles in the $z$-plane directly induces time-domain ringing and sharpens the spectral peak in the Fourier transform. This synchronized multi-perspective feedback replaces tedious, page-long manual algebraic derivations with genuine physical intuition, allowing the designer to feel how the system behaves and effortlessly steer it toward a target response.
- “These are five different ways of looking at the behavior of the system, and as I'm interacting, we're seeing all five of them responding at once; we're seeing these five different perspectives on the system, each with its own insights, and we're seeing how they all dance together as I change these parameters.” — Bret Victor - “You've seen the system from so many different angles that you kind of—you can feel your way around it. This is a very different way of thinking than traditional analytic, 'you write a whole bunch of pages of grungy equations and come out with the answer' way of thinking.” — Bret Victor
[19:19](https://www.youtube.com/watch?v=oUaOucZRlmE&t=1159s) Interacting with Behavior: Difference Equations and Searching the Behavior Space
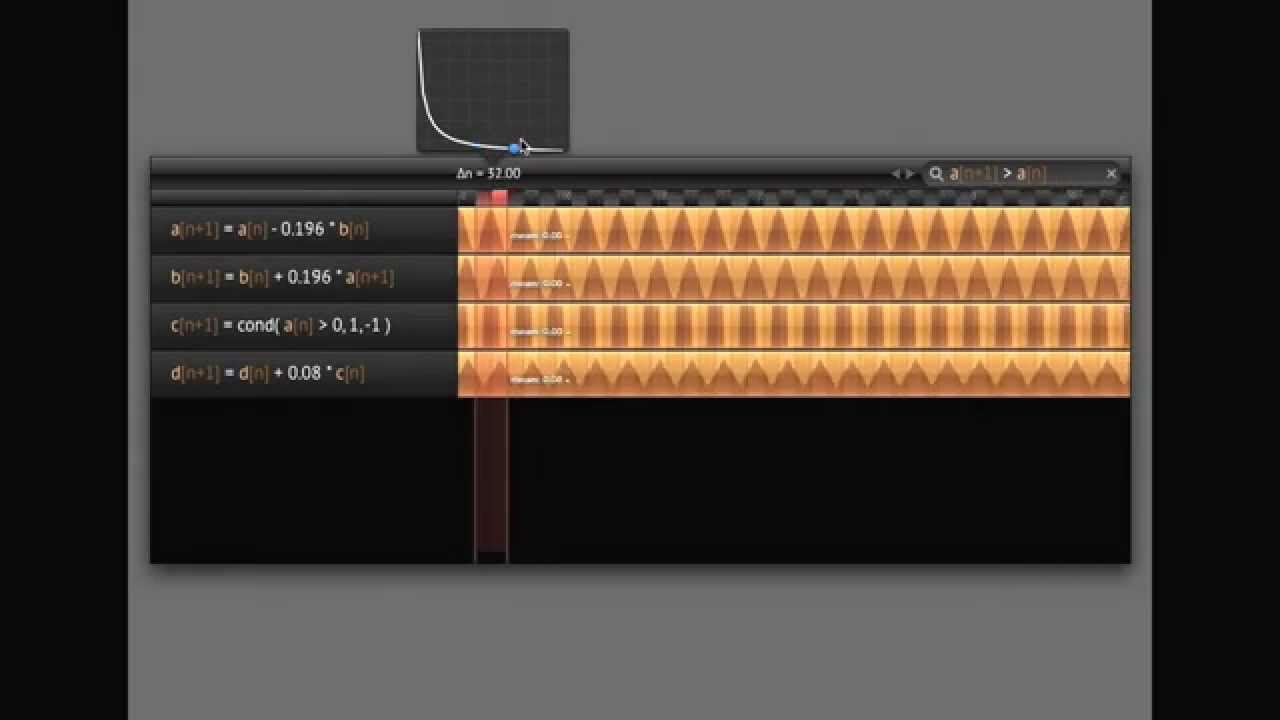
Bret Victor transitions from simply looking at the behavior of a system to actively manipulating and working with it directly. Previously, he explains, interactions were confined to altering system structure and parameters while passively observing output plots. To demonstrate working directly on behavior, he pulls up an interactive environment for exploring difference equations. He starts with a single variable, $A$, initialized as a constant, which produces a flat-line plot. By modifying the equation so that a small increment is subtracted on each time step, the output plot becomes a downward ramp whose slope shifts as the constant is adjusted. When he instead subtracts a quantity linked to a second variable $B$, while simultaneously adding $A$ into $B$ at each step, the two coupled variables oscillate into a sine wave. He adds further operations to demonstrate transformations: defining a variable $C$ that emits $1$ when $A$ is positive and $-1$ when negative produces a square wave; integrating that square wave yields a triangle wave.
```mermaid flowchart LR accTitle: Transformation of coupled difference equations into waveform families accDescr: Pipeline showing coupled difference equations generating a sine wave, transforming to a square wave, and integrating into a triangle wave. subgraph Dynamics["Coupled System"] A["Variable A: subtract B"] B["Variable B: add A"] A <--> B end subgraph Waves["Waveform Transformations"] Sine["Sine Wave"] Square["Square Wave (Sign of A)"] Triangle["Triangle Wave (Integral)"] end Dynamics --> Sine Sine --> Square Square --> Triangle ```
Rather than confining user agency to tweaking the code or parameters on the left, Victor demonstrates interacting with the behavioral plot on the right. To find the period of the sine wave, he clicks and drags over a single cycle, instantly measuring its width at roughly 68 samples. The interface computes live reductions over the selected range, showing a mean of zero, min, max, or user-defined metrics like root-mean-square. When changing the underlying equation coefficient causes the wave period to drift out of sync with a manual selection, Victor introduces an integrated search bar instead of forcing repetitive manual re-selection. A user can type search predicates such as finding all intervals where $A < 0$, where $A < B$, or where $A[n+1] > A[n]$ (locating all rising slopes). As Victor emphasizes: “So what I'm doing here is normally called solving—called solving an equation, solving a system—but here it's treated as searching, which is a very different way of thinking about it.”
- Dragging across behavioral plots surfaces statistical reductions (mean, min, max, RMS) over arbitrary sample intervals. - The behavioral search query treats mathematical equation-solving as an interactive filter over time-series data. - Selecting across consecutive rising-edge zero crossings locks the measurement to a full cycle (e.g., 82 samples), updating dynamically as parameters vary.
---
[23:03](https://www.youtube.com/watch?v=oUaOucZRlmE&t=1383s) Abstracting Over Families of Systems
Victor argues that merely observing a changing number for wave period is insufficient; one needs to understand the relationship between parameter changes and behavioral outcomes. To explore this, he draws a visual connection line from the equation's coefficient directly to the measured sample width. The system automatically generates a scatter/line plot graphing the coefficient on one axis against the period on the other. Victor points out the conceptual leap: each individual point on this new plot corresponds to a specific parameter value and its resulting system behavior, meaning the plot as an aggregate does not describe a single system, but rather an entire family of systems abstracted over that parameter.
Observing that the resulting curve resembles a reciprocal $1/x$ function, Victor notes that one over the period represents frequency. He creates a new variable dividing an assumed sample rate of 48 kHz by the period $N$. Plotting the system's coefficient against this new frequency variable reveals an orderly, linear relationship. Victor reiterates the core design requirements for tools meant to support understanding dynamic behavior: thinkers must be able to view behaviors across all variables at once, interact with behaviors directly through measuring, reducing, and transforming them, search the behavior space, and abstract across entire families of systems.
- Drawing a connection between a parameter and a measured feature plots one against the other automatically. - “Every point on this plot corresponds to a particular system, every point on this plot corresponds to a particular set of coefficients here, which means that the plot as a whole is not about any particular system, but an entire family of systems.” - Reciprocal transformations (e.g., calculating frequency from period using a 48 kHz clock) allow non-linear parameter spaces to be linearized and intuitively inspected.
---
[24:51](https://www.youtube.com/watch?v=oUaOucZRlmE&t=1491s) Linked Representations in Nile: Visualizing Pipeline Execution
Turning to programming systems, Victor demonstrates how multiple representations can be linked together interactively. He introduces a 2D vector graphics engine implemented by Dan Amelang, a researcher working with Alan Kay. While standard production vector graphic engines such as Quartz or Cairo require hundreds of thousands or millions of lines of code, Amelang's engine achieves equivalent functionality in roughly 500 lines of code. This radical concision is made possible by Nile, a domain-specific stream-processing language designed by Amelang to express vector rendering operations with extreme compactness. However, Victor notes a severe trade-off: despite the elegance and beauty of the algorithms, “you can read the code and have no idea what's going on because you can't see the behavior of the system.”
```mermaid flowchart TD accTitle: Data pipeline flow and linked inspection in Nile accDescr: Diagram tracing input points through Nile pipeline stages down to rendered pixels, with bidirectional hover inspection. subgraph Ingest["Input Stage"] Pts["5 Input Points (1st/last duplicated)"] end subgraph Pipeline["Nile Pipeline Stages"] Poly["make_polygon"] Bez["Bézier Generation"] Rast["Rasterize & Texture"] end subgraph Output["Rendered Result"] Pix["Output Pixels / Bar Charts"] end Ingest --> Poly Poly --> Bez Bez --> Rast Rast --> Pix
Hover["Hover Inspection"] -.->|"Traces origin backward"| Ingest Hover -.->|"Traces impact forward"| Pix ```
To solve this, Victor collaborated with Amelang to build an exploratory programming environment for Nile. Nile functions like a Unix pipeline: data streams in, a process executes transformations, and the output feeds the subsequent stage. In a toy polygon program, five input points are fed into a `make_polygon` process that yields four Bézier curves, which then pass down successive pipeline steps. Because Nile functions are so compact, the environment places each process's actual source code alongside its visual state like an explanatory caption. Hovering over an input point immediately highlights all downstream Béziers and intermediate data elements in black, showing exactly how that specific datum is transformed, rounded, or split. Hovering over intermediate data works bidirectionally, displaying both where that piece of data originated and where it goes.
- Dan Amelang's Nile graphics engine implements full 2D vector rendering in around 500 lines of code, compared to millions in Quartz or Cairo. - The pipeline architecture processes streams stage-by-stage, pairing each stage's visual intermediate output with its concise Nile source code. - Bidirectional linked inspection reveals the complete history of any data element, tracing both its past ancestry and future trajectory through the pipeline. - In production pipelines (such as Nile's full rasterizer and texturing engine), the environment automatically selects appropriate visual forms for data types, displaying continuous real-number streams as interactive bar charts rather than raw text.
---
[28:25](https://www.youtube.com/watch?v=oUaOucZRlmE&t=1705s) The Requirement for Creating Visualizations Visually
Victor introduces the final section of his talk by raising a fundamental methodological challenge: if understanding dynamic systems requires rich, interconnected representations, how do thinkers actually build them? He argues that because visualizations are inherently visual and depend on human visual thinking (the brain's spatial and perceptual channel), forcing authors to create them through symbolic, text-only code creates a destructive cognitive barrier. A medium designed for thinking must allow its external representations to be constructed visually.
- “The thing about visualizations is that they're visual. We understand them visually that, you know, that second channel, the visual thinking channel, and so I think it's essential that they be created in the same way, created by [direct visual interaction].”
[28:53](https://www.youtube.com/watch?v=oUaOucZRlmE&t=1733s) Direct Manipulation and the Lost Art of Drawing Data
Bret Victor reflects on the history of visual thought, pointing out that creating pictures directly by hand—what we simply call drawing—dates back to cave paintings. Fifty years ago, an engineer or scientist had a pad of graph paper and a pocket full of pens, plotting incoming experimental data by hand. If two variables seemed related, you sketched a scatter plot; if the sequence mattered, you drew a line connecting the dots; if valid ranges mattered, you drew error regions; and if sample coverage had gaps, you whipped out a highlighter to color vertical columns and identify blanks. This approach had immense immediacy: “and so there's this wonderful expressiveness and directness in drawing that when you want to see something you're like I want to see marginals I need to see my marginals you just go right and there are your marginals right”.
The severe limitation of paper was that everything was an unscalable, one-off artifact. When a new dataset came in, the old sketch had to be discarded and redrawn from scratch. Modern digital illustration tools like Adobe Illustrator suffer from the identical defect: they produce static, one-off pictures. Consequently, practitioners fled drawing altogether in favor of programming languages like Processing, trapping themselves in an indirect, symbolic, linguistic mode of image-making instead of a visual one.
```mermaid flowchart LR accTitle: Evolution of Data Graphics accDescr: Diagram contrasting paper drawing, static digital graphics, code generation, and Bret Victor's dynamic drawing.
subgraph Manual["Direct but Static"] Paper["Graph paper & pens<br/>(Immediate, one-off)"] Illustrator["Vector tools (Illustrator)<br/>(Direct manipulation, one-off)"] end
subgraph Symbolic["Indirect & Dynamic"] Code["Code / Processing<br/>(Linguistic, flexible, non-visual)"] end
subgraph Proposed["Direct & Dynamic"] DynamicDraw["Dynamic Drawing Tool<br/>(Direct canvas manipulation + live data)"] end
Paper --> Illustrator Illustrator -->|"frustration with static one-offs"| Code Code -.->|"reclaim directness"| DynamicDraw ```
[31:17](https://www.youtube.com/watch?v=oUaOucZRlmE&t=1877s) Demo: A Drawing Tool for Dynamic, Data-Driven Pictures
To bridge this divide, Victor demonstrates an experimental vector drawing tool that combines Illustrator-style direct manipulation with data-driven behavior. As on an ordinary canvas, the user draws shapes, lines, scales them, and rotates them; however, the tool quietly records each graphical action as an explicit step. Those steps are then wired directly into a spreadsheet-like data environment. When data values shift, the recorded geometric transforms re-execute dynamically.
Victor reconstructs his earlier graph-paper sketch entirely on this live canvas: - He sweeps out a bounding rectangle across the canvas, scales its width and height to match two data variables, converts it into a guide, and drops a point at the corner. - He loops that operation over all data points to form a scatter plot. - With the line tool, he links the previous sample point to the next, tracing the sequential path, widens the stroke, and turns it orange. - To display sample validity ranges, he draws horizontal bars across the canvas scaled by a width parameter and adorns them with end wings. - To reveal coverage gaps, he draws vertical rectangles extending from canvas top to canvas bottom, rendering them in transparent orange to highlight overlap and holes. - Noticing that the direction of the path remains ambiguous, he freehands an arrowhead, rotates it to match the line segment's actual angle, and repeats it along the sequence. - He hides the original scatter points so they no longer clutter the view.
Because every graphic primitive is bound to the underlying spreadsheet, the picture updates instantly when a new dataset is dropped in. Victor demonstrates this by dragging entirely new datasets onto the canvas and by scrubbing an individual number with the cursor, causing the graphic to smoothly deform in real time. As Victor emphasizes, the goal is: “direct manipulation of the picture itself thinking geometrically instead of thinking algebraically thinking visually instead of thinking in language”.
[36:04](https://www.youtube.com/watch?v=oUaOucZRlmE&t=2164s) Summary: Seeing and Interacting with System Behavior
Victor synthesizes the core principles of the talk, stating that an effective medium for understanding systems must let practitioners observe and manipulate behavior rather than merely editing structural code: - **Immediate behavior over time:** Seeing whole states across every variable simultaneously to enable visual comparison and pattern recognition. - **Immediate response to adjustment:** Tweaking parameters and observing behavioral changes instantaneously to establish mental cause-and-effect models. - **Multiple linked representations:** Viewing behavior through different simultaneous lenses (like time-domain versus frequency-domain) where selecting an element in one view highlights it in all others. - **Interacting directly with behavior:** Measuring, transforming, and querying the dynamic output itself, rather than working purely on static structural descriptions.
Victor underscores the pathology of modern software development: “this idea of being able to interact with the behavior of the system is super important we're normally over here interacting with the structure of the system and that becomes the system so for example when you're programming you're working in code you're thinking about code you're you're interacting with the code you're staring at the code all the time the code becomes the program but code doesn't matter what matters is what the program is doing”. To transcend this, representations must also abstract across families of systems and be authorable via dynamic drawing.
[38:16](https://www.youtube.com/watch?v=oUaOucZRlmE&t=2296s) Escaping the Paper Legacy
Victor cautions that all the prototypes he presented are mere hints that nibble around the corners of a massive unsolved problem: discovering a genuine computational medium for thinking about systems. Even when people operate high-powered modern computers, their thought patterns remain shackled to paper-and-pencil traditions. Programming languages were conceived as linear written text meant for paper.
Pointing to a slide containing Edsger Dijkstra's handwritten notes, Victor notes that Dijkstra mathematically reasoned about everything on paper and that “the idea of visually and interactively exploring the behavior of system wasn't even on his radar he probably would have found it repugnant and that's the Legacy that we've inherited”. Victor concludes with an open invitation to the audience, stating that we have a rare historical chance to reinvent how humanity understands systems: “so I think we have this opportunity to reinvent how we think about systems to create this new medium and I don't know what that Medium is but if you like to help find it let me know thanks”.
## Notable quotes > [09:35](https://www.youtube.com/watch?v=oUaOucZRlmE&t=575s) I think it's really interesting that the birth of modern mathematics is considered to be not any particular mathematical concept, but a user interface. — Bret Victor
> [09:35](https://www.youtube.com/watch?v=oUaOucZRlmE&t=575s) So when Hamming says there could be unthinkable thoughts, we have to take that as: yes, but we build tools that adapt these unthinkable thoughts to the way that our minds work and allow us to think these thoughts that were previously unthinkable. — Bret Victor
## Mentioned Bret Victor, MIT Media Lab, Nature, Richard Hamming, Bell Labs, Marshall McLuhan, Muhammad ibn Musa al-Khwarizmi, Jerome Bruner, Jean Piaget, James Watson, Francis Crick, Rosalind Franklin, William Playfair, Dan Amelang, Alan Kay, Nile, Quartz, Cairo, Adobe Illustrator, Processing, Edsger Dijkstra
## Video description For cool updated about the future of computing, follow me at https://twitter.com/iamvriad.
Presented at the MIT Media Lab on April 4, 2013.
Talk outline: http://worrydream.com/MediaForThinkingTheUnthinkable/
Personal preface: http://worrydream.com/MediaForThinkingTheUnthinkable/note.html
For more information about the demos -- 1. Scientific paper. http://worrydream.com/ScientificCommunicationAsSequentialArt/ 2. Circuit. http://vimeo.com/36579366 3. Digital filter. http://worrydream.com/ExplorableExplanations/ 4. Multitrack signal processing. (first time presented) 5. Nile viewer. http://github.com/damelang/nile 6. Drawing tool. http://vimeo.com/66085662
-----------------------------------------------------------
Bret Victor -- http://worrydream.com
[Source](https://www.youtube.com/watch?v=oUaOucZRlmE)