Circular Times Tables Trace Optical Caustics and Mandelbrot Bulbs
Times Tables, Mandelbrot and the Heart of Mathematics — Mathologer

Mathologer

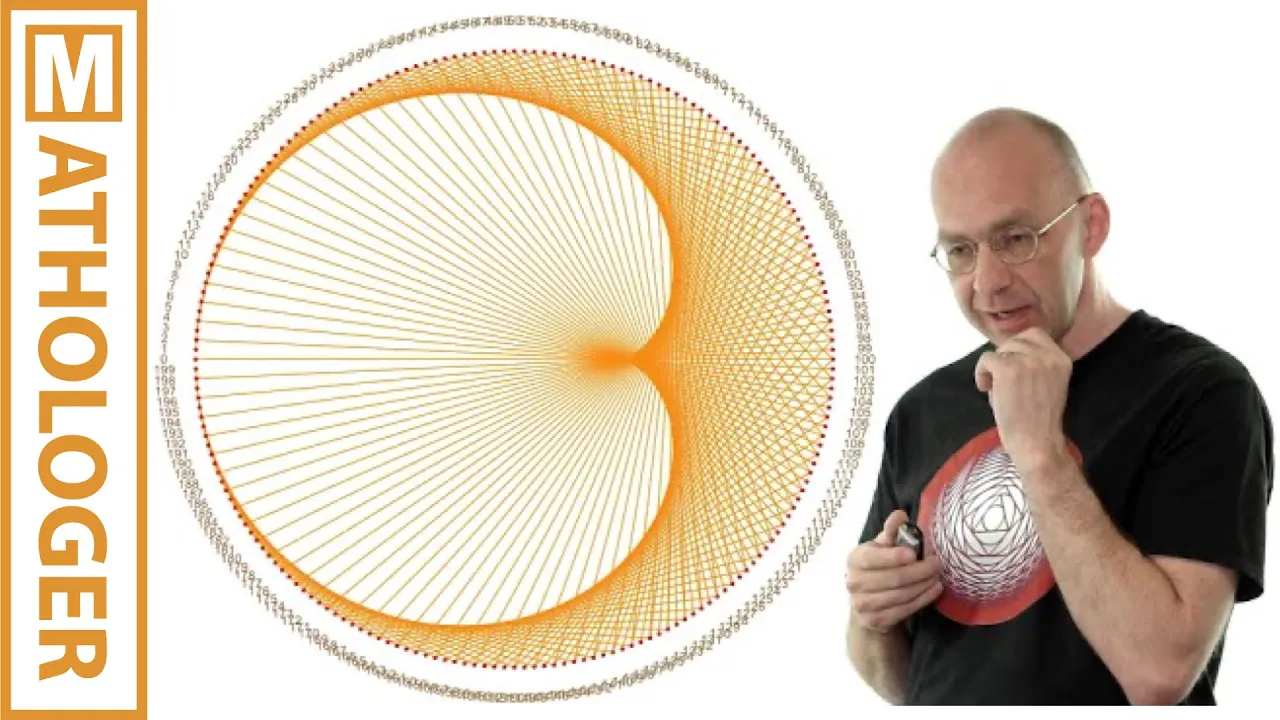
Chords connecting points to their products modulo N follow the law of circular light reflection, explaining why multiplying by n produces an envelope with n-1 petals matching degree-n Mandelbrot sets.

AI-assisted summary of Times Tables, Mandelbrot and the Heart of Mathematics — original source. Check the original for full context.

Source published:

Key ideas

  • Visualizing times tables by drawing chords between point indices and their modular products on a circle naturally traces classical geometric envelopes. (0:05)
  • The envelope formed by the 2 times table is a cardioid, matching the main bulb of the degree-2 Mandelbrot set and the caustic formed by a circular light reflection. (3:05)
  • Higher multipliers generate (n - 1)-petaled epicycloid caustics, such as the 2-lobed nephroid produced by the 3 times table. (5:15)
  • An optical proof confirms that the 2 times table lines directly correspond to light rays emanating from a point source on the circumference reflecting off a circular mirror. (10:00)

Detailed notes

## Background Published on YouTube by the educational channel Mathologer on November 6, 2015, this video explores the surprising mathematical connections hidden within elementary times tables. According to the page description, simple modular multiplication on a circle links directly to the cardioid curve, the iconic Mandelbrot set, and a rich array of visual patterns discovered by mathematician Simon Plouffe.

## TL;DR The video demonstrates how drawing straight chords between points on a circle according to modular multiplication tables reveals intricate, beautiful geometric curves. Multiplying by 2 generates a cardioid, multiplying by 3 yields a two-cusped nephroid, and higher multipliers systematically create envelopes with n - 1 petals that directly match the main bulbs of generalized Mandelbrot fractals. By continuously varying the multiplier, the video highlights mesmerizing morphing behaviors and complex modular symmetries modulo 200. It culminates in an elegant optical proof demonstrating that the chord pattern of the 2 times table represents the exact path of light rays reflecting from an internal point source on the circle's edge.

## Atmosphere & style The presentation is warm, playful, and infectious, structured around an engaging dialogue between Mathologer and his inquisitive co-host Giuseppe. Viewers are treated to a journey of escalating visual wonder, moving from elementary school math to sophisticated fractal geometry and optical physics. The pacing feels relaxed yet deeply curious, punctuated by animated demonstrations and upbeat music that make rigorous geometric insights feel like accessible, joyful discoveries.

## Bulletin - [00:05](https://www.youtube.com/watch?v=qhbuKbxJsk8&t=5s) Visualizing times tables by drawing chords between point indices and their modular products on a circle naturally traces classical geometric envelopes. - [03:05](https://www.youtube.com/watch?v=qhbuKbxJsk8&t=185s) The envelope formed by the 2 times table is a cardioid, matching the main bulb of the degree-2 Mandelbrot set and the caustic formed by a circular light reflection. - [05:15](https://www.youtube.com/watch?v=qhbuKbxJsk8&t=315s) Higher multipliers generate (n - 1)-petaled epicycloid caustics, such as the 2-lobed nephroid produced by the 3 times table. - [10:00](https://www.youtube.com/watch?v=qhbuKbxJsk8&t=600s) An optical proof confirms that the 2 times table lines directly correspond to light rays emanating from a point source on the circumference reflecting off a circular mirror.

## Key takeaways - [00:05](https://www.youtube.com/watch?v=qhbuKbxJsk8&t=5s) Dividing a circle's perimeter into evenly spaced, cyclically labeled points allows times tables to be represented as straight chords between point k and (M * k) mod N. - [01:25](https://www.youtube.com/watch?v=qhbuKbxJsk8&t=85s) Continuing the multiplication rule beyond the initial perimeter count simply retraces existing chords due to modular arithmetic wrapping. - [03:05](https://www.youtube.com/watch?v=qhbuKbxJsk8&t=185s) Increasing the number of perimeter points creates a dense envelope of chords that clearly forms a cardioid for the 2 times table. - [03:35](https://www.youtube.com/watch?v=qhbuKbxJsk8&t=215s) The cardioid appears across mathematics and physics, notably as an epicycloid rolling curve, an optical caustic, and the main bulb of the standard Mandelbrot set. - [05:15](https://www.youtube.com/watch?v=qhbuKbxJsk8&t=315s) The 3 times table produces a nephroid, a two-cusped kidney curve matching the main bulb of the degree-3 Mandelbrot set. - [06:50](https://www.youtube.com/watch?v=qhbuKbxJsk8&t=410s) A general rule dictates that an n times table generates an envelope displaying (n - 1) petals or cusps. - [07:14](https://www.youtube.com/watch?v=qhbuKbxJsk8&t=434s) Varying the multiplier continuously through non-integer values smoothly deforms lower-order envelopes into higher-order multi-petaled curves. - [07:50](https://www.youtube.com/watch?v=qhbuKbxJsk8&t=470s) As the multiplier grows very large, the inner boundary of the multi-petaled figures compresses toward a circle, paralleling high-degree Mandelbrot bulbs. - [08:30](https://www.youtube.com/watch?v=qhbuKbxJsk8&t=510s) Specific multipliers modulo 200 yield distinct geometric configurations, such as a four-lobed cross for 51 and horizontal bands for 99. - [10:00](https://www.youtube.com/watch?v=qhbuKbxJsk8&t=600s) An optical reflection proof establishes that a light ray starting at point 0 and reflecting at point N naturally terminates at 2N, proving why the 2 times table produces a cardioid caustic.

## Detailed walkthrough ### [00:05](https://www.youtube.com/watch?v=qhbuKbxJsk8&t=5s) Translating Times Tables to the Circle

The discussion opens with four complex geometric circle diagrams, challenging the audience to guess what binds them together. When Giuseppe ventures that “they are full of lines” arranged in circles, Mathologer reveals that they are visual representations of times tables. To construct them, one starts with a circle and divides its perimeter into an evenly spaced set of points—choosing $10$ points to start. Points are numbered cyclically beginning at $0$: $0, 1, 2, \dots, 9$. Because the count wraps around the circle, point $0$ also represents $10, 20, 30$; point $1$ represents $11, 21$, and so forth.

```mermaid flowchart LR accTitle: Modular Times Table Construction accDescr: Process of mapping times tables onto evenly spaced points along a circle. A["Choose circle & N points (e.g. N=10)"] --> B["Label points cyclically: 0, 1,..., N-1"] B --> C["Apply multiplier: k -> (M * k) mod N"] C --> D["Draw straight chord between k and (M * k) mod N"] ```

To visualize the $2$ times table, each point number is multiplied by $2$ and connected by a chord to its product: - $2 \times 0 = 0$ (no chord needed) - $2 \times 1 = 2$ (connect $1$ to $2$) - $2 \times 2 = 4$ (connect $2$ to $4$) - $2 \times 5 = 10$, which wraps to point $0$ (connect $5$ to $0$) - $2 \times 6 = 12 \equiv 2$ (connect $6$ to $2$)

Continuing up to $9$ completes the perimeter. If one continues with $2 \times 10 = 20 \equiv 0$ or $2 \times 12 = 24 \equiv 4$, the chords simply retrace those already drawn. Changing the initial point count from $10$ to $11, 12, 13, 14, 15$, and beyond keeps the identical rule intact while dramatically increasing line density.

[03:05](https://www.youtube.com/watch?v=qhbuKbxJsk8&t=185s) The Cardioid and the Mandelbrot Set

When Giuseppe observes that all resulting diagrams display a horizontal symmetry axis, Mathologer assigns finding the exact reason as a homework challenge to the viewers. Increasing the point density reveals a sharp, curved envelope emerging along the chords: the cardioid, named after the Greek root for heart due to its shape.

The cardioid appears across diverse areas of mathematics and physics: - As an epicycloid (rolling curve), formed by tracing a point on the perimeter of a circle rolling smoothly around another circle of identical radius. - As a caustic curve in a conical coffee cup illuminated at an angle by sunlight. - As the central, primary bulb of the iconic Mandelbrot set ($z \mapsto z^2 + c$), where the exponent is precisely $2$. - In audio engineering, where Giuseppe notes that directional cardioid microphones use that pickup geometry to record sound primarily from the front.

As Mathologer remarks regarding the heart-shaped bulb in the complex plane, “The biggest bulb in the Mandelbrot set is a cardioid and the second one is a perfect circle.”

[05:15](https://www.youtube.com/watch?v=qhbuKbxJsk8&t=315s) Higher Times Tables: Nephroids, Caustics, and Petals

Switching from the $2$ times table to the $3$ times table yields an entirely new envelope as the number of perimeter points increases: the nephroid, meaning kidney-shaped. The nephroid mirrors the behaviors of the cardioid across related systems: - It appears as a rolling curve when a circle rolls around another circle of twice its diameter (the rolling circle is half the size of the fixed circle). - It forms the main bulb of the generalized degree-$3$ Mandelbrot set defined by $z \mapsto z^3 + c$. - It appears inside a straight cylindrical coffee cup as a catacaustic, where parallel rays of light reflect off the interior walls and bunch up to trace the kidney curve.

```mermaid flowchart TD accTitle: Times Table to Geometry Mapping accDescr: Relationship between times table multipliers, curve shapes, and Mandelbrot bulb symmetries. subgraph Multiplier2["2 Times Table"] M2["Multiplier 2 / Degree 2"] --> C2["Cardioid (1 petal / heart)"] C2 --> E2["Rolling circle: 1:1 ratio"] end subgraph Multiplier3["3 Times Table"] M3["Multiplier 3 / Degree 3"] --> C3["Nephroid (2 petals / kidney)"] C3 --> E3["Rolling circle: 1:2 ratio"] end subgraph MultiplierN["N Times Table"] MN["Multiplier n / Degree n"] --> CN["(n - 1) Petals"] end ```

Moving to the $4$ times table produces a three-petaled caustic corresponding to $z \mapsto z^4 + c$, and the $5$ times table yields four petals. Giuseppe deduces the general rule: “So the number of petals is $n - 1$?” Mathologer confirms that this rule holds consistently as the multiplier grows.

[07:14](https://www.youtube.com/watch?v=qhbuKbxJsk8&t=434s) Continuous Transitions and Modulo Arithmetic Patterns

Instead of jumping between whole-number multipliers ($2 \to 3 \to 4 \to 5$), Mathologer varies the multiplier continuously in small decimal increments ($2.1, 2.2, 2.3, \dots, 3.0$), smoothly deforming the single-cusp cardioid into the two-cusp nephroid. When the multiplier increases rapidly toward higher values, the multi-petaled central figure eventually compresses toward a circle, identical to the limiting behavior of high-degree Mandelbrot bulbs.

Beyond this petal phase, stepping through dense configurations modulo $200$ reveals intricate geometric webbing: - Multiplying by $33$ and $34 \pmod{200}$ creates delicate nested whorls. - The $51$ times table $\pmod{200}$ forms an orthogonal four-lobed cross, stemming from the fact that $51 \approx \frac{1}{4} \times 200$. - The $99$ times table $\pmod{200}$ collapses into an alternating, bipartite horizontal banded pattern because $99 \approx \frac{1}{2} \times 200$.

Mathologer emphasizes that this circular chord construction is a direct visualization of modular arithmetic: “What we're doing here is the times table modulo 200.”

[10:00](https://www.youtube.com/watch?v=qhbuKbxJsk8&t=600s) Optical Proof: Why the 2 Times Table Forms a Cardioid

Mathologer concludes with an intuitive optical proof linking the circle-chord construction to light reflection. Consider a circular mirror with an internal point light source situated on its circumference at point $0$. Rays emanate from this single point in all directions and bounce off the circle according to the law of reflection (angle of incidence equals angle of reflection).

```mermaid flowchart LR accTitle: Optical Proof of Cardioid Generation accDescr: Geometric diagram of light ray reflection off a circle perimeter leading to the 2 times table. A["Light source at point 0"] -->|"Travels arc length N"| B["Reflection point N"] B -->|"Reflects at equal angle"| C["Endpoint on perimeter 2N"] C -.->|"Envelope forms"| D["Cardioid Caustic"] ```

When a ray travels from source $0$ along the circumference to an arbitrary point $N$, its incoming angle relative to the circle's normal equals its outgoing reflection angle. Drawing the diameter through $N$ bisects the figure symmetrically: the reflected ray strikes the perimeter at an equal angular arc length past $N$. Traveling an arc distance of $N$ from $0$, and then an equal distance of $N$ past the bounce, lands precisely at point $2N$.

Mathologer emphasizes why the connection is immediate: “And so it's pretty clear that when you do the 2 times thing you get that reflected ray, you know, in the picture.” Every chord drawn in the $2$ times table is an actual light ray reflecting from the source, and their collective envelope naturally forms the caustic cardioid. The video finishes with a smooth animation tracking the continuous progression of these modular multiplication patterns.

## Notable quotes > [03:05](https://www.youtube.com/watch?v=qhbuKbxJsk8&t=185s) The biggest bulb in the Mandelbrot set is a cardioid and the second one is a perfect circle. — Mathologer

## Mentioned Mathologer, Giuseppe, Simon Plouffe, Mathias Lengler, Wolfram Research, Wolfram Alpha, Mathematica, Gunnar Olsen, Mandelbrot set

## Video description NEW (Christmas 2019). Two ways to support Mathologer Mathologer Patreon: https://www.patreon.com/mathologer Mathologer PayPal: paypal.me/mathologer (see the Patreon page for details)

The good old times tables lead a very exciting secret life involving the infamous Mandelbrot set, the ubiquitous cardioid and a myriad of hidden beautiful patterns. Time for the Mathologer to go on a serious fact-finding mission.

For those of you who’d like to play around a bit with the stunning times table diagrams that we discuss in this video, download the .cdf file http://www.qedcat.com/cardioid.cdf and open it with the free cdf player which you can download from Wolfram Research (the people behind Wolfram Alpha and Mathematica). If you have access to Mathematica you can also open my .cdf file in Mathematica and play with the code.

For those of you who are looking for a bit of a challenge, ponder this: 1) Starting with the fact that the nephroid arises from parallel rays being reflected inside a cylindrical coffee cup, try to convince yourself that the 3 times table really does produce the nephroid (some really neat geometry at work here, very similar to the argument for the cardioid that I talk about at the end of the video). (Added 8 November 2015 check out the proof at http://www.qedcat.com/nephroid_proof.pdf ) 2) Why do the diagrams for all the times tables have a horizontal mirror symmetry? 3) Try to explain the pretty patterns corresponding to the 51 and 99 times tables modulo 200 that I display in the video (around the 9:30 mark). 4) (For those of you with a very strong math background) Try to figure out why the cardioid shows up in the Mandelbrot set.

The discovery of the stunning patterns that I discuss in this video is due to the mathematician Simon Plouffe. Check out this article http://tinyurl.com/o2hbtsa and his website http://plouffe.fr for other stunning visualisations using modular arithmetic.

Quite a few animations have been contributed by various people and linked to in the comments: Here is one of the nicest ones by Mathias Lengler: https://mathiaslengler.github.io/TimesTableWebGL/

Enjoy!

P.S.: The music we are playing at the end is called Shoulder Closure by Gunnar Olsen. It's part of the free YouTube music library. A really nice piece , isn't it?

[Source](https://www.youtube.com/watch?v=qhbuKbxJsk8)

中文简报

圆周乘法表勾勒出光学焦散线与曼德博集球体 在模 N 下连接各点与其乘积的弦遵循圆反射定律,解释了为何乘以 n 会生成具有 n-1 个花瓣且与 n 次曼德博集相匹配的包络线。 该视频展示了根据模乘法表在圆周各点之间绘制直线弦,如何揭示出复杂而优美的几何曲线。乘以 2 会生成心脏线,乘以 3 会产生具有两个尖角的神 kidney 线(肾脏线),而更大的乘数则有规律地创造出带有 n - 1 个花瓣的包络线,这些包络线与广义曼德博分形的主球体直接吻合。通过连续改变乘数,视频突显了模 200 下令人着迷的形变特征与复杂的模对称性。视频最后给出了一个优雅的光学证明,表明 2 倍乘法表的弦线图案精确代表了光线从圆周边缘上的内部点光源反射的路径。 通过在圆周上各点索引与其模乘积之间绘制弦来可视化乘法表,会自然勾勒出经典的几何包络线。 (0:05) 2 倍乘法表形成的包络线是一条心脏线,与 2 次曼德博集的主球体以及圆反射形成的焦散线相匹配。 (3:05) 更大的乘数会生成具有 (n - 1) 个花瓣的外摆线焦散线,例如 3 倍乘法表产生的双叶肾脏线。 (5:15) 一项光学证明证实,2 倍乘法表的线条直接对应于从圆周上某一点光源发出并在圆形镜面上反射的光线。 (10:00)

Reading summary

Visualizing elementary times tables on a divided circle reveals modular arithmetic structures that directly correspond to classical curves, optical caustics, and the bulbs of the Mandelbrot set, according to Mathologer. Mapping Modular Multiplication to Circular Chords (0:05) The construction begins by dividing the circumference of a circle into an evenly spaced set of points labeled cyclically from $0$ to $N - 1$. Under this cyclic labeling, points wrap around so that $0$ also represents multiples of $N$, such as $10, 20$, and $30$ when $N = 10$. To plot a given times table with multiplier $M$, a straight chord is drawn from each point $k$ to the resulting product $(M \times k) \pmod N$. For the $2$ times table on $10$ points, chords connect $1$ to $2$, $2$ to $4$, $5$ to $0$ (since $2 \times 5 = 10 \equiv 0$), and $6$ to $2$ (since $2 \times 6 = 12 \equiv 2$). Mathologer notes that while increasing $N$ to larger values preserves the identical mathematical rule, the higher line density transforms the discrete chords into continuous envelopes. Emergence of Cardioid and Nephroid Envelopes (3:05) As point density increases, chords for the $2$ times table envelope a heart-shaped curve known as the cardioid. This same curve arises as an epicycloid traced by a circle rolling around another circle of identical radius, as a caustic formed by sunlight in a conical coffee cup, as the directional pickup pattern of cardioid microphones, and as the central, primary bulb of the degree-$2$ Mandelbrot set ($z \mapsto z^2 + c$). Transitioning to the $3$ times table produces a kidney-shaped nephroid curve. The nephroid mirrors the cardioid's universal properties: it corresponds to a circle rolling around a fixed circle of twice its diameter, appears as a catacaustic in a cylindrical coffee cup reflecting parallel light rays, and forms the main bulb of the degree-$3$ Mandelbrot set ($z \mapsto z^3 + c$). For any integer multiplier $n$, the resulting figure produces $n - 1$ petals, matching the symmetry of higher-degree Mandelbrot bulbs ($z \mapsto z^n + c$). Continuous Multipliers and High-Modulo Webbing (7:14) Varying the multiplier through continuous decimal increments rather than whole numbers smoothly morphs the curves, such as deforming the single-cusped cardioid into the double-cusped nephroid as values step from $2.0$ to $3.0$. At very high multipliers, the inner petal structure compresses into a circle, reflecting the limiting behavior of high-degree Mandelbrot bulbs. Exploring modular configurations under a fixed modulus of $200$ generates distinct geometric patterns based on fractional relationships with the modulus. For example, multipliers $33$ and $34 \pmod{200}$ produce nested whorls, while multiplier $51$ forms an orthogonal four-lobed cross because $51 \approx \frac{1}{4} \times 200$. When multiplying by $99 \pmod{200}$, the pattern collapses into an alternating horizontal banded layout because $99 \approx \frac{1}{2} \times 200$. Mathologer points out that these webs are direct visual demonstrations of modular arithmetic. Optical Proof for the Cardioid Envelope (10:00) Mathologer establishes a geometric proof for the $2$ times table by modeling a circular mirror containing an internal light source on its circumference at point $0$. By the law of reflection, any light ray striking the boundary at point $N$ reflects at an angle equal to its angle of incidence relative to the circle's normal. A diameter drawn through the bounce point $N$ bisects the incident and reflected paths symmetrically. Because the ray travels an arc length of $N$ from point $0$ to the boundary, it must travel an equal angular arc length of $N$ beyond the bounce point, landing exactly at perimeter coordinate $2N$. Consequently, every chord drawn in the $2$ times table represents a physical light ray reflected from a single boundary source, proving that the caustic envelope formed by the reflections is identical to the modular chord envelope. The presentation demonstrates that elementary arithmetic operations, when projected cyclically onto a circle, naturally unify modular arithmetic with classical rolling curves, fractal geometry, and the physics of optical reflections. Mathologer leaves viewers with the open challenge of formally proving why the chord diagrams preserve a horizontal axis of symmetry across point counts.

精炼阅读摘要

Mathologer阐述了将基础乘法表映射至圆周模运算的几何构造法,揭示出弦线包络与心脏线、肾脏线、光学焦散曲线以及曼德博集合(Mandelbrot set)分形结构之间的深层数学联系。 圆周模运算与乘法表几何映射 (0:05) 该构造始于将圆周等分为N个点并从0至N-1循环编号。当计数绕圆周超出范围时采用模算术折返,例如在N=10的设定下,0号点同时代表10、20、30,1号点代表11与21。为了可视化特定乘数M的乘法表,每个起始点k通过直线弦连接至其乘积点(M × k) mod N。 以2倍乘法表为例,2 × 1连至2,2 × 2连至4;当计算2 × 5 = 10时折返连至0,2 × 6 = 12则等价连接至2。若将初始点数从10持续增加至11、12直至更高密度,连线规则保持不变,但弦线密度显著提升,所有图形均呈现明显的水平对称轴。 心脏线与曼德博集合的跨领域共性 (3:05) 当2倍表的圆周点数极度密集时,弦线边缘会显现出清晰的弯曲包络线——心脏线(Cardioid)。Mathologer指出,这一几何构型广泛存在于数学与物理学分支中。在运动几何学中,它表现为等半径圆沿另一个固定圆无滑动滚动时外圆周上一点轨迹形成的外摆线;在光学中,它是斜向光照下圆锥形咖啡杯内形成的焦散曲线;在音频工程中,则对应指向性麦克风的心形拾音极性图。 此外,该形状直接关联复动力学系统。在定义为z ↦ z² + c的经典曼德博集合中,复平面上最大的主球体正是一个标准的心脏线,而其相邻的第二大球体则是一个正圆,其指数2与圆周乘数2精确对应。 高阶乘数规律、肾脏线与花瓣包络 (5:15) 将乘数切换为3倍表后,密集的弦线演变出具有双凹折的肾脏线(Nephroid)。肾脏线同样具备多重物理与几何对应:它是一半直径的圆沿固定圆滚动生成的外摆线;由平行光照射直圆柱咖啡杯内壁反射形成的会聚焦散线产生;并且构成了高阶复映射z ↦ z³ + c对应曼德博集合的主体结构。 随着乘数递增,4倍表与5倍表分别产生对应z ↦ z⁴ + c和z ↦ z⁵ + c的三瓣与四瓣焦散包络。Giuseppe据此归纳出通项规则:乘数为n时形成的中央花瓣数为n - 1,Mathologer确认该递推规律持续成立。当乘数以小数微调平滑过渡时,单尖点的心脏线会连续形变为双尖点肾脏线;而在超高乘数极限下,多瓣图案最终压缩趋近于圆,与高次曼德博集合的收敛特性一致。 模200离散结构的共振与编织图案 (7:14) 除了连续花瓣形变外,步进探索以200为模数的离散高倍乘法表展现出复杂的几何织网现象。例如,以模200计算33倍和34倍表时,弦线会产生精细的嵌套涡卷纹理。 由于51接近200的四分之一(51 ≈ 1/4 × 200),51倍表在圆内收敛为垂直对称的正交四叶十字星;而99由于接近200的二分之一(99 ≈ 1/2 × 200),99倍表塌陷为黑白交错的二分水平带状条纹。Mathologer强调,这类图形是离散模运算(Times table modulo 200)内部对称性与分数共振的直观空间呈现。 圆镜反射光学证明与焦散形成机制 (10:00) Mathologer通过圆镜内部光线反射模型给出了2倍表形成心脏线的几何光学证明。假设圆镜内壁的0号点处放置有点光源,光线向圆周所有方向辐射,并遵循入射角等于反射角的光学反射定律在圆壁上反弹。 当一条光线从光源0号点出发沿圆周行经弧长N到达圆周上的反弹点N时,过点N的圆直径构成反射面的法线对称轴。基于对称反射,反射光线必定在跨越点N后沿着圆周继续行进相同的角弧长距离N,最终落点精确位于圆周编号2N处。因此,2倍乘法表所绘制的每一条弦线,本质上都是点光源0发射并经圆周单次反射的实际物理光线,大量反射光线汇聚包络自然构成了光学焦散心脏线。 该讲解证明了基础圆周模算术乘法表并非单纯的代数练习,而是将平面几何弦线包络、几何光学反射定律、摆线几何学以及复数分形动力学结构内在统一起来的直观数学载体。

Detailed notes — zh

## Background 该视频由数学科普频道 Mathologer 于 2015 年 11 月 6 日发布在 YouTube 平台上。视频简介指出,看似简单的小学乘法表其实深藏玄机,不仅能通过几何连线生成曼德博集合(Mandelbrot set)与心脏线(cardioid),还能在模算术的变换下展现出各种惊艳的隐藏对称图案。 ## TL;DR 视频展示了在圆周上利用模算术和乘法表连线所涌现出的惊人几何之美:当乘数为 2 时,大量密集的弦交织出标准的心脏线;将乘数调整为 3 时,则生成双瓣的肾形线,且花瓣数量与广义曼德博集合的核心形状存在直接对应。Mathologer 随后探讨了在固定点数模运算下乘数渐变所激发的对称星形与晶体结构,并最终通过圆内光线反射定律给出了严谨的几何证明,阐明反射光线跨越的双倍圆弧与“2的乘法表”在本质上完全等价。 ## Atmosphere & style 整个视频充满着探索未知数学奇观的兴奋与智趣,Mathologer 与搭档 Giuseppe 之间轻松幽默的互动营造出一种自然而热切的探讨氛围。叙述节奏层层递进,从最质朴的小学连线规则逐步升华为高阶几何与分形理论,带来强烈的智力愉悦感。片尾伴随着舒缓优雅的背景音乐呈现乘数渐变动画,使严密的数学逻辑在纯粹的视觉美学中达成了诗意般的共鸣。 ## Bulletin - [00:05](https://www.youtube.com/watch?v=qhbuKbxJsk8&t=5s) 在圆周上均分点并根据乘法表规则(如将刻度 k 与 2k 连线)进行几何绘制,当点数增多时,弦的包络线会自动涌现出标准的心脏线(Cardioid)。 - [05:15](https://www.youtube.com/watch?v=qhbuKbxJsk8&t=315s) 乘法表与广义曼德博集合(Mandelbrot Set)存在精确对应关系:n 的乘法表会生成具有 n-1 个花瓣的外摆线结构,分别对应复数迭代公式中指数为 n 的集合核心轮廓。 - [08:11](https://www.youtube.com/watch?v=qhbuKbxJsk8&t=491s) 在固定点数的模算术(如模 200)体系下,高阶乘数会产生复杂的自相似星形与晶体图案,其对称性主要由乘数与模数的比例关系决定。 - [09:55](https://www.youtube.com/watch?v=qhbuKbxJsk8&t=595s) 利用圆周内壁点光源的反射几何可以严格证明:入射光线从 0 到 N 碰撞后,由于入射角等于反射角,反射光线必落于 2N,因此所有反射光线的包络线与 2 倍乘法表完全等价并构成心脏线。 ## Key takeaways - [00:05](https://www.youtube.com/watch?v=qhbuKbxJsk8&t=5s) 看似繁复的分形与几何图案,本质上均源自小学乘法表在模 N 圆周上的简单连线映射。 - [00:05](https://www.youtube.com/watch?v=qhbuKbxJsk8&t=5s) 以 2 的乘法表为例,在圆周上连接 k 与 (2k) mod N 的弦,随着点数增加会密集包络成一条清晰的心脏线。 - [00:05](https://www.youtube.com/watch?v=qhbuKbxJsk8&t=5s) 心脏线普遍存在于几何外摆线、咖啡杯内的焦散光斑、指向性麦克风的拾音图谱以及曼德博集合的主体结构中。 - [05:15](https://www.youtube.com/watch?v=qhbuKbxJsk8&t=315s) 当乘数增加到 3 时,圆内弦的包络线会从心脏线变为具有两个凹瓣的肾形线(Nephroid)。 - [05:15](https://www.youtube.com/watch?v=qhbuKbxJsk8&t=315s) 圆柱形咖啡杯在平行光照射下产生的焦散线同样是肾形线,与 3 的乘法表生成的几何形状完全一致。 - [05:15](https://www.youtube.com/watch?v=qhbuKbxJsk8&t=315s) 乘数 n 与花瓣数量存在通用规律:n 的乘法表对应生成 n-1 个花瓣的花形外摆线。 - [05:15](https://www.youtube.com/watch?v=qhbuKbxJsk8&t=315s) 广义曼德博集合在迭代指数为 n 时,其中心轮廓正是由对应 n 倍乘法表所产生的外摆线构成的。 - [05:15](https://www.youtube.com/watch?v=qhbuKbxJsk8&t=315s) 将乘数以实数步长连续调节(如 2.0 递增至 3.0),可动态观察到心脏线单瓣舒展裂变为两瓣肾形线的平滑演化。 - [08:11](https://www.youtube.com/watch?v=qhbuKbxJsk8&t=491s) 在固定模数(如模 200)下,高阶乘数展示出丰富晶体图案;乘数接近模数的特定分数倍(如 51 接近 1/4、99 接近 1/2)时会诱导出高度规整的对称星形。 - [09:55](https://www.youtube.com/watch?v=qhbuKbxJsk8&t=595s) 基于圆的光学反射几何证明:圆周上从刻度 0 射向刻度 N 的光线经镜面反射后,必精确击中刻度 2N。 - [09:55](https://www.youtube.com/watch?v=qhbuKbxJsk8&t=595s) 由于光线反射轨迹与 2 倍乘法表连线几何等价,光学上形成的焦散反射包络线直接证明了 2 倍乘法表必然形成心脏线。 ## Detailed walkthrough ### [00:05](https://www.youtube.com/watch?v=qhbuKbxJsk8&t=5s) 用乘法表在圆周上连线:心形线的初现 视频开场,Mathologer 向观众展示了四幅看起来极为繁复优美的几何图案,并提出一个问题:这些图像有什么共同点?搭档 Giuseppe 观察后回答道:“它们布满了线条,而且都在一个圆圈里。”(“They are full of lines, they are in a circle.”)Mathologer 随即揭晓了令人意想不到的答案:这些其实都是小学乘法表的几何可视化图像。 为了解释这种图像的生成逻辑,Mathologer 详细演示了具体的绘图规则: 1. 先画一个圆,在圆周上选取任意数量的点;以初始值 10 为例,将圆周等分为 10 个均匀分布的刻度。 2. 从 0 开始顺时针依次编号为 0 到 9;当数到 10 时,它刚好回到起点 0 的位置,因此这个点既代表 0,也代表 10、20 等。同样地,1 代表 1、11、21,依此类推。 3. 接着以“2的乘法表”(Two Times Table)为例进行连线:从 0 出发,$2 \times 0 = 0$,点留在原地不连线;$2 \times 1 = 2$,将 1 与 2 连成线段;$2 \times 2 = 4$,连接 2 与 4;$2 \times 5 = 10$,由于 10 与 0 位于同一点,因此连接 5 与 0;$2 \times 6 = 12$,对应刻度 2,连接 6 与 2。 4. 随着乘法继续计算到 9,连线已绕圆一周。即便继续算到 $2 \times 12 = 24$(对应刻度 4)或 $2 \times 13 = 26$(对应刻度 6),所有新的连线都只会与前面画过的线段完全重合。 当圆周上的刻度点数逐渐增多(从 10 增加到 11、12、13、14、15 直至更高)时,原本稀疏的直线交织成了密集的包络线,一条清晰的优美曲线在圆中浮现出来。Giuseppe 此时注意到一个对称特征,Mathologer 便把这个问题留给观众:“伙计们,在评论区找出原因,告诉我们为什么这里有一条水平对称轴。”(“Guys figure it out in the comments, tell us why there is a horizontal symmetry axis.”) ```mermaid flowchart LR accTitle: 乘法表圆周连线算法 accDescr: 展示如何在模 N 圆周上通过两倍乘法连接各点生成几何包络线 subgraph 划分与标号 A["在圆周均匀分布 N 个点"] --> B["从 0 到 N-1 编号<br/>(模 N 循环记数)"] end subgraph 乘法映射 B --> C["对每个点 k 计算:<br/>目标点 = (2 × k) mod N"] end subgraph 绘制与涌现 C --> D["在圆内绘制线段:<br/>k 连向 (2 × k) mod N"] D --> E["当点数 N 很大时<br/>弦的包络线涌现出心形线"] end ``` - 该奇妙曲线在数学上被称为**心脏线**(Cardioid,词根与心脏病学 Cardiology 相同,意为“心形”)。 - 心脏线出现在数学与现实世界的许多场景中: - **滚动圆轨迹**:一个圆沿着另一个等半径的固定圆外侧无滑动滚动时,圆周上某一定点所描绘出的外摆线轨迹即为心脏线。 - **咖啡杯焦散线**:光线斜射入圆台形(锥形)咖啡杯内壁时,反射光交织出的光斑边界也是心脏线。 - **曼德博集合(Mandelbrot Set)**:曼德博集合中最大的一块主体部分(Main Bulb)正是一条精确的心脏线,而紧随其后的第二大球形区域则是一个完美的圆。 - **指向性麦克风**:Giuseppe 提到录音行业中有一种“心形指向麦克风”(Cardioid Microphone),其拾音范围与灵敏度图谱呈现出标准的心形。 --- ### [05:15](https://www.youtube.com/watch?v=qhbuKbxJsk8&t=315s) 从肾脏线到多瓣花:乘数与曼德博集的完美对应 Mathologer 接下来将乘数从 2 换成 3,演示“3的乘法表”(Three Times Table)。在同样以 10 个点起步并逐步增加点数后,圆内浮现出一条具有两个凹陷瓣状结构的新曲线——**肾形线**(Nephroid,词根意为“肾脏”): - **外摆线生成**:一个圆在另一个圆外侧滚动,当滚动圆的半径恰好是固定圆半径的一半时,圆周上的点所描绘出的轨迹便是肾形线。 - **直壁咖啡杯中的反光**:若换成圆柱形(直壁)咖啡杯,平行光从一侧射入,光线在杯壁发生镜面反射后聚集形成的“焦散线”(Catacaustic)正是肾形线。 - **广义曼德博集合的对应**:在标准曼德博集合迭代公式中,变量的指数为 2(对应 2 的乘法表与心脏线);当把复数迭代公式中的指数改为 3 时,广义曼德博集合的核心主体区域便变成了肾形线。 继续增加乘数,规律迅速展现:4 的乘法表会生成带有 3 个花瓣的花形曲线,对应的广义曼德博集合指数为 4;5 的乘法表则产生 4 个花瓣,指数为 5。Giuseppe 立即总结道:“所以花瓣的数量就是 $n - 1$ 吗?”(“So the number of petals is n-1?”)Mathologer 证实了这一规律。 随后,Mathologer 演示了将乘数进行连续动态调节的效果:乘数不再以整数跳跃,而是以 0.1 为步长连续增加(2.1、2.2、2.3 直至 3.0)。屏幕上清晰地展现出单个心瓣的心脏线平滑舒展裂变、最终过渡为两瓣肾形线的全过程。随着乘数不断趋向无穷大,广义曼德博集合的中心花瓣愈发密集,整体趋近于一个光滑的圆。 --- ### [08:11](https://www.youtube.com/watch?v=qhbuKbxJsk8&t=491s) 模运算中的隐藏结构与高阶图案 当乘数继续往上推移、花瓣密集到看似消失之后,画面并没有退化为一片混沌,而是闪现出大量更加奇妙、具有高度自相似性的对称晶体结构。Mathologer 强调,若是一帧一帧慢放,会发现极为惊艳的数学构造。 为了深入分析这些结构,Mathologer 固定圆周点数为 200,并探讨了不同乘数下的表现。在数学上,这一过程被称为“模 200 的乘法表”(Times Table modulo 200),即**模算术**(Modular Arithmetic)。在此设定下: - **2 的乘法表**:展现基础的心脏线。 - **34 的乘法表**:展现出复杂的对称多叶结构。 - **51 的乘法表**:51 非常接近 200 的四分之一($200 \times \frac{1}{4} = 50$),画面呈现出明显的四重对称星形图案。 - **99 的乘法表**:99 非常接近 200 的二分之一($200 \times \frac{1}{2} = 100$),画面呈现出高度对称的二重双向辐射图案。 Mathologer 提示,乘数与模数之间的比例关系正是主导这些神秘高阶几何图案构成的关键数学线索。 --- ### [09:55](https://www.youtube.com/watch?v=qhbuKbxJsk8&t=595s) 光线反射与 2 倍乘法:心脏线成因的几何证明 在展示了诸多现象后,Mathologer 着手给出一个纯粹且优雅的几何解释:为什么 2 的乘法表一定会精确画出一条心脏线? 他在大学期间曾通过光学反射推导过心脏线的方程。设想一个圆周,在圆周边缘的某个点放置一个点光源,光线向圆内所有方向射出。当某一束光线射到圆壁上某点时,根据光学反射定律,入射角等于反射角。 Mathologer 通过圆的几何性质给出了核心证明: 1. 设点光源所在位置为刻度 0。 2. 光线从 0 出发,沿着弦射向圆周上的碰撞点 $N$。 3. 从圆心向点 $N$ 作一条法线(即半径),反射光线以相同的角度反射出去,落到圆周上的另一点。 4. 由于法线两侧的入射角与反射角相等,圆内构成的对称几何关系使得从 0 到 $N$ 所跨越的圆弧长度,与从 $N$ 到反射落点所跨越的圆弧长度完全相等。 5. 因此,反射光线的落点在圆周刻度上恰好是 $N + N = 2N$。 6. 这意味着,每一条在圆壁上反射的光线,在几何上都完全等价于将刻度 $N$ 与刻度 $2N$ 相连的弦。Mathologer 总结道:“所以很显然,当你做‘乘以 2’的操作时,你得到的就是图像中的那条反射光线。”(“And so it's pretty clear that when you do the 2 times thing you get that reflected ray, you know, in the picture.”) 7. 既然所有反射光线的包络线在光学上构成心脏线,那么 2 的乘法表在圆周上连接 $N$ 与 $2N$ 的所有弦,自然就包络出了这条标准的心脏线。 视频的最后,Mathologer 伴随着 Gunnar Olsen 的背景音乐 *Shoulder Closure*,为观众播放了一段平滑、舒缓的动态演化影像,完整展现了乘数渐变过程中各类几何图形与分形图案不断交融绽放的视觉盛宴。 ## Mentioned Mathologer, Giuseppe, Simon Plouffe, Mathias Lengler, Gunnar Olsen, Mandelbrot Set, Cardioid, Nephroid, Wolfram Research, Mathematica, Wolfram Alpha, Shoulder Closure ## Video description NEW (Christmas 2019). Two ways to support Mathologer Mathologer Patreon: https://www.patreon.com/mathologer Mathologer PayPal: paypal.me/mathologer (see the Patreon page for details) The good old times tables lead a very exciting secret life involving the infamous Mandelbrot set, the ubiquitous cardioid and a myriad of hidden beautiful patterns. Time for the Mathologer to go on a serious fact-finding mission. For those of you who’d like to play around a bit with the stunning times table diagrams that we discuss in this video, download the .cdf file http://www.qedcat.com/cardioid.cdf and open it with the free cdf player which you can download from Wolfram Research (the people behind Wolfram Alpha and Mathematica). If you have access to Mathematica you can also open my .cdf file in Mathematica and play with the code. For those of you who are looking for a bit of a challenge, ponder this: 1) Starting with the fact that the nephroid arises from parallel rays being reflected inside a cylindrical coffee cup, try to convince yourself that the 3 times table really does produce the nephroid (some really neat geometry at work here, very similar to the argument for the cardioid that I talk about at the end of the video). (Added 8 November 2015 check out the proof at http://www.qedcat.com/nephroid_proof.pdf ) 2) Why do the diagrams for all the times tables have a horizontal mirror symmetry? 3) Try to explain the pretty patterns corresponding to the 51 and 99 times tables modulo 200 that I display in the video (around the 9:30 mark). 4) (For those of you with a very strong math background) Try to figure out why the cardioid shows up in the Mandelbrot set. The discovery of the stunning patterns that I discuss in this video is due to the mathematician Simon Plouffe. Check out this article http://tinyurl.com/o2hbtsa and his website http://plouffe.fr for other stunning visualisations using modular arithmetic. Quite a few animations have been contributed by various people and linked to in the comments: Here is one of the nicest ones by Mathias Lengler: https://mathiaslengler.github.io/TimesTableWebGL/ Enjoy! P.S.: The music we are playing at the end is called Shoulder Closure by Gunnar Olsen. It's part of the free YouTube music library. A really nice piece , isn't it? [Source](https://www.youtube.com/watch?v=qhbuKbxJsk8)

Source quotes

[3:05] Mathologer: The biggest bulb in the Mandelbrot set is a cardioid and the second one is a perfect circle.

Original transcript

[0:05] ok so to start off I've got 4 images for you. [0:10] Quick question what do all of them have in common. Well, I would be [0:25] very surprised if you guess this one here. (Giuseppe) They are full of lines. (M) They are full of lines, they are in a circle. [0:31] But actually they are pictures of times tables. I better explain [0:38] this. So to get these pictures what you do is you start with a circle and [0:43] then you pick a random number. And we just choose something nice to start with, a 10. [0:49] Then we put 10 points on the on the perimeter here [0:54] equally spaced and then we label them with 1,2,3,4,5,6,7. Actually, let's start with 0--0123456789 10 [1:06] 10 we also want, so we kind of put it right there again. So that's also 10, that's also 11 [1:10] 12 13 14 15 and so on. And then again, and so on. So this guy here stands for 1, 11, 21 and so on. [1:20] And now we're going to do the two times table and we'll [1:27] start with 0. So 2 times 0 is 0, same thing, so we don't do anything. [1:34] OK, two times 1 is 2. So we connect the 1 to the 2. Then 2 times 2 is 4, connect the 2 to the 4 and we keep on going, pretty [1:44] obvious. Now 2 times 5 is 10 and remember 10 is also over there so we connect that guy up. [1:54] And then 2 times 6 is 12 which is also the 2 and we just [2:00] keep on going like this [2:02] okay and then at 9 you pretty much gone all the way around now you could [2:08] go on so for example could now do 2 times 10 and 2 times 11 and 2 times 12 and draw in those [2:14] connections but actually the connections are going to be exactly the ones that we've drawn [2:18] before. Just to illustrate, let's just go up to 2 [2:22] times 12 is 24 which corresponds to the 4 and that connection is already there. [2:28] 2 times 13 is 26, and we've already got that. Of course we made a choice at the beginning that 10 [2:42] If you change that 10 to anything else [2:45] well the picture changes but pretty much everything I said stays true. [2:49] So for example if you switch from 10 to 11 we get this guy here here. And then 12 [2:56] 13 14 15 and let's just see what happens. [3:05] (Giuseppe) Is there a reason why the diagrams have a horizontal symmetry axis. (M) yep yep yep yep yep there's a reason and let us give this as homework. [3:19] Guys figure it out in the comments, tell us why there is a horizontal symmetry axis. Of course, what's much [3:24] more interesting is that curve that somehow magically materializes when you [3:29] up the number that we chose at the beginning and actually just highlight it a bit. [3:35] This strange curve got a name and pops up all over mathematics, it's called the cardioid [3:40] like in cardiology and means heart. So it's like a mathematical heart curve. It comes up in all kinds of places. I'll just show you [3:48] a few. Ok so for example you can have it as a rolling curve rule one [3:54] circle around another circle and just see what happens to one of the points on [3:59] the boundary of the rolling circle and what it does is it traces the cardioid. [4:05] Now where else can you see it? Well sometimes you can see it in your coffee cup. If you've got a conical [4:11] coffee cup like this and the Sun is in the directions of one of those green lines [4:16] in the coffee cup [4:17] then we can also see it. Where else? Right there in the Mandelbrot set so the [4:27] biggest bulb in the Mandelbrot set is a cardioid and the second one is a perfect circle. [4:31] Now this would be a good one [4:35] to figure out why why is this guy a cardioid. Just chase this down [4:38] somewhere. Now just for those people who know something about the stuff, that's the equation that we use [4:46] to make up the Mandelbrot set and there is a 2 in there. That's important [4:50] We just had the two times table. Let's keep going now [4:54] (Giuseppe) One more thing about the cardioid shape. As a video producer I know that there is a microphone called cardioid microphoes [5:05] and that is because they pick up the sound in that area, from that direction. (M) Okay maybe we do another video on this. [5:15] Now instead of doing the two times table we can do the the three times table. What we [5:22] get is this pattern here for initial our choice 10 and then I just up up the [5:27] numbers and what do we get? Another curve, another very famous curve. This is called the nephroid which means kidney. [5:36] It's also a rolling curve, here the circle that is rolling is half the size of the other one. [5:44] It's also in a generalized Mandelbrot set. Remember before we [5:51] head an exponent of 2. Now we're talking about the three times table we [5:56] change the exponent to 3 and you actually get the main bulb here being the nephroid. [6:03] We also get it in the coffee cup. This time we need a straight [6:05] straight coffee cup and the light rays come in from one side. [6:13] So they come in straight like this and then they of bounce around inside [6:16] the cup and and make up this curve. Actually this way of making up a curve is called a catacaustic in mathematics. [6:25] What else have we got. Four times you can see a pattern now. Four times gets you three petals. [6:32] Before we had three times and so two petals and all these other [6:38] things that we've highlighted they work too. Here the the exponent has gone up to to 4 [6:44] in the generalized Mandelbrot set. Here we've got the rolling curve happening again. [6:48] And then just for good measure just one more guy here. That's the 5. It gets four [6:54] petals and we've got the Mandelbrot set here and we've got the rolling curve. [6:59] All very neat. (Giuseppe) So the number of petals is n-1? [7:02] Yep and it keeps on going like this. Ok so let's start again with 2 times table. Now one [7:14] one really nice thing to try is to actually make increments not one ... to 3 to 4 to 5 but [7:21] actually do smaller increments [7:23] actually do the transition here continuously. I'll just show you what it looks like when I do [7:27] the multiplication times 2.1. What you get would you get 2.1, 2.2, 2.3, 2.4, 2.5, 2.6, [7:35] 2.7, 2.8, 2.9 and 3 and you can see how this cardioid turns into the nephroid. [7:44] Now I just let it go. [7:45] The numbers are going up and you can see the petals going more and more and more. [7:52] You think well that's probably what it's going to be. You can also look at [7:56] this in the Mandelbrot set and you can actually see exactly this sort of [8:00] pattern happening in the middle. [8:01] As we push the exponent to infinity the whole thing kind of turns into one big [8:06] circle. Okay and now you think that's the end of it but no, no, no. [8:11] Let's keep going here. Now the petals are pretty much going away but if [8:18] you just look at what's happening here you see there's a lot more structure [8:23] somehow being hinted at. I mean I'm moving very fast at the moment moving [8:28] very fast but if you actually went through this frame-by-frame you would see [8:31] a lot of really really nice structure happening and I've highlighted a bit here. [8:35] Just a few of the frames that you get you know some really amazing stuff [8:39] happening here so if you stop at 33 you get this one. If you stop at 34 [8:44] and there are a couple of other highlights here. There are a lot more but that is how many I could fit here. [8:48] Ok maybe let's have a close look at some of them. So here we've got four. The [8:56] number that all these correspond to is 200. [9:00] What we're really doing he has a special name in mathematics [9:04] So what we're doing here is the times table modulo 200. So it's got a [9:10] special name. It's actually incredibly important in all sorts of applications [9:14] to do this sort of modular arithmetic. But paper anyway for our purposes [9:20] you know you understand how it's built up and if you know a little bit more you [9:23] know a little bit more. So for the 2 times table we get the cardioid. For the 34 times table modulo 200 [9:32] we get this guy here and then some other interesting things happen. [9:37] So, for example, if you multiply by 51 we get this guy here [9:41] and if you multiply by 99 you get that guy here. And obviously if you just look [9:45] at the two numbers here below so 51 is pretty close to 1/4 of 200 so [9:50] must have something to do is that. 99 is pretty close to one-half of 200, must [9:55] have something to do with that. Now I really want to explain something I [10:00] really want to explain where this one comes from. And well I mean the first time I [10:07] saw it I was pretty surprised like everybody else who sees it but then I remembered [10:10] something I had seen the cardioid before in you know many many different guises and in [10:15] one particular one that I was familiar with I could see where the connection is. [10:19] I just want to tell you about that one and it's got to do with these light rays [10:24] bouncing around. It's a little bit different from what we had before. So basically we've got a [10:29] circle here and then we've got a light source right over on that side. And that circle [10:35] reflects the light right, so we switch on the light over there and then well what [10:40] happens? [10:40] Well light rays emanate in all kinds of directions and get reflected off the [10:46] circle bounce around and you can see this pattern emerging, the cardioid. So I [10:51] knew this one I had actually calculated this curve from this description at some point in [10:56] university. And starting with this you can actually see very easily why the cardioid comes up [11:02] in the two times table and I just want to show you.Let's just highlight like one of those rays [11:07] coming out here. It hits the wall here and then it gets reflected at the same [11:14] angle as it comes in, so this angle that you see here is the same as [11:19] it comes in. So what does that tell us now? Well, [11:25] if we if we put this line in the middle [11:30] that means that this side really flips over to that side, which means that this [11:34] segment in particular is exactly as long as that one here. If I travel from [11:40] this light bulb to this point and then from this point to that point it's exactly the [11:46] same distance, that's going to be important. So let's make this 0 let's call this [11:52] N. What's 2N then? To get 2N we have to measure this [11:57] distance here and then we have to measure it again and where do we get? Right up there ! [12:03] And so it's pretty clear that when you do the 2 times thing you get that reflected ray, you [12:09] know, in the picture. Just to finish off I'll show you a little bit of a movie of all the stuff [12:14] evolving a little bit slower than what we had before.