The Production AI Playbook: Deploying Agents at Enterprise Scale — Sandipan Bhaumik, Databricks
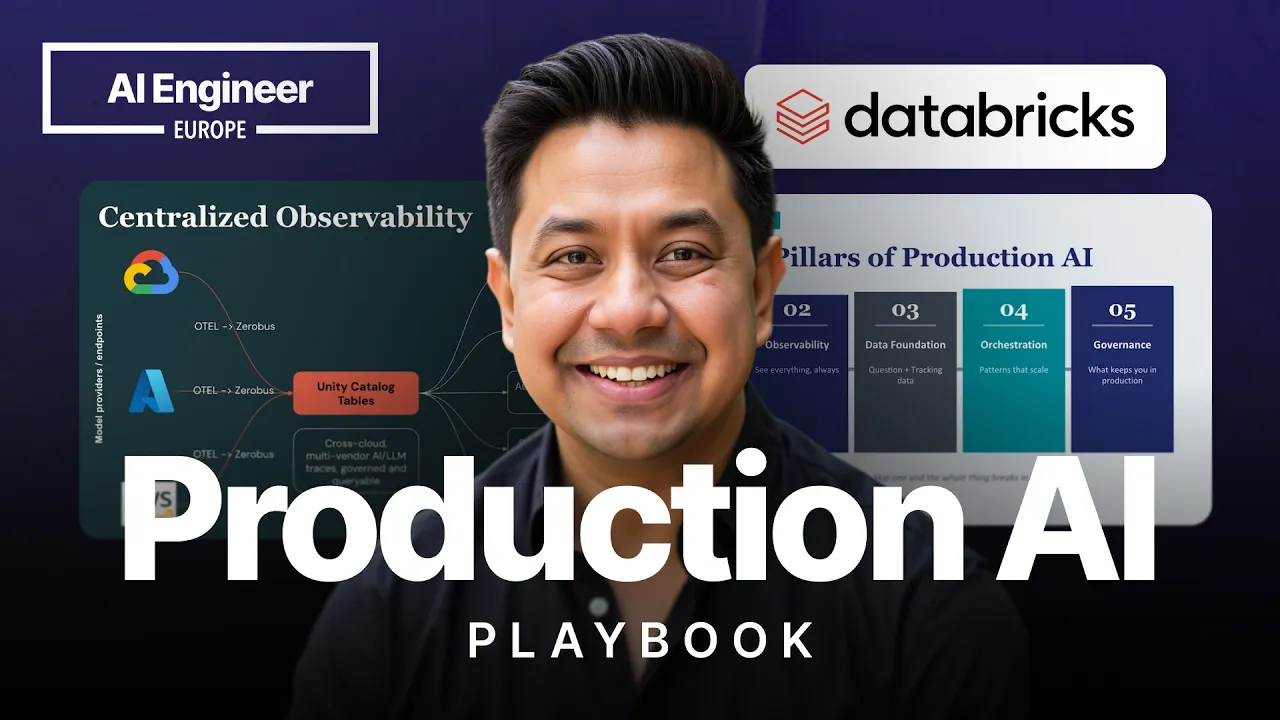
AI Engineer
AI-assisted summary of The Production AI Playbook: Deploying Agents at Enterprise Scale — Sandipan Bhaumik, Databricks — original source. Check the original for full context.
Source published:
Key ideas
- Starting enterprise AI projects with model selection is an anti-pattern; in an 8-week turnaround for an £85,000 failed banking PoC, the team deferred model selection to week seven, spending the first six weeks on evaluation data, tracing, and data foundation. (24:35)
- Production agent evaluation requires three distinct layers: deterministic code checks (regex, classic ML for PII/NER), semantic scoring (LLM-as-a-judge), and behavioral evaluation to detect redundant tool calls and runaway API loops. (7:33)
- Data foundation typically absorbs 60% of project effort because autonomous agents do not forgive pipeline errors and output wrong data with high confidence, necessitating separate schemas for 'question data' and 'tracking data'. (15:06)
- In regulated environments like European banking, end-to-end decision tracing is legally mandated for automated dispute resolution and runtime safety, such as enforcing human handoff after three failed tool executions. (11:25)
Detailed notes
## Background Published by AI Engineer on YouTube on June 18, 2026, this talk features Sandipan Bhaumik, a technical lead for Data and AI at Databricks. The description outlines how Bhaumik's team rescued an £85,000 retail bank chatbot proof-of-concept that stalled for six months, establishing a five-pillar enterprise deployment playbook centered on evaluation, observability, data foundations, multi-agent orchestration, and governance.
## TL;DR Sandipan Bhaumik addresses the common failure mode of enterprise AI projects—the 'model-first trap'—where teams prematurely debate LLM selection before defining how to observe, measure, or govern agent behavior. To solve this, he outlines a five-pillar framework spanning deterministic-to-behavioral evaluation layers, end-to-end decision tracing for regulatory compliance, and a bifurcated data foundation separating question data from tracking telemetry. Through a real-world retail bank case study, Bhaumik demonstrates how deferring model selection until week seven of an eight-week sprint enabled teams to intercept 47 PII leaks and rapidly diagnose post-launch retrieval failures caused by stale embeddings. He concludes with a structured production incident playbook alongside practical guidance on prompt commit governance, living test suites, and tiered CI/CD testing budgets.
## Atmosphere & style The session has the measured, pragmatic authority of an engineering post-mortem delivered from the enterprise trenches. Bhaumik speaks with calm, candid clarity, replacing generative AI hype with the unvarnished realities of distributed systems, compliance audits, and silent production failures. The narrative moves deliberately from cautionary tales of squandered budgets to structured architectural blueprints, creating a reassuring, highly practical atmosphere for engineers navigating the friction of moving prototypes to production.
## Bulletin - [24:35](https://www.youtube.com/watch?v=ObTPqBGsEbA&t=1475s) Starting enterprise AI projects with model selection is an anti-pattern; in an 8-week turnaround for an £85,000 failed banking PoC, the team deferred model selection to week seven, spending the first six weeks on evaluation data, tracing, and data foundation. - [07:33](https://www.youtube.com/watch?v=ObTPqBGsEbA&t=453s) Production agent evaluation requires three distinct layers: deterministic code checks (regex, classic ML for PII/NER), semantic scoring (LLM-as-a-judge), and behavioral evaluation to detect redundant tool calls and runaway API loops. - [15:06](https://www.youtube.com/watch?v=ObTPqBGsEbA&t=906s) Data foundation typically absorbs 60% of project effort because autonomous agents do not forgive pipeline errors and output wrong data with high confidence, necessitating separate schemas for 'question data' and 'tracking data'. - [11:25](https://www.youtube.com/watch?v=ObTPqBGsEbA&t=685s) In regulated environments like European banking, end-to-end decision tracing is legally mandated for automated dispute resolution and runtime safety, such as enforcing human handoff after three failed tool executions.
## Key takeaways - [01:52](https://www.youtube.com/watch?v=ObTPqBGsEbA&t=112s) Enterprise AI initiatives frequently stall post-launch due to three systemic deficits: the Observability Gap, the Evaluation Gap, and the Governance Gap. - [04:54](https://www.youtube.com/watch?v=ObTPqBGsEbA&t=294s) The five pillars of enterprise agent deployment are Evaluation, Observability, Data Foundation, Multi-Agent Orchestration, and Governance, all of which must be scoped before writing application code. - [07:33](https://www.youtube.com/watch?v=ObTPqBGsEbA&t=453s) Evaluation must serve as the formal software specification, defining precise numerical thresholds such as deflection rates and acceptable false-positive metrics upfront. - [07:33](https://www.youtube.com/watch?v=ObTPqBGsEbA&t=453s) Deterministic evaluation tasks like format validation, regex matching, and PII masking should be resolved upstream in low-cost classic code rather than via expensive LLM reasoning. - [10:01](https://www.youtube.com/watch?v=ObTPqBGsEbA&t=601s) Behavioral evaluation uncovers silent operational failures, such as duplicate database queries and infinite loops, that pass semantic accuracy checks but create severe latency and cost bottlenecks under enterprise scale. - [11:25](https://www.youtube.com/watch?v=ObTPqBGsEbA&t=685s) Granular execution tracing is mandatory in regulated jurisdictions like Europe, enabling teams to audit decisions, resolve customer disputes, and enforce circuit breakers or human escalations. - [15:06](https://www.youtube.com/watch?v=ObTPqBGsEbA&t=906s) Enterprise data strategies must split into 'question data' for answering domain queries and 'tracking data' for streaming telemetry into compliance, auditing, and automated evaluation systems. - [16:27](https://www.youtube.com/watch?v=ObTPqBGsEbA&t=987s) Centralized governance platforms like Unity Catalog provide critical metadata discovery, column descriptions, and PII tags that autonomous agents need to query data without exfiltrating sensitive information. - [20:05](https://www.youtube.com/watch?v=ObTPqBGsEbA&t=1205s) Multi-agent orchestration requires choosing between orchestrator-worker patterns for centralized debugging, choreography patterns for parallel low-latency execution, or human-in-the-loop workflows for confidence-based fallback. - [22:25](https://www.youtube.com/watch?v=ObTPqBGsEbA&t=1345s) AI governance requires rigorous pre-validation filtering—which caught 47 pre-launch PII leaks in a retail banking client—as well as strict version control and change management for operational prompts. - [26:07](https://www.youtube.com/watch?v=ObTPqBGsEbA&t=1567s) An evaluation dataset is a dynamic, living asset built from messy domain-expert interactions that continuously expands as new production edge cases and regression failures emerge. - [29:41](https://www.youtube.com/watch?v=ObTPqBGsEbA&t=1781s) A post-launch CSAT drop caused by stale interest rate answers demonstrated how production tracing instantly identifies silent RAG failures like un-embedded policy updates. - [30:53](https://www.youtube.com/watch?v=ObTPqBGsEbA&t=1853s) An enterprise production incident playbook must define a structured four-stage cycle—Detect, Diagnose, Contain, and Fix—integrated into existing IT Service Management (ITSM) systems. - [33:26](https://www.youtube.com/watch?v=ObTPqBGsEbA&t=2006s) To control rising CI/CD costs, teams should run lightweight evaluation smoke tests on branch pull requests and restrict exhaustive Layer 3 behavioral test suites to main branch merges.
## Detailed walkthrough ### [00:15](https://www.youtube.com/watch?v=ObTPqBGsEbA&t=15s) From Proof-of-Concept to Production: Lessons from the Trenches
Sandipan "Sandy" Bhaumik introduces himself as a technical lead for Data and AI at Databricks, following a five-year tenure at Amazon Web Services as a principal architect specializing in distributed data and AI platforms. While artificial intelligence has existed for decades, he reflects on how the industry has entered a phase of exponential experimentation over the past two years. Working directly with enterprise clients across B2B software and heavily regulated industries such as financial services, he has spent these years tackling the friction of translating flashy proof-of-concept demos into reliable, production-grade applications.
Bhaumik explains that the goal of the session is to synthesize those hard-won lessons from the trenches into a practical deployment playbook. Acknowledging the conference schedule, he notes that an afternoon session offers the ideal vantage point for attendees to take the granular concepts heard throughout the day and organize them into an overarching operational architecture. Rather than treating AI engineering as an ad-hoc series of experiments, teams need a concrete framework to evaluate where their tooling, observability, and models actually belong.
As Sandy Bhaumik frames the current industry inflection point: “In the past couple of years, specifically, I've been working with customers trying to figure out what we do with this new AI technology.”
- Prior to joining Databricks, Sandy served for 5 years as a principal architect for data and AI at AWS, focusing on scaling distributed systems. - His enterprise engagements center on taking prototypes out of sandbox environments and deploying them inside strict B2B and financial regulatory environments.
---
[01:52](https://www.youtube.com/watch?v=ObTPqBGsEbA&t=112s) The "Model-First" Trap and the Three Gaps to Production
Looking back at client engagements over the prior two years, Bhaumik outlines a recurring anti-pattern driven by top-down pressure. Organizations felt immense urgency from executive leadership to deploy AI solutions immediately, which caused teams to begin almost every technical discussion with model selection. Stakeholders would exhaustively debate whether to use GPT or Claude before understanding the underlying operational requirements. Once a model was selected, engineers would build features around predictable datasets in tightly controlled sandbox environments. The demos inevitably looked impressive, leadership signed off on deployment, and the project shipped into production.
Within weeks of launch, the illusion broke down as real users introduced inputs that the system was never equipped to handle. Organizations were left baffled when their systems behaved erratically and failed to answer routine inquiries the way they had during presentations. This premature push into production yielded little to no return on investment while squandering substantial capital and engineering bandwidth on architectures that could never scale.
Reflecting on the frantic post-launch confusion inside these enterprises, Sandy Bhaumik recalls: “Then, after a few weeks, people would start asking questions that what the hell is AI doing?”
From analyzing these stalled initiatives, Bhaumik identified three fundamental structural gaps that doom enterprise AI projects from the outset:
1. **The Observability Gap:** If engineers cannot observe the internal behavior of an agent in real time and trace every downstream tool call or decision branch, the system is fundamentally unsafe and unusable in production. 2. **The Evaluation Gap:** Organizations speak abstractly about accuracy, latency, and groundedness, but fail to define exact business-level numerical thresholds or build continuous automated systems to track whether outputs are improving or degrading over time. 3. **The Governance Gap:** Teams fail to establish ownership and operational procedures for production incidents. When a model hallucinates offensive content or serves bad guidance at 3:00 a.m., there is often no clear protocol for who owns the underlying data assets or who is held accountable.
---
[04:54](https://www.youtube.com/watch?v=ObTPqBGsEbA&t=294s) The Five Pillars of Enterprise AI Deployment
To counter these systemic failures, Bhaumik developed a battle-tested enterprise deployment framework composed of five core pillars. While organizations ideally tackle these steps sequentially, he acknowledges that real-world pressures often force teams to build them concurrently. Regardless of execution order, all five components must be planned before writing application code.
The framework starts with **Evaluation**, establishing rigorous numerical success criteria upfront. The second pillar, **Observability**, enforces end-to-end tracing across every agent decision—an absolute prerequisite for companies operating in Europe and other heavily regulated jurisdictions where AI systems cannot be legally onboarded without full auditability. The third pillar is the **Data Foundation**, which Bhaumik bifurcates into "question data" (pre-training, post-training, and real-time retrieval APIs) and "tracking data" (the high-volume decision traces generated by running hundreds of autonomous agents). The fourth pillar addresses **Multi-Agent Orchestration**, noting that while single-agent systems are straightforward, coordinating five or more agents introduces exponential complexity around message routing, state synchronization, and execution dependencies. The final pillar is **Governance**, which formalizes accountability, data security, prompt-injection defense, and brand protection when failures occur.
Emphasizing that engineering priorities must be inverted, Sandy Bhaumik states: “Before touching any code, before discussing about any models, any features, you have to think about when we build this system, how do we measure?”
```mermaid flowchart TD accTitle: The Five Pillars of Production AI Deployment accDescr: Sequential flow showing the five structural pillars required to take enterprise agents to production. subgraph Foundation ["System Readiness"] P1["1. Evaluation<br/>(Metrics & Benchmarks)"] P2["2. Observability<br/>(Tracing & Auditability)"] P3["3. Data Foundation<br/>(Retrieval & Trace Telemetry)"] end subgraph Execution ["Scale & Safety"] P4["4. Orchestration<br/>(Multi-Agent Coordination)"] P5["5. Governance<br/>(Security, PII & Ownership)"] end P1 --> P2 P2 --> P3 P3 --> P4 P4 --> P5 ```
- **Regulatory Compliance:** In European jurisdictions and regulated sectors like banking, automated decision systems cannot be deployed to production without deep execution tracing in place. - **Trace Telemetry Strategy:** Managing the observability logs of hundreds of interacting enterprise agents requires a standalone data infrastructure strategy comparable to core business intelligence pipelines.
---
[07:33](https://www.youtube.com/watch?v=ObTPqBGsEbA&t=453s) Pillar 1: Evaluation as Specification and the First Evaluation Layer
Bhaumik dives into the first pillar, insisting that evaluation must function as the formal software specification for any AI system. Rather than using vague qualitative goals, teams must translate target outcomes into hard numbers: acceptable false-positive rates, minimum accuracy thresholds, and business-specific performance metrics. In a retail banking chatbot, for instance, the primary business objective is frequently query deflection—measuring the exact percentage of routine customer questions the agent can successfully resolve without escalating to an expensive human support representative.
Building an effective evaluation framework requires assembling a golden dataset grounded in frontline reality rather than synthetic assumptions. Bhaumik advises engineers to sit directly with customer support agents and domain experts to document how actual edge cases, ambiguous questions, and gray areas are handled on the phone or over chat. Once compiled, this dataset powers an automated evaluation pipeline that continuously scores live agent responses against golden test cases, providing immediate feedback on whether the model is meeting its numerical benchmarks.
Architecturally, Bhaumik highlights that evaluation systems across mature organizations break down into three distinct operational layers. The first layer consists of **Deterministic Evaluation**. This layer handles straightforward, computationally cheap verifications that software engineering has solved for decades: regular expressions for checking phone number and email syntax, alongside classic machine learning models for named entity recognition (NER), intent classification, and personally identifiable information (PII) detection. Bhaumik stresses that teams should strip these deterministic checks out of LLM prompts and resolve them upstream via traditional code and lightweight models before deploying expensive, non-deterministic reasoning.
Setting the baseline definition for building reliable AI pipelines, Sandy Bhaumik insists: “Evaluation is basically specification for your AI system.”
- Numerical metrics must replace qualitative descriptions: define acceptable false-positive rates and deflection targets upfront. - Evaluation sets must represent messy ground-truth scenarios captured directly from human domain experts rather than clean, idealized benchmarks. - Deterministic checks (format validation, regular expressions, NER, and PII masking) should be resolved in the first evaluation layer using classic, low-cost code and classic ML models rather than LLMs.
[10:01](https://www.youtube.com/watch?v=ObTPqBGsEbA&t=601s) Semantic Evaluation and Behavioral Checks
Evaluating non-deterministic semantic responses requires automated evaluation techniques such as LLM-as-a-judge. In this setup, a dedicated secondary model evaluates the output of the primary model against specific criteria, including groundedness, safety, and relevance to the user's intent. The evaluation dataset informs the judge model by providing expected answers and criteria to measure against. In enterprise platforms like Databricks MLflow, these custom judges run automatically across production traces at scale, evaluating whether the generated text aligns with the intended prompt specifications and factual grounding.
```mermaid flowchart TD accTitle: Three-Layer Agent Evaluation Architecture accDescr: Diagram illustrating the three evaluation layers from deterministic to semantic and behavioral checks.
subgraph L1["Layer 1: Deterministic"] D["Regex, schema checks, format validation"] end
subgraph L2["Layer 2: Semantic (LLM-as-a-Judge)"] S["Groundedness, safety, answer relevance"] end
subgraph L3["Layer 3: Behavioral"] B1["Tool execution & routing"] B2["Infinite loop detection"] B3["Duplicate call minimization"] end
L1 --> L2 L2 --> L3 ```
Beyond deterministic and semantic checks lies behavioral evaluation, which scrutinizes the execution mechanics of agents—specifically how they interact with external tools and systems. Sandipan Bhaumik points out that an agent can appear completely successful on the surface while masking severe operational flaws underneath. For instance, when a customer asks, *"What is my account balance?"*, the agent may respond with the exact, correct dollar amount, passing both deterministic formatting tests and semantic accuracy checks. However, examining the behavioral telemetry reveals that the agent executed three redundant calls to the underlying customer database because previous calls failed or lacked proper termination logic.
While multiple repeated queries can pass unnoticed in a small demo, Bhaumik warns that they become catastrophic under enterprise load: “Now, three API calls in demo environment is fine, but in production, when you get thousands of queries from users every day, and there's like duplication in API calls, that's an expensive operation.” Because behavioral evaluation directly impacts cost, latency, and reliability, overlooking this layer poses a major risk to enterprise deployments.
- **Primary judge criteria**: Measures groundedness, safety filters, context recall, and relevance to the question. - **Behavioral failure modes**: Unnecessary tool retries, looping agent logic, and silent duplicate database queries. - **Enterprise impact**: Multiplied cloud infrastructure and API costs when thousands of concurrent users trigger redundant backend transactions.
---
[11:25](https://www.youtube.com/watch?v=ObTPqBGsEbA&t=685s) Observability and Decision Tracing in Regulated Environments
The second pillar of the production playbook is observability, powered by comprehensive decision tracing. In an enterprise system, every autonomous step an agent takes must be captured and structured into an inspectable timeline. Bhaumik illustrates this with a real-world scenario from a retail banking chatbot handling an overdraft fee waiver request:
```mermaid flowchart LR accTitle: Retail Bank Agent Decision Trace accDescr: Step-by-step trace of how a banking agent handles an overdraft fee dispute.
A["User Request: Waive Fee"] --> B["Intent Classification"] B --> C["Customer DB Lookup"] C --> D["RAG Vector Search"] D --> E["Reasoning & Policy Check"] E --> F["Guardrails & Output"] ```
When a customer contacts support claiming an overdraft charge was illegitimate and asking for it to be waived, observability infrastructure traces every step: 1. **Intent Classification**: Classifies the query as a fee dispute, logging the exact latency (in seconds) and the model's confidence score. 2. **Account Integration**: Calls a backend API to retrieve the customer's account records from the core banking database. 3. **Policy Retrieval**: Performs a RAG lookup against a vector database to verify current bank rules regarding overdraft exemptions. 4. **Reasoning Engine**: Synthesizes the customer's account standing against the retrieved policy guidelines to determine eligibility. 5. **Guardrail Check**: Runs final output filters to verify compliance and safety before returning the final response.
Without granular decision tracing, teams are defenseless when customers dispute automated decisions. As Sandipan Bhaumik emphasizes, “Now, if you did not set up a system that helps you look visualize all of these traces, when the customer comes to you and raises a dispute, you have no way to check what the AI did.” Teams often default to writing off fees or issuing discounts because they cannot verify what occurred. Beyond operational recovery, European and global regulators explicitly mandate auditable decision trails, making tracing a prerequisite for going live. In production, this telemetry feeds online monitoring systems that trigger fallback strategies—such as capping automated API retries at three attempts before handing off the session to a human agent.
- **Regulatory compliance**: Financial service watchdogs require step-by-step auditability for automated decisions. - **Dispute resolution**: Detailed traces record whether the agent consulted stale policy documentation or misinterpreted account metadata. - **Fallback enforcement**: Automated guardrails prevent runaway loops by routing interactions to human agents after three failed tool executions.
---
[15:06](https://www.youtube.com/watch?v=ObTPqBGsEbA&t=906s) The Data Foundation: Question Data vs. Tracking Data
Data foundation is the most critical pillar of any production rollout, routinely consuming 60% of project time. Enterprise data was historically collected and formatted for human consumption, but AI agents interact with data in a fundamentally different way. When a human encounters bad or missing information in an internal dashboard or report, they rely on intuition, cross-reference peers, or submit a data correction request.
Agents lack human intuition and cannot compensate for underlying pipeline defects. Explaining this gap, Sandipan Bhaumik observes: “Data was always built for humans, and humans are always forgiving. You find the wrong data in a report, you just go and ask someone to correct it. Agents don't forgive you, right? Agents will go, find it wrong, they'll give you the wrong answer confidently.” Because an agent presents inaccurate data with high confidence, data quality and governance dictate the success of the application.
Enterprises must split their data strategy into two operational categories: 1. **Question Data**: The domain-specific knowledge bases, structured tables, and transactional records needed to answer user queries and execute tools. 2. **Tracking Data**: The observability, telemetry, and execution traces produced by the agent during every interaction.
Tracking data requires a dedicated data schema plan. It must be structured so it can be streamed to auditors, queried by compliance regulators, scanned by online monitoring pipelines, and evaluated by automated LLM judges without slowing down production runtime.
- **Project allocation**: Approximately 60% of total implementation effort centers on cleaning, structuring, and governing agent-facing data. - **Human vs. Agent data tolerance**: Humans spot flaws and adapt; agents ingest pipeline errors and assert hallucinations with total certainty. - **Operational requirements for tracking data**: Strict schema enforcement, persistent audit storage, and low-latency availability for both automated judges and external compliance auditors.
---
[16:27](https://www.youtube.com/watch?v=ObTPqBGsEbA&t=987s) Enterprise Data Architecture and Centralized Agent Tracing
To run autonomous agents reliably at scale, organizations rely on a multi-layered data foundation built on cloud storage (across AWS, Azure, and Google Cloud) and modern lakehouse architecture. Raw files—such as images, text documents, and video—are stored in object storage and wrapped by Delta Lake. Delta Lake adds ACID transaction support, manifest-driven table structures, and incremental batch or streaming data loading to unstructured and semi-structured assets.
```mermaid flowchart TD accTitle: Databricks Enterprise Data and AI Stack accDescr: Layered architecture showing cloud storage up through Delta Lake, Unity Catalog governance, and agent applications.
subgraph Apps["Applications & Tooling Layer"] M["Mosaic AI (LLMs & Apps)"] G["Databricks Genie (Text-to-SQL)"] A["Custom Databricks Apps"] E["MLflow & Agent Bricks (LLM Judges)"] end
subgraph Gov["Governance Layer"] U["Unity Catalog (Permissions, Metadata, PII Tagging)"] end
subgraph Storage["Data Foundation Layer"] D["Delta Lake (ACID, Manifests, Incremental Loads)"] C["Cloud Object Storage (AWS, Azure, GCP)"] end
C --> D D --> U U --> Apps ```
On top of Delta Lake, Unity Catalog serves as a centralized governance layer. It enforces role-based access controls, tracks end-to-end data lineage, and supports external access via Delta Sharing. Critically for AI agents, Unity Catalog manages metadata discovery, table descriptions, column definitions, and PII tags. When an autonomous agent or text-to-SQL model queries enterprise tables, it relies directly on these schema descriptions and PII tags to navigate schemas safely and prevent data exfiltration.
On top of this foundation, enterprise tools operate across multiple functions: Mosaic AI for model development and fine-tuning, Databricks Genie for natural language text-to-SQL querying, custom Databricks Apps for operational user interfaces, and MLflow with Agent Bricks for automated LLM judges. In large enterprises, developer teams rarely deploy on a single framework; they run combinations of LangChain, CrewAI, and native SDKs across multiple clouds. Centralizing observability and tracking telemetry into a shared data platform gives first-line defense teams, support engineers, and automated evaluators a single pane of glass to audit system health and agent behavior.
- **Unified governance**: Unity Catalog supplies rich semantic descriptions and column-level PII tags directly to autonomous agents during tool execution. - **Cross-framework consolidation**: Centralizes telemetry across disparate orchestrators (LangChain, CrewAI, custom agents) into structured lakehouse tables. - **Downstream observability use cases**: Powers automated compliance audits, operational health dashboards for first-line support, and ad-hoc troubleshooting via natural language SQL queries using Databricks Genie.
[20:05](https://www.youtube.com/watch?v=ObTPqBGsEbA&t=1205s) Pillar 4: Multi-Agent Orchestration Patterns (Orchestrator, Choreography, Human-in-the-Loop)
Moving past data unification, Sandipan introduces the fourth pillar: selecting the right multi-agent orchestration architecture. Operating a single agent is relatively straightforward, but as soon as an enterprise introduces multiple collaborating agents, systemic complexity explodes. Sandipan outlines three primary interaction topologies teams must evaluate based on their operational requirements: the orchestrator-worker pattern, the choreography pattern, and human-in-the-loop workflows.
In the orchestrator-worker pattern, a centralized control plane acts as the single point of entry and coordination. It decomposes incoming tasks and routes requests to specialized worker agents based on their discrete domain capabilities. Because every request passes through the central brain, debugging failure modes is clean and deterministic: operators simply inspect the orchestrator's central audit logs to see exactly where a sub-task stalled or returned bad output. Conversely, the choreography pattern eliminates the central orchestrator entirely in favor of an event-driven message bus. Independent, autonomous agents subscribe to specific domain events and execute concurrently rather than sequentially. In an enterprise mortgage application workflow, for instance, one agent can inspect customer profile details while another parallel agent evaluates underwriting approval criteria. By cutting out back-and-forth orchestration roundtrips, this pattern significantly drives down latency. Finally, human-in-the-loop patterns serve as essential safety valves, automatically routing transactions to a human supervisor whenever an agent's confidence score dips below an established operational threshold.
- **Orchestrator-Worker:** Centralized routing, strict execution control, and unified logging, making post-incident forensic analysis straightforward. - **Choreography:** Autonomous agents communicating asynchronously over an event bus, executing parallel workflows (e.g., identity verification and credit checks) to minimize end-to-end response latency. - **Human-in-the-Loop:** Automated escalation paths that suspend autonomous execution and request human sign-off when model uncertainty or risk thresholds are breached. - **Deep-Dive Reference:** Sandipan notes he recorded a dedicated technical talk for the conference's online track covering state management, fault tolerance, failure handling, and enterprise scaling patterns for multi-agent architectures.
> “As I said, one agent is good, multiple agents increases complexity.” — Sandipan Bhaumik
---
[22:25](https://www.youtube.com/watch?v=ObTPqBGsEbA&t=1345s) Pillar 5: Enterprise Governance, PII Detection, and Change Management
Pillar five shifts focus to AI-specific governance. Sandipan clarifies that standard enterprise data governance is merely baseline table stakes; production AI demands an entirely separate layer of operational controls, auditability, and risk mitigation. Regulatory compliance requires end-to-end audit trails that capture every user interaction, connection attempt, tool execution, and intermediate reasoning step. Before prompts ever reach an LLM, a strict pre-validation layer must scrub personal data using named entity recognition (NER) and regular expressions. In real-world testing with his retail banking client, this filtering layer caught 47 PII breaches before the system ever saw production traffic.
Furthermore, enterprise rigor must extend to prompt versioning and foundational model lifecycle management. Tweaking a prompt cannot simply be an undocumented Git commit pushed directly by a developer; prompts dictate application logic and must follow the same formal change management, automated testing, and release gating as production source code. Similarly, when LLM vendors release upgraded model checkpoints, teams cannot assume higher leaderboard scores translate to better internal performance. Public third-party evaluation benchmarks rarely correlate with proprietary enterprise domains. Organizations must maintain private evaluation suites to test model updates against their own data, preserving the architectural agility to swap providers rather than suffering lock-in to a single vulnerable upstream dependency.
- **Auditability & Traceability:** Immutable logging of all user requests, agent actions, and downstream integration calls for regulatory oversight. - **PII Guardrails:** Front-line NER and regex filters that successfully intercepted 47 PII leaks during pre-production validation. - **Prompts as Code:** Rigorous version control and peer-reviewed change management applied to all operational prompts. - **Model Risk Mitigation:** Continuous regression testing on internal benchmark datasets whenever upstream foundation models are updated or replaced. - **Platform Packaging:** Databricks incorporates these foundational governance, tracing, and evaluation pillars natively into its Agent Bricks framework to provide out-of-the-box enterprise readiness.
> “In our example, the work that I was doing with the customer that I mentioned, we already detected 47 PII breaches during the testing phase by applying this layer.” — Sandipan Bhaumik
> “You have to treat prompt versioning as change management in enterprise grade solution.” — Sandipan Bhaumik
---
[24:35](https://www.youtube.com/watch?v=ObTPqBGsEbA&t=1475s) Case Study: Rescuing an £85,000 Failed Retail Bank Chatbot PoC
To illustrate how these engineering pillars operate in practice, Sandipan walks through an engagement with a major retail bank that had spent approximately 18 months attempting to deploy a customer-facing conversational agent. The bank handled around 20,000 customer service calls every month. An internal audit revealed that roughly 60% of these calls were routine, low-complexity inquiries—such as checking current account balances or asking standard questions about overdraft fees—that tied up expensive human agents unnecessarily.
In an effort to deflect this call volume, the bank spent £85,000 over six months building a proof of concept (PoC) with an external partner. The project stalled completely. In pre-production and staging, the chatbot continually failed, yet none of the engineers or business stakeholders could diagnose why it was failing, measure its actual accuracy, or establish who was accountable when downstream integrations broke. Sandipan’s team took over the engagement under an aggressive eight-week reset timeline. Rather than rushing into prompt engineering or debating foundation models on day one, they anchored the project to explicit, measurable business outcomes: deflect 60% of simple tier-one customer queries with a target accuracy rate of at least 85%, supported by strict latency guarantees.
- **Baseline Call Volume:** ~20,000 customer service calls per month entering the bank's contact center. - **Automation Opportunity:** 60% of incoming inquiries consisted of simple, repetitive tasks (account balances, overdraft policies). - **Initial Sunk Cost:** £85,000 and 6 months of development resulting in a failed PoC with zero observability and no clear accountability. - **Reset SLA Targets:** Autonomous handling of 60% of routine inquiries, an 85% accuracy benchmark, and strict latency bounds. - **Contrarian Schedule:** Model selection was deliberately deferred until week seven of the eight-week engagement.
> “The key difference in this project that we when we did is that we selected the model in week seven, like in a eight weeks POC.” — Sandipan Bhaumik
---
[26:07](https://www.youtube.com/watch?v=ObTPqBGsEbA&t=1567s) Weeks 1–2: Building the Living Evaluation Dataset and Pipeline
During the first two weeks of the rescue engagement, the team wrote no agent application code. Instead, they focused entirely on constructing an evaluation dataset and automated measurement pipeline. They curated an initial golden dataset of 200 real-world customer inquiries, pairing each prompt with the exact verbatim transcripts of how high-performing human bank agents resolved them. This established an empirical ground truth for tone, factual precision, and procedural correctness.
Next, they engineered an automated evaluation harness. Whenever an agent generated a response, the pipeline compared the candidate text against the ground-truth dataset, assigned an automated score, and flagged any output falling below the designated quality threshold for human inspection. When errors surfaced—whether due to ambiguous phrasing, missing context, or flawed tool invocations—engineers adjusted the prompt or tool schemas and immediately converted the failed interaction into a permanent test case. Sandipan stresses that an evaluation dataset is not a static benchmark frozen at launch; it is a dynamic, living asset that must expand continuously as new edge cases appear in production.
```mermaid flowchart TD accTitle: Automated Evaluation and Feedback Pipeline accDescr: An incoming query and agent response are scored against a golden dataset, routing low-scoring answers to humans and updating the test suite.
subgraph INGEST["1. Execution"] Q["User Question"] --> AG["AI Agent"] AG --> RESP["Agent Response"] end
subgraph EVAL["2. Automated Grading"] RESP --> COMP["Eval Pipeline"] GOLD[("Golden Dataset\n(200+ Cases)")] --> COMP COMP --> SCORE{"Score > Threshold?"} end
subgraph REMEDIATION["3. Human Review & Expansion"] SCORE -->|"Yes"| PASS["Approved Response"] SCORE -->|"No"| REV["Human Review"] REV --> FIX["Fix Prompt or Tool Schema"] FIX -->|"Append New Test Case"| GOLD end ```
- **Golden Ground Truth:** Compiled 200 verified human-agent interaction transcripts representing standard retail banking queries. - **Automated Feedback Loop:** Responses scoring below acceptance thresholds trigger human review and root-cause analysis. - **Continuous Hardening:** Every discovered regression or edge-case failure is converted into an automated regression test, expanding the evaluation suite over time.
> “The summary of that story is that your evaluation data set is a living system. You start with 200, maybe there is no correct number here, but once you start, as you start building in production, this is a living system.” — Sandipan Bhaumik
---
[27:45](https://www.youtube.com/watch?v=ObTPqBGsEbA&t=1665s) Weeks 3–8: Infrastructure Tracing, Late Model Selection, and Launch
Entering the middle weeks of the engagement, the team laid down the core infrastructure layer before evaluating models. Long before standards like the Model Context Protocol (MCP) existed, the team implemented direct API connections between the agent and the bank’s distributed databases. Crucially, they instrumented end-to-end distributed tracing across every database query and API hop. When mock customer load was applied during testing, this tracing fabric immediately exposed hidden bottlenecks, including duplicate API calls that inflated latency and directly damaged customer satisfaction scores.
By weeks seven and eight, with comprehensive tracing and the golden evaluation dataset fully operational, model selection became an objective benchmarking exercise rather than an emotional debate. The team ran candidate foundation models across their curated test suite, calculated empirical accuracy scores against the expected outputs, and selected the winning model in a matter of days. With observability, automated evaluation, and governance guardrails unified into a visible, measurable, and accountable system, the bank successfully launched the agent into production. Six weeks after deployment, the operational metrics—accuracy, deflection rate, latency, and CSAT—were meeting targets, positioning the infrastructure to immediately catch subtle drift when policy changes loomed.
- **Infrastructure First:** Built direct database API query integrations with distributed trace capture prior to selecting any LLM. - **Immediate Defect Detection:** Trace telemetry surfaced redundant, duplicate API calls that had been degrading response times and CSAT. - **Empirical Model Selection:** Replaced subjective model debates with empirical test runs against the evaluation harness, completing model selection rapidly in week seven. - **Production Readiness:** Integrated evaluation, tracing, and governance layers to ensure the production deployment remained visible, measurable, and auditable from day one.
[29:41](https://www.youtube.com/watch?v=ObTPqBGsEbA&t=1781s) Post-Launch Production Incident: Stale Embeddings and Dropped CSAT
Sandipan Bhaumik illustrates the critical value of production observability by walking through a real incident that occurred after the retail bank’s chatbot went live. The bank altered its interest rate policies and notified its user base through emails and push alerts within the mobile banking application. Naturally, customers navigated to the in-app chatbot to ask follow-up questions about how the rate changes impacted their accounts. The chatbot, however, failed to provide accurate updates, prompting a wave of thumbs-down ratings and a noticeable slump in customer satisfaction (CSAT) scores.
Without an active telemetry and measurement system, diagnosing such a silent degradation would have been nearly impossible. Because the engineering team had implemented end-to-end tracing and real-time evaluation metrics, they immediately flagged the drop in CSAT and inspected the execution traces. The inspection revealed that the agent’s retrieval mechanism was retrieving an outdated policy document; the newly announced rate documentation had never been embedded and indexed into the vector database. Bhaumik emphasizes that resolving the bug was straightforward once spotted: “Because it did not come through, it was giving it stale answers. And that's when we went and fixed that. But it it was all possible because we built that those systems that that led us to to detect this.”
```mermaid flowchart TD accTitle: Production Incident and Recovery Flow accDescr: Flowchart showing how an interest rate policy change led to stale answers, user feedback, detection via tracing, and resolution.
subgraph Trigger ["1. Bank Policy Update"] A["Bank updates interest rate policy"] --> B["Customers notified via email and mobile app"] B --> C["Customers query chatbot for details"] end
subgraph Failure ["2. Silent RAG Failure"] C --> D["New policy document missing from vector DB"] D --> E["Chatbot retrieves stale policy embeddings"] E --> F["Incorrect answers served to users"] end
subgraph Remediation ["3. Telemetry and Fix"] F --> G["Thumbs-down feedback causes CSAT drop"] G --> H["Eval dashboard and tracing flag stale retrieval"] H --> I["Re-embed new policy into vector DB"] end ```
[30:53](https://www.youtube.com/watch?v=ObTPqBGsEbA&t=1853s) The Production Incident Playbook: Detect, Diagnose, Contain, and Fix
To ensure teams are prepared for runtime failures rather than caught off guard, Bhaumik introduces the production incident playbook, an operational standard often omitted in enterprise generative AI initiatives. “This is something that a lot of us tend to miss when we work in AI projects. And this playbook is basically a definition of what needs to happen when things fail in production,” he states. The playbook establishes a structured four-stage response cycle: detect via evaluation dashboards, diagnose root causes through granular tracing, contain runtime damage, and implement permanent fixes via regression test suites.
During containment, teams must maintain the ability to roll back faulty prompt versions immediately, divert failing conversations to human operators, or trigger programmatic fault-tolerance patterns. Bhaumik references architectural patterns such as saga patterns, compensating transactions, and circuit breakers to handle multi-agent cascade failures cleanly. For the remediation phase, engineering teams examine LLM-as-a-judge reports and test case logs to diagnose the defect, deploy the fix, and incorporate the failing scenario back into their living evaluation suite. Finally, Bhaumik insists that this entire workflow must be plugged directly into established IT Service Management (ITSM) platforms, ensuring automated alerts reach on-call engineers without disrupting downstream systems.
- **Detect:** Automated alerts triggered by real-time eval dashboard anomalies and CSAT drops. - **Diagnose:** Inspect agent execution traces, tool invocations, and retrieval chunks. - **Contain:** Roll back prompts, deflect interactions to human agents, or activate circuit breaker and compensation patterns. - **Fix:** Debug using LLM-as-a-judge reports, update the evaluation test library, and retrain or reprompt. - **Enterprise Integration:** Connect triggers to enterprise ITSM systems to automate escalation paths.
[32:46](https://www.youtube.com/watch?v=ObTPqBGsEbA&t=1966s) What to Do Tomorrow: Grounding Success in Business Realities
Turning to practical implementation steps that attendees can take immediately, Bhaumik advises engineers to resist the temptation to jump straight into model selection or complex agent frameworks. Instead, any new project must begin by formulating a clear, non-technical definition of what success looks like to the business. Teams should assemble a curated collection of representative user questions alongside explicit examples of what constitutes an ideal, acceptable answer.
Once this ground-truth sample is collected, developers can write simple, lightweight Python scripts to build an automated evaluation harness. Whenever an agent generates a response, this pipeline automatically compares the model's output against the reference dataset, establishing a baseline measurement before real users ever interact with the system.
[33:26](https://www.youtube.com/watch?v=ObTPqBGsEbA&t=2006s) Three Hard-Won Lessons in Evaluation and Governance
Reflecting on field deployments with enterprise clients, Bhaumik details three operational lessons that are frequently overlooked until projects hit production scale. The first lesson centers on test case library governance. Because an evaluation dataset is a living system that constantly accumulates regression cases, it rapidly becomes unwieldy without formal ownership. Bhaumik recommends categorizing every row by business or technical domain—such as tagging authentication failures where an agent neglected to request login credentials under a dedicated "security" bucket. Clear categorization ensures that whenever an incident occurs, engineers can isolate and run only the relevant slices of the test suite.
The second lesson addresses prompt versioning discipline. While engineering teams routinely commit prompt templates into Git repositories, commit histories are frequently polluted with vague or meaningless messages. Bhaumik stresses that prompt changes require strict commit governance: “You have to put governance around what kind of commit messages you are putting in when you're changing these prompts because you need to understand when a prompt was changed, for exact what reason it was changed, right? What was the failure that caused this prompt to be changed? What kind of failure would it address and what would it correct, right? In the next version. That needs to be documented.”
The third lesson targets the escalating cost of Layer 3 behavioral evaluations. Evaluating complex agent behaviors, tool selection, and argument parsing across hundreds of test rows consumes significant API tokens and compute budgets. If CI pipelines trigger a full 300-to-500-row behavioral evaluation on every single prompt commit, testing costs quickly spiral out of control. Bhaumik recommends establishing tiered CI checks: run a fast, inexpensive subset of the evaluation dataset on feature branch commits and pull requests, reserving the exhaustive, expensive behavioral test suite for merges into the main branch.
- **Test Suite Governance:** Assign explicit ownership to the test library and classify rows into structured categories (e.g., security, compliance, retrieval, tool execution). - **Audit-Ready Commit Messages:** Require commit metadata detailing the exact incident, the observed failure mode, and the intended corrective behavior for every prompt modification. - **Tiered CI/CD Evals:** Run lightweight smoke tests on feature branch PRs; execute the full 300+ row Layer 3 evaluation suite exclusively on main branch merges to optimize operational spend.
[35:58](https://www.youtube.com/watch?v=ObTPqBGsEbA&t=2158s) Tooling Artifacts and Closing Remarks
Bhaumik concludes his talk by presenting downloadable resources via on-screen QR codes to help practitioners implement these production patterns. The provided repository includes enterprise evaluation checklist templates, sample incident playbooks, and an implementation guide for configuring telemetry and tracing using open-source frameworks. This setup allows developers to establish tracing in staging environments prior to committing to commercial vendor tooling. He invites attendees to follow his weekly newsletter, where he regularly documents architectural patterns and operational lessons derived directly from deploying enterprise AI agents in the field, before closing to audience applause.
## Notable quotes > [07:33](https://www.youtube.com/watch?v=ObTPqBGsEbA&t=453s) Evaluation is basically specification for your AI system. — Sandipan Bhaumik
> [04:54](https://www.youtube.com/watch?v=ObTPqBGsEbA&t=294s) Before touching any code, before discussing about any models, any features, you have to think about when we build this system, how do we measure? — Sandipan Bhaumik
> [15:06](https://www.youtube.com/watch?v=ObTPqBGsEbA&t=906s) Data was always built for humans, and humans are always forgiving. You find the wrong data in a report, you just go and ask someone to correct it. Agents don't forgive you, right? Agents will go, find it wrong, they'll give you the wrong answer confidently. — Sandipan Bhaumik
> [22:25](https://www.youtube.com/watch?v=ObTPqBGsEbA&t=1345s) You have to treat prompt versioning as change management in enterprise grade solution. — Sandipan Bhaumik
## Mentioned Sandipan Bhaumik, Databricks, Amazon Web Services, GPT, Claude, MLflow, Delta Lake, Unity Catalog, Delta Sharing, Mosaic AI, Databricks Genie, Agent Bricks, LangChain, CrewAI, Model Context Protocol
## Video description A retail bank spent £85,000 over six months on a chatbot PoC that could not reach production. No one could explain why it was failing. When Sandipan Bhaumik's team got involved, they picked the model in week seven of an eight-week engagement — the first six weeks went to evaluation data, tracing infrastructure, and a measurement pipeline. Six weeks post launch, when the bank updated its interest rate policy and customer satisfaction dropped, the tracing system caught the cause: the new policy document had not been reembedded and the agent was serving stale answers.
The talk covers the five pillars he built from that and similar engagements: evaluation (define success numerically before touching code), observability (trace every agent decision — European regulators require it), data foundation (agents do not forgive bad data the way humans do), multi agent orchestration patterns, and governance (47 PII breaches caught in testing before launch). The evaluation data set is a living system, not a fixed benchmark. The production incident playbook connects all five.
Speaker info: - https://www.linkedin.com/in/sandipanbhaumik
---
Watch along with the corrected transcript, summary, timestamps and resources on this talk's official AIE page: https://ai.engineer/talks/ObTPqBGsEbA-the-production-ai-playbook-deploying-agents-at-enterprise-scale
Join our upcoming AI Engineer conferences (see https://ai.engineer landing page):
- AIEi Shanghai, November 5–6 — the first for meeting top Chinese labs and engineers - AIE CODE in SF, November 10–12 — the top AI Coding conference returns - AIEi Sydney, December 7–8 — the first AIEi run alongside NeurIPS 2026 in Sydney
---
[Source](https://www.youtube.com/watch?v=ObTPqBGsEbA)