Google Overhauls Chrome DevTools MCP to Curb AI Agent Token Burn
AI Engineer
Autonomous coding agents require concise semantic summaries rather than raw runtime dumps, alongside deliberate human-in-the-loop friction to prevent prompt injection through the lethal trifecta.
AI-assisted summary of Building Agent Interfaces: Lessons from Chrome DevTools (MCP) for Agents — Michael Hablich, Google — original source. Check the original for full context.
Source published:
Key ideas
- Feeding raw browser performance traces of over 50,000 JSON lines saturated agent context windows into degraded reasoning zones, prompting Google's DevTools team to replace raw outputs with concise Markdown summaries focused on Core Web Vitals. (3:31)
- The Chrome DevTools MCP team established 'Tokens per Successful Outcome' as a core efficiency metric, evaluating task completion against token expenditure within specific workflow categories rather than across global product benchmarks. (8:09)
- Replacing a monolithic debugging tool with 25 granular endpoints shifted failure modes from inability to compose multi-step plans to tool selection ambiguity, highlighting that tool descriptions serve as the graphical UI for language models. (15:26)
- To prevent Simon Willison's 'lethal trifecta' of security vulnerabilities, DevTools deliberately preserved autoconnect friction and explicit human consent prompts instead of auto-authorizing live browser sessions. (18:33)
Detailed notes
## Background Published by the AI Engineer channel on YouTube on June 5, 2026, this talk features Michael Hablich, Product Manager for Chrome Developer Tools at Google. Hablich reflects candidly on the iterative failures and breakthroughs in building the Chrome DevTools Model Context Protocol (MCP) server, detailing how the team moved from monolithic tools and context-saturating JSON files to an optimized, agent-centric architecture.
## TL;DR Hablich presents four core engineering lessons learned from treating AI coding agents as a distinct user class with unique cognitive and context constraints. The DevTools team replaced massive 50,000-line JSON traces with concise semantic Markdown summaries and established 'Tokens per Successful Outcome' to evaluate interface fuel efficiency. To help agents self-heal, they rewrote opaque error messages into deterministic recovery instructions and balanced tool discoverability between an unwieldy 25-tool surface and an aggressive 3-tool 'slim mode.' Finally, Hablich outlines a three-tier security model, defending the deliberate preservation of user-consent friction to mitigate prompt injection risks and Simon Willison's 'lethal trifecta.'
## Atmosphere & style The presentation is candid, pragmatic, and refreshingly humble, characterized by an engineering leader openly dissecting his team's past missteps. Hablich speaks with conversational clarity and dry humor, acknowledging how counterintuitive agent behavior proved when treating models like ordinary machines. The room feels intensely engaged, bridging high-level interface philosophy with concrete developer empathy, and building toward an empowering vision of expanding traditional UX into agent experience.
## Bulletin - [03:31](https://www.youtube.com/watch?v=_B4Pv9ttFgY&t=211s) Feeding raw browser performance traces of over 50,000 JSON lines saturated agent context windows into degraded reasoning zones, prompting Google's DevTools team to replace raw outputs with concise Markdown summaries focused on Core Web Vitals. - [08:09](https://www.youtube.com/watch?v=_B4Pv9ttFgY&t=489s) The Chrome DevTools MCP team established 'Tokens per Successful Outcome' as a core efficiency metric, evaluating task completion against token expenditure within specific workflow categories rather than across global product benchmarks. - [15:26](https://www.youtube.com/watch?v=_B4Pv9ttFgY&t=926s) Replacing a monolithic debugging tool with 25 granular endpoints shifted failure modes from inability to compose multi-step plans to tool selection ambiguity, highlighting that tool descriptions serve as the graphical UI for language models. - [18:33](https://www.youtube.com/watch?v=_B4Pv9ttFgY&t=1113s) To prevent Simon Willison's 'lethal trifecta' of security vulnerabilities, DevTools deliberately preserved autoconnect friction and explicit human consent prompts instead of auto-authorizing live browser sessions.
## Key takeaways - [00:15](https://www.youtube.com/watch?v=_B4Pv9ttFgY&t=15s) Chrome DevTools for Agents provides an agent-agnostic interface via Model Context Protocol (MCP) and CLI surfaces, compatible with harnesses like Gemini CLI, Claude Code, and Codex. - [03:31](https://www.youtube.com/watch?v=_B4Pv9ttFgY&t=211s) Early agent integrations failed because developers incorrectly assumed software agents could effortlessly ingest multi-megabyte, 50,000-line raw JSON trace files without cognitive degradation. - [03:31](https://www.youtube.com/watch?v=_B4Pv9ttFgY&t=211s) Default agent interfaces should emit semantic Markdown summaries highlighting actionable signals like Largest Contentful Paint (LCP) and Interaction to Next Paint (INP) rather than exhaustive raw data dumps. - [05:24](https://www.youtube.com/watch?v=_B4Pv9ttFgY&t=324s) Autonomous agents represent a distinct user class with bottlenecks rooted in token budgets and semantic parsing, whereas human developers depend on spatial layout, typography, and visual cues. - [08:09](https://www.youtube.com/watch?v=_B4Pv9ttFgY&t=489s) Evaluating agent interfaces requires balancing functional effectiveness (task completion) against efficiency (tokens, execution time, and tool calls) through the metric 'Tokens per Successful Outcome.' - [08:09](https://www.youtube.com/watch?v=_B4Pv9ttFgY&t=489s) Measuring tokens per outcome without verifying successful task completion misleads teams, as fast failures appear artificially fuel-efficient. - [11:10](https://www.youtube.com/watch?v=_B4Pv9ttFgY&t=670s) Hiding niche tools behind explicit CLI flags prevents default prompt bloat and spares agent context windows on every interaction turn. - [11:10](https://www.youtube.com/watch?v=_B4Pv9ttFgY&t=670s) A minimal 'slim mode' exposing only three core primitives reduces prompt overhead, but trades away specialized runtime observability like network request monitoring. - [12:43](https://www.youtube.com/watch?v=_B4Pv9ttFgY&t=763s) Allowing agents to chain terminal commands locally (e.g., piping grep into click actions) cuts token consumption by avoiding round-trips of raw DOM trees through the model. - [12:43](https://www.youtube.com/watch?v=_B4Pv9ttFgY&t=763s) Rewriting opaque error strings into actionable recovery messages allows agents to self-heal and re-route plans autonomously without human intervention. - [12:43](https://www.youtube.com/watch?v=_B4Pv9ttFgY&t=763s) Injecting proactive detours into tool responses nudges models away from slow legacy behaviors (like default Lighthouse audits) toward modern tracing tools. - [15:26](https://www.youtube.com/watch?v=_B4Pv9ttFgY&t=926s) Decomposing single monolithic tools into 25 granular endpoints exposes agents to tool selection ambiguity, with research showing 97% of MCP tool descriptions contain quality smells. - [15:26](https://www.youtube.com/watch?v=_B4Pv9ttFgY&t=926s) Tool schemas must balance clear activation triggers and standardized terminology (e.g., explicit Core Web Vitals acronyms) against the prompt tax imposed by verbose descriptions. - [18:33](https://www.youtube.com/watch?v=_B4Pv9ttFgY&t=1113s) Removing authorization friction for convenience exposes users to the lethal trifecta, where private browser data, untrusted inputs, and automated tool execution intersect. - [18:33](https://www.youtube.com/watch?v=_B4Pv9ttFgY&t=1113s) Browser agent security must be tiered across local human-in-the-loop environments, isolated containerized CI workflows, and hardened sandbox environments for open-web navigation.
## Detailed walkthrough ### [00:15](https://www.youtube.com/watch?v=_B4Pv9ttFgY&t=15s) Introduction and Context: Chrome DevTools for Agents
Michael Hablich introduces the session on building agent interfaces, surveying the audience on their familiarity with Model Context Protocol (MCP) servers and command-line interface (CLI) tooling. Virtually the entire room reports already running MCP servers or CLI tools in their agent workflows, while roughly half have directly built and deployed MCP servers. Speaking on behalf of the Chrome DevTools team at Google, Hablich sets out to share four hard-earned engineering lessons drawn from building and shipping Chrome DevTools for agents.
To ground the discussion, Hablich contrasts the familiar human-facing developer tooling with its new autonomous counterpart. Built directly into Google Chrome, standard DevTools serves millions of web developers daily to inspect pages, identify runtime errors, run accessibility or security audits, and capture performance profiles. Chrome DevTools for Agents, by contrast, is purpose-built from the ground up for autonomous coding agents. Hablich demonstrates a live recording of Gemini CLI communicating through the DevTools MCP server: the agent triggers Chrome to launch on the right-hand display, executes a performance trace, digests the resulting performance insight, applies code modifications to accelerate page load, and independently validates that the target page actually runs faster. The architecture is agnostic to the host; while shown on Gemini CLI, Hablich emphasizes that it functions interchangeably inside Claude Code, Codex, OpenClaw, or any MCP-compliant agent harness.
Hablich briefly introduces himself as the Product Manager for Chrome Developer Tools at Google, bringing 20 years of tech experience spanning development, testing, QA, and program management, alongside guest lecturing at a nearby university.
```mermaid flowchart LR accTitle: Chrome DevTools MCP Architecture accDescr: An MCP client interacts with the Chrome DevTools MCP Server to control Google Chrome for debugging and profiling.
subgraph Client["Agent Environment"] Agent["Agent Harness / CLI<br/>(Gemini CLI, Claude Code)"] end
subgraph MCP["Protocol Layer"] Server["Chrome DevTools<br/>MCP Server"] end
subgraph Browser["Runtime Environment"] Chrome["Google Chrome<br/>(Target Web Page)"] end
Agent -->|"MCP tool call"| Server Server -->|"Automates & profiles"| Chrome Chrome -->|"Trace & page data"| Server Server -->|"Semantic summary / result"| Agent ```
[03:31](https://www.youtube.com/watch?v=_B4Pv9ttFgY&t=211s) The 50,000-Line Trace Mistake and Semantic Summaries
Around eighteen months prior, the team observed that coding agents were remarkably adept at code synthesis, yet effectively “flying blind” because they lacked real-time visibility into the browser runtime to validate the behavior of the code they generated. Under the initial assumption that software agents are machines and could effortlessly consume arbitrary volumes of data, the team fed raw performance trace profiles directly into common agent harnesses.
This assumption backfired completely. A standard DevTools performance trace is a massive JSON file spanning multiple megabytes and upwards of 50,000 lines of low-level runtime events. Bombarding an agent with a raw trace immediately saturated its context window, degrading its reasoning abilities into what Matt's conference talk dubbed the "dump zone." Hablich admits the mistake candidly: “We assumed they are going to be fine if we throw a lot of data at them. Because I mean, they are machines, right? The thing is, we were wrong.”
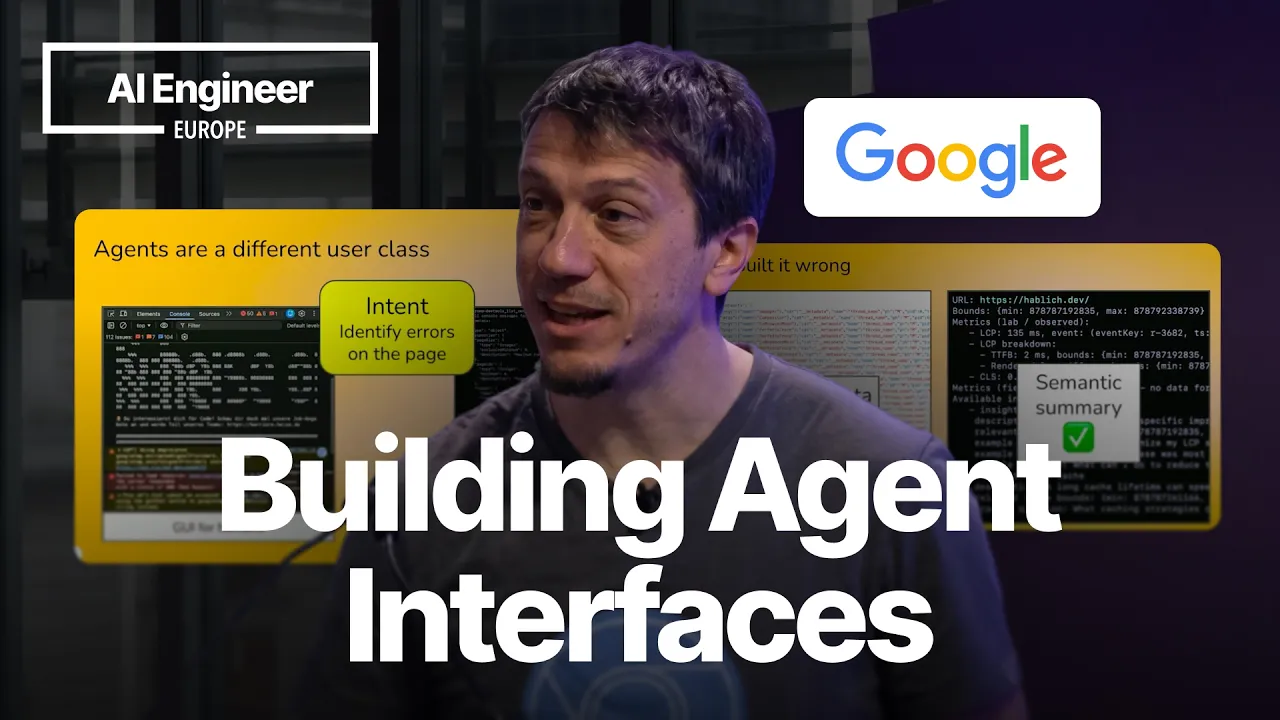
To resolve this failure mode, the DevTools team completely redesigned the output layer of their tracing endpoints. While raw JSON traces remain accessible for external post-processing tools, the default interface now synthesizes the raw capture into concise Markdown documents featuring semantic summaries. Instead of parsing tens of thousands of raw engine events, the agent receives high-level Core Web Vitals metrics, such as Largest Contentful Paint (LCP) and Interaction to Next Paint (INP). As Hablich explains the shift: “Well, essentially, we didn't force the agent to read the entire book, the trace, but instead we just pointed it at the right sentence, and this is the semantic summary.”
- Raw performance trace exports frequently exceed multiple megabytes and 50,000 lines of serialized JSON. - Context saturation directly pushes language models into degraded reasoning performance (the "dump zone"). - Default agent endpoints replace raw event logs with pre-digested Markdown summaries highlighting Core Web Vitals (e.g., LCP, INP).
[05:24](https://www.youtube.com/watch?v=_B4Pv9ttFgY&t=324s) Agents as a Distinct User Class
The realization prompted the DevTools team to conceptualize autonomous agents as a fundamentally separate user segment. While human engineers and software agents share identical operational goals—such as discovering bugs, fixing layout regressions, or resolving performance bottlenecks—they operate through completely distinct cognitive constraints.
Human developers are fundamentally visual thinkers who depend on spatial layouts, typography, graphical waterfall charts, and color cues to isolate anomalies within dense interfaces. Agents, conversely, possess different bottlenecks centered on context limits, semantic comprehension, and text token consumption, demanding interface architectures that surface concise, structured signals rather than visual representations.
[08:09](https://www.youtube.com/watch?v=_B4Pv9ttFgY&t=489s) Fuel Efficiency: Tokens per Successful Outcome
To quantify interface quality for agents, Hablich defines two complementary dimensions: effectiveness and efficiency. Effectiveness evaluates functional intent—whether an agent successfully navigates the full user journey from start to finish. Efficiency measures resource consumption along the way, including token burn, cumulative tool calls, and overall execution time. Hablich synthesizes these into a core operational metric: **Tokens per Successful Outcome**.
Hablich cautions against common pitfalls when applying this metric. High efficiency is meaningless in isolation: “Fuel efficiency is relatively worthless if you can't reach your destination.” Measuring raw "tokens per outcome" without factoring in task success obscures whether an agent failed quickly or succeeded frugally. Furthermore, Hablich warns against attempting to benchmark tokens per successful outcome as a single global KPI across an entire product. A simple, linear task like scraping structured text from a webpage naturally consumes far fewer tokens than an open-ended, highly interactive debugging session investigating a broken responsive design layout across multiple viewport breakpoints.
Presenting an internal evaluation dashboard illustrated with neon progress bars, Hablich explains that each bar represents a specific developer use case, with bar length indicating the operational effectiveness of the interface. Short bars pinpoint workflows where agents struggle or waste tokens, identifying high-priority targets for interface refactoring. Hablich emphasizes that while measuring this metric involves complexity, having directional data is essential: “The thing is, but even an imperfect measurement is better than simply doing gut-driven decisions.”
- **Effectiveness:** Binary verification of whether the user journey was completed and the functional intent achieved. - **Efficiency:** The operational cost required to finish the task, measured in LLM token volume, tool invocation counts, and wall-clock time. - **Tokens per Successful Outcome:** A ratio measuring the interface's "fuel efficiency," valid only when evaluated within specific, isolated task categories rather than globally.
[11:10](https://www.youtube.com/watch?v=_B4Pv9ttFgY&t=670s) Three Techniques to Mitigate Token Burn
To reduce token burn and prevent context window exhaustion, the DevTools team implements three distinct tactical approaches: tool categorization, a stripped-down "slim mode," and an alternate CLI surface.
First, the team applies tool categorization to trim the default tool manifest. Specialized capabilities, such as tools dedicated to inspecting and debugging Chrome extensions, are hidden behind explicit command-line flags. Because the overwhelming majority of developers are not building browser extensions, injecting those tool definitions into the default prompt context imposes unnecessary overhead on every invocation.
Second, the team built an aggressive variant called "slim mode," which pushes tool reduction to its extreme by exposing only three primitive operations: `select_page`, `navigate_page`, and `evaluate_script`. While this keeps the initial context footprint remarkably compact, Hablich notes the inherent architectural trade-off: restricting available tools can force the model into redundant intermediate reasoning loops or render certain capabilities impossible. An agent relying solely on `evaluate_script`, for instance, cannot intercept or inspect raw network requests.
Finally, recognizing that different model types and coding agents thrive on different input modalities, the DevTools team offers a dedicated CLI interface alongside the MCP server. This provides nearly identical browser automation and inspection capabilities through scriptable terminal commands, accommodating agent workflows optimized for shell execution rather than structured tool schemas.
- **Tool Categorization:** Hides domain-specific tools (e.g., Chrome extension debugging) behind CLI parameters to keep the default system prompt lean. - **Slim Mode:** Exposes a minimal three-tool surface (`select_page`, `navigate_page`, and `evaluate_script`), trading away specialized observability (like network monitoring) for minimal context consumption. - **Dual MCP/CLI Architecture:** Offers both an MCP server endpoint and a CLI alternative to accommodate different coding agent harnesses and execution models.
[12:43](https://www.youtube.com/watch?v=_B4Pv9ttFgY&t=763s) Command Chaining and Self-Healing Error Recovery
Token efficiency can be dramatically improved by allowing agents to chain terminal commands together for local post-processing rather than dumping entire state trees back into the LLM context. In the example Hablich shares, an agent extracts an accessibility tree using a standard `grep` command, filters for the relevant control, and pipes the resulting element ID straight into a `click` command. Because all that intermediate filtering occurs directly on the local machine rather than round-tripping through the model, the token savings are substantial. Yet, as Hablich points out, optimization alone is not enough: “Efficiency is useless if your agent gets stuck.” Every single time an agent hits an unrecoverable wall, it burns through tokens attempting blind retries, hallucinating causes, and trying to parse what went wrong.
To combat this, the team treats error recovery as a spectrum consisting of three distinct layers: 1. **Actionable error messages**: Standard developer error strings are notoriously opaque to an LLM. In an early iteration, when navigation failed, the tool returned: `Unable to navigate back in currently selected page`. The agent had no idea why it failed or what to do next. By appending a concrete explanation—noting that no previous history entry existed—the agent was immediately able to alter its plan and self-heal without needing a human to intervene. 2. **Proactive detours**: Because underlying foundation models are heavily biased by their training corpora, they frequently reach for familiar legacy tools that may not fit modern workflows. When asked to evaluate page performance, agents routinely defaulted to kicking off a slow Lighthouse audit. DevTools MCP implemented proactive detours in tool responses, deliberately nudging the agent away from Lighthouse toward their dedicated `performance.start_trace` profiling tool instead. 3. **Diagnostic playbooks**: Recognizing that environment setup is inherently fragile, the team bundled diagnostic playbooks directly into agent skills. When developers struggle to configure the Chrome DevTools MCP server properly, a dedicated troubleshooting skill automatically detects the failure state and guides both the human and the agent through resolving configuration bottlenecks.
- Performing local operations like piping `grep` outputs into action commands offloads post-processing from the model context to the host machine. - Error recovery is an economic necessity; every failed step forces expensive model retries and context pollution. - Informative error states convert dead ends into deterministic recovery paths, granting agents true self-healing autonomy.
[15:26](https://www.youtube.com/watch?v=_B4Pv9ttFgY&t=926s) Tool Discoverability: From Monolith to 25 Tools
The initial architecture for Chrome DevTools MCP attempted to solve debugging with an all-in-one approach: a single monolithic tool called `debug_webpage`. An orchestration agent could call this endpoint with a broad prompt like, *"Hey, debug this webpage. There is some responsive layout that's not working."* While Hablich jokes that it felt elegant from a software engineering standpoint, in practice it fell apart because the model could not reliably reason through or compose multi-step browser interactions inside a single opaque call. In response, the team broke the monolith apart into 25 granular, focused tools. But replacing one design flaw immediately birthed another: “Because we traded that problem off to another. And that was agents now had 25 tools at their disposal. How are you going to find out which one to use when?”
Citing recent research showing that 97% of MCP tool descriptions suffer from "quality smells," Hablich argues that tool schemas must be treated with the same intentionality as graphical interfaces: “The schema is the UI for the agent.” However, rewriting schemas involves delicate trade-offs. Expanding tool descriptions bloats the system prompt, exhausting context windows and introducing token overhead on every turn. Furthermore, smaller models become heavily distracted or biased by verbose documentation, often triggering tools when they should not be touched at all.
To strike the right balance, the DevTools team focuses on two foundational rules: defining an unambiguous core purpose and setting strict activation criteria. For their performance tracing tool, the schema description explicitly highlights that it is used to diagnose front-end performance bottlenecks and Core Web Vitals such as Largest Contentful Paint (LCP), Interaction to Next Paint (INP), and Cumulative Layout Shift (CLS). Supplying these explicit acronyms enables the agent to map abstract user requests—like *"investigate why this page load feels sluggish"*—directly to the trace tool. While specialized workflow skills can supercharge complex tasks, Hablich warns they are not a silver bullet; overloading an agent with too many skills merely recreates the discoverability crisis at a higher level of abstraction.
- Moving from one monolithic tool (`debug_webpage`) to 25 modular endpoints shifted the failure mode from inability to compose to tool selection ambiguity. - Research reveals 97% of real-world MCP descriptions contain quality smells that directly confuse agent tool-calling logic. - Verbose descriptions create a prompt tax and risk biasing smaller language models toward calling unnecessary tools. - Effective activation schemas anchor on standardized terminology (such as Core Web Vitals: LCP, INP, CLS) to trigger correct routing.
[18:33](https://www.youtube.com/watch?v=_B4Pv9ttFgY&t=1113s) Trust Boundaries and the Lethal Trifecta
Chrome DevTools MCP includes a marquee capability called autoconnect, which lets a developer pair an agentic coding assistant (like Claude Code) directly to their live browser session. It essentially mirrors a pair-programming screen share where a stuck developer asks the agent to inspect the page and pinpoint rendering bugs. Almost immediately, users began demanding the removal of confirmation prompts: *"Why do I need to click allow all the time? Please remember my choice."* In standard product design, eliminating repeated permission dialogs is considered an obvious usability win. But in an agentic world where autonomous actors execute commands on behalf of users, Hablich emphasizes that convenience must take a back seat to security boundaries. The friction was preserved intentionally to defend against the security nightmare known as the "lethal trifecta" (a concept popularized by Simon Willison, where private data access, untrusted inputs, and external communication channels collide).
To establish robust safety guarantees, Hablich maps browser agent deployments across three escalating security tiers:
```mermaid flowchart TD accTitle: Browser Agent Security Tiers accDescr: Three-tiered trust hierarchy for browser agents ranging from local developer environments to untrusted web access.
subgraph T1["Tier 1: Local Development"] A["Human in the Loop"] -->|"Time-Bound Explicit Consent"| B["Default Chrome Profile & Session Data"] end
subgraph T2["Tier 2: CI / Controlled Automation"] C["Isolated Headless Fleet"] -->|"Network & State Isolation"| D["Containers & Ephemeral Profiles"] D -->|"Managed Access"| E["Remote Debugging Port"] end
subgraph T3["Tier 3: Full Internet / Autonomous Browsing"] F["Wild Web / YOLO Mode"] -->|"Untrusted Data Injection Risks"| G["Hardened Sandboxes & Domain Allowlists"] end ```
Tier 1 represents the local developer machine where the human remains directly in the loop. Because the agent connects to the user's primary Chrome profile containing authenticated sessions, personal cookies, and sensitive company data, access must be strictly time-bound and require manual consent for every connection. Tier 2 encompasses automated testing and continuous integration pipelines. These controlled, headless environments enforce structural data separation via Docker containers, ephemeral profiles, and dedicated remote debugging ports. Tier 3 is what Hablich candidly dubs "YOLO mode": autonomous agents navigating the open web, where arbitrary third-party pages can launch indirect prompt injection attacks. Tier 3 requires strict network allowlists, sandbox isolation, and aggressive prompt injection defenses. Hablich warns that while a local debugging assistant and a cloud-based web research agent might share underlying tool libraries like Chrome DevTools MCP, they must never share the same security assumptions.
- User requests to remember authorization choices were rejected because agent trust boundaries require explicit human gating. - Simon Willison's lethal trifecta explains the compounding risk when agents combine private browser state with untrusted web content and tool execution. - Local environments (Tier 1) demand time-bound, per-session human consent to protect default browser credentials. - CI environments (Tier 2) isolate execution using ephemeral profiles, containers, and explicit remote debugging ports. - Open-web browsing agents (Tier 3) operate in an untrusted threat landscape demanding strict domain allowlists and prompt injection mitigations.
[21:32](https://www.youtube.com/watch?v=_B4Pv9ttFgY&t=1292s) Four Core Takeaways for Agent Interfaces
Hablich closes by reframing how software teams must think about software design going forward: user experience is fundamentally widening to encompass "agent experience." AI agents represent a brand-new segment of end users, complete with their own non-functional requirements spanning computational efficiency, discoverability, stability, and system security.
To guide developers building tools, MCP servers, and interfaces for this emerging class of consumers, Hablich summarizes the Chrome DevTools journey into four operational tenets: 1. **Measure fuel efficiency**: Track *tokens per successful outcome* as the primary benchmark for interface design, optimizing payloads so models consume only what is necessary to complete a task. 2. **Turn errors into recovery playbooks**: Write error strings that diagnose the root cause and hand the model actionable next steps, unlocking autonomous self-healing. 3. **Audit descriptions for intent**: Craft tool schemas with precise activation triggers, guarding against ambiguity and context bloat. 4. **Never compromise trust for convenience**: Resist the temptation to strip out security guardrails, permissions, or confirmations for the sake of a frictionless user experience.
He leaves the audience with a guiding imperative for the agentic era: “Agents are our next users. Let's help them help us.”
- Interface builders must treat LLMs as first-class users with distinct operational and cognitive constraints. - Token consumption per completed task provides an objective metric for interface efficiency. - Preserving friction at critical trust boundaries protects users from autonomous privilege escalation and prompt injection vulnerabilities.
## Notable quotes > [15:26](https://www.youtube.com/watch?v=_B4Pv9ttFgY&t=926s) The schema is the UI for the agent. — Michael Hablich
> [12:43](https://www.youtube.com/watch?v=_B4Pv9ttFgY&t=763s) Efficiency is useless if your agent gets stuck. — Michael Hablich
> [21:32](https://www.youtube.com/watch?v=_B4Pv9ttFgY&t=1292s) Agents are our next users. Let's help them help us. — Michael Hablich
## Mentioned Michael Hablich, Google, Chrome DevTools, Model Context Protocol (MCP), Gemini CLI, Claude Code, Codex, OpenClaw, Matt, Core Web Vitals, Simon Willison, Lighthouse, Docker
## Video description Chrome DevTools MCP shipped with one tool: debug_webpage. Agents failed silently because they couldn't compose behaviors. The team decomposed it into 25 focused tools and assumed the problem was solved. It wasn't — now agents had 25 tools and no reliable way to pick the right one. Michael Hablich's talk is an honest account of building the same thing wrong three times and what the fixes actually looked like.
The concrete lessons: semantic summaries instead of raw 50,000 line JSON trace files, error messages rewritten so agents can self heal without a human in the loop ("Cannot navigate back, no previous page in history" instead of "Unable to navigate back in currently selected page"), a metric called tokens per successful outcome to measure interface fuel efficiency, and a deliberate decision to keep the autoconnect friction rather than remove it once they thought through prompt injection and the lethal trifecta.
Speaker info: - https://x.com/MHablich - https://www.linkedin.com/in/michael-hablich/
---
Watch along with the corrected transcript, summary, timestamps and resources on this talk's official AIE page: https://ai.engineer/talks/_B4Pv9ttFgY-building-agent-interfaces-lessons-from-chrome-devtools-mcp-for-agents
Join our upcoming AI Engineer conferences (see https://ai.engineer landing page):
- AIEi Shanghai, November 5–6 — the first for meeting top Chinese labs and engineers - AIE CODE in SF, November 10–12 — the top AI Coding conference returns - AIEi Sydney, December 7–8 — the first AIEi run alongside NeurIPS 2026 in Sydney
---
[Source](https://www.youtube.com/watch?v=_B4Pv9ttFgY)