Arize Deploys Alex to Automate Engineers Out of LLM Observability
AI Engineer
Because static code cannot audit nondeterministic systems, telemetry must serve as the primary audit layer while autonomous agents generate and run evaluations directly from execution traces.
AI-assisted summary of LLM Observability, Evaluation, Experimentation Platform — Dat Ngo, Arize — original source. Check the original for full context.
Source published:
Key ideas
- Code does not audit non-deterministic agents—telemetry does, requiring OpenTelemetry-native auto-instrumentation to trace dynamic execution paths and stateful sessions. (0:00)
- Agent evaluation spans five distinct signal flavors (LLM-as-a-judge, human feedback, golden datasets, deterministic checks, and business metrics) across four granular scopes from single spans to full conversational sessions. (5:00)
- Arize aims to eliminate manual dashboard interaction and evaluation writing through Alex, an autonomous AI layer that monitors traces, flags anomalies, and creates evals dynamically. (12:50)
- The platform offers Arize Phoenix as an open-source, single-container deployment requiring no Kubernetes, alongside the enterprise Arize AX for large-scale production workloads. (15:15)
Detailed notes
## Background Published by the AI Engineer channel on YouTube on June 7, 2026, this talk features Dat Ngo, an AI architect at Arize AI. The presentation addresses the challenge of debugging non-deterministic AI agents, explaining how telemetry acts as an audit layer and walking through evaluation signals, scoping, Arize Phoenix, and automated observability with Arize's Alex system.
## TL;DR Dat Ngo argues that modern AI architecture is fundamentally software reimagined, requiring telemetry rather than traditional code to audit non-deterministic agents and test harnesses. He outlines an OpenTelemetry-native approach that captures traces, spans, trajectories, and multi-turn sessions across complex graph execution paths. The talk details five key evaluation signals—LLM-as-a-judge, human feedback, golden datasets, deterministic checks, and business metrics—and explains how to scope them from single spans to full user sessions. Finally, Dat demonstrates how curated trace datasets power experimentation and previews Arize's internal agent, Alex, which aims to automate developers out of manual evaluation loops.
## Atmosphere & style The presentation is energetic, pragmatic, and delivered with casual developer humor, featuring jokes about burning through hundreds of billions of tokens, 'vibing it out,' and forgetting to switch off dark mode for stage demos. Dat strips away AI mysticism to speak directly to seasoned builders as peers, establishing an authentic, technical camaraderie. The session feels fast-paced and grounded, transforming messy non-deterministic agent debugging into an actionable, disciplined systems engineering challenge.
## Bulletin - [00:00](https://www.youtube.com/watch?v=JsCCrBF7F1g&t=0s) Code does not audit non-deterministic agents—telemetry does, requiring OpenTelemetry-native auto-instrumentation to trace dynamic execution paths and stateful sessions. - [05:00](https://www.youtube.com/watch?v=JsCCrBF7F1g&t=300s) Agent evaluation spans five distinct signal flavors (LLM-as-a-judge, human feedback, golden datasets, deterministic checks, and business metrics) across four granular scopes from single spans to full conversational sessions. - [12:50](https://www.youtube.com/watch?v=JsCCrBF7F1g&t=770s) Arize aims to eliminate manual dashboard interaction and evaluation writing through Alex, an autonomous AI layer that monitors traces, flags anomalies, and creates evals dynamically. - [15:15](https://www.youtube.com/watch?v=JsCCrBF7F1g&t=915s) The platform offers Arize Phoenix as an open-source, single-container deployment requiring no Kubernetes, alongside the enterprise Arize AX for large-scale production workloads.
## Key takeaways - [00:00](https://www.youtube.com/watch?v=JsCCrBF7F1g&t=0s) Modern AI engineering reduces to standard software discipline across three foundational pillars: observability, evaluations, and experimentation. - [00:00](https://www.youtube.com/watch?v=JsCCrBF7F1g&t=0s) Traditional static code and unit tests cannot audit non-deterministic agentic workflows; runtime telemetry serves as the true audit layer. - [00:00](https://www.youtube.com/watch?v=JsCCrBF7F1g&t=0s) OpenTelemetry-native auto-instrumentation captures execution traces and multi-turn stateful sessions using a single line of code. - [05:00](https://www.youtube.com/watch?v=JsCCrBF7F1g&t=300s) Macro distributional graph views are necessary to identify traffic divergence across branches, uncover latency bottlenecks, and diagnose dependency-ordering hallucinations. - [05:00](https://www.youtube.com/watch?v=JsCCrBF7F1g&t=300s) Signal extraction requires five complementary evaluation types: LLM-as-a-judge, human feedback, expert golden datasets, deterministic code checks, and bottom-line business KPIs. - [05:00](https://www.youtube.com/watch?v=JsCCrBF7F1g&t=300s) LLM observability platforms must bridge two personas: AI engineers building programmatic pipelines and non-technical domain experts writing evals via UI templates. - [10:00](https://www.youtube.com/watch?v=JsCCrBF7F1g&t=600s) Evaluation must be scoped intentionally across single spans, multi-spans, full trajectories, and multi-turn sessions to balance holistic insight against evaluation inference costs. - [11:47](https://www.youtube.com/watch?v=JsCCrBF7F1g&t=707s) Observability data creates a continuous feedback loop by allowing engineers to filter failed production traces directly into benchmark datasets for iterative prompt and model experimentation. - [12:50](https://www.youtube.com/watch?v=JsCCrBF7F1g&t=770s) Arize exposes CLI tools, skills, and MCP definitions designed for seamless integration with coding agents like Claude Code and Codex. - [12:50](https://www.youtube.com/watch?v=JsCCrBF7F1g&t=770s) Arize's ultimate architectural goal is automating engineers out of the observability loop using Alex, an AI system that plans tasks, diagnoses latency spikes, and authors test suites autonomously. - [15:15](https://www.youtube.com/watch?v=JsCCrBF7F1g&t=915s) Arize Phoenix provides a lightweight, open-source tracing option deployable as a single container without Kubernetes, while Arize AX supports high-scale enterprise infrastructure.
## Detailed walkthrough ### [00:00](https://www.youtube.com/watch?v=JsCCrBF7F1g&t=0s) Reimagining Software: Telemetry as the Audit Layer for Agents
Dat Ngo introduces himself as an AI architect at Arize AI, explaining that his day-to-day work centers on observability, evaluation, and experimentation across the world’s largest enterprises. Looking back on the scale of enterprise deployments over the previous year, Dat quips that between the prior OpenAI DevDay and the present, he personally burned through “somewhere between 100 billion and 1 trillion tokens last year.” While he jokes about liking to “vibe it out,” he stresses that the unique vantage point of Arize AI reveals the deep architecture patterns, common pains, and remediation strategies used by leading teams. Surveying the audience on who has built, deployed, or productionized agents and test harnesses, he remarks that the room is clearly “pretty cracked.”
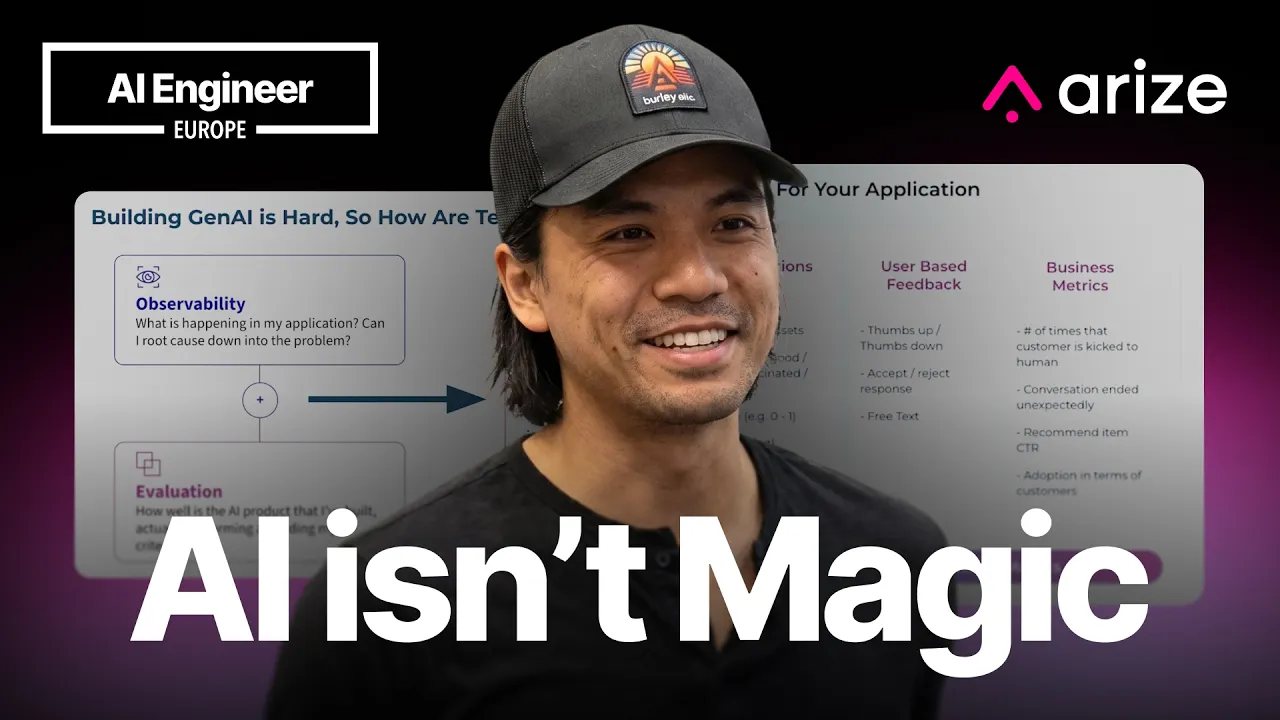
Demystifying the hype around artificial intelligence, Dat argues that modern AI architecture is fundamentally familiar: “The AI space, it really just feels like software reimagined.” Stripping away the feeling of magic, it reduces to standard engineering discipline across three major pillars:
1. **Observability**: Asking what is actually happening inside an agent or harness during execution. 2. **Evaluations (Evals)**: Extracting reliable signal from systems to judge behavior and quality. 3. **Experimentation**: Navigating non-deterministic updates where fixing one bug often produces two or three unexpected regressions.
Dat underscores that Arize is built entirely OpenTelemetry-first (OTel-native). Rather than forcing teams to adopt custom proprietary logging wrappers, developers can drop in a standard auto-instrumenter using a single line of code. That single line intercepts execution within the framework or SDK, automatically capturing OpenTelemetry traces and spans. Emphasizing why this architectural foundation is mandatory for non-deterministic software, Dat points out: “Because now we know that code doesn’t audit agents or harnesses. It’s actually the telemetry that does that.”
Beyond raw trace-and-span execution trees, modern observability demands aggregate scopes like sessions and runs. Pointing to the recent Anthropic paper *Managed Agents*, Dat notes that sessions capture stateful, back-and-forth multi-turn interactions. In enterprise production environments, stakeholders frequently do not want to inspect low-level tool calls for every interaction; instead, they need to evaluate the entire conversational session to verify whether the customer was satisfied and had their problem fully resolved.
```mermaid flowchart TD accTitle: OpenTelemetry Agent Instrumentation Pipeline accDescr: An agent runtime uses a one-line auto-instrumenter to emit traces and spans into Arize for session and trajectory analysis.
subgraph Runtime["Agent Runtime Environment"] A["Agent / Harness Execution"] -->|"1-line auto-instrumenter"| B["OpenTelemetry (OTel) Collector"] end
subgraph Observability["Arize Observability Layer"] B --> C["Traces & Spans\n(Low-level execution record)"] B --> D["Sessions & State\n(Multi-turn interaction context)"] C --> E["Distributional Views &\nTrajectory Evals"] D --> F["User Satisfaction &\nResolution Metrics"] end ```
[05:00](https://www.youtube.com/watch?v=JsCCrBF7F1g&t=300s) Graph Trajectories and the Five Flavors of Evaluation Signal
Switching his interface into light mode so the audience can see clearly, Dat shows Arize AX to illustrate how to inspect complex, non-deterministic agents across large-scale traffic distributions. Rather than analyzing single isolated execution runs, enterprise teams need a distributional graph view showing every potential path, branch, and loop their agent can traverse. This macro view answers critical architectural questions: what percentage of total production traffic diverts down Branch A versus Branch B, and which specific component within an uncommon branch is responsible for sudden latency spikes?
Dat highlights trajectory evals as the key mechanism for debugging agent behavior. For instance, an agent might perform exceptionally well along one execution path, but on an alternative path, signal quality plummets. Using graph telemetry, developers can diagnose subtle root causes that traditional unit tests miss entirely: “These two components are actually out of order. I did B before A, and actually B has a dependency on A.” Telemetry exposes where the underlying model hallucinated the execution sequence or inverted dependencies, indicating that additional prompt guardrails or context are needed to enforce execution order.
Turning to evaluations, Dat insists that observability is only step one; engineers must systematically capture signal. He categorizes signal into five concrete flavors:
- **LLM-as-a-Judge**: Running automated model-based evaluations. While conceptualized simply, running robust model evaluations in production becomes deeply complex. - **Human Feedback**: Gathering direct telemetry from end users and internal reviewers, providing ground truth on product utility for technical leads and product managers alike. - **Golden Datasets**: High-trust benchmark datasets curated by domain experts. Teams run LLM-as-a-judge prompts across golden datasets to continuously tune and align the judge model to approximate trusted human domain scoring. - **Deterministic Logic Checks**: Inexpensive, non-LLM, code-level validators. For example, validating whether a paragraph-to-JSON transformation produces valid JSON matching a strict schema with non-null required fields, saving unnecessary model inference costs. - **Business Metrics**: Ground-level Key Performance Indicators (KPIs) mapped directly to corporate utility—specifically asking whether the system makes money, saves money, or saves time.
Dat notes that scaling AI products requires uniting two distinct personas: technical AI engineers who excel at systems engineering, harnesses, and programmatic pipelines, and non-technical subject matter experts (SMEs) or product managers who understand the desired user experience and domain nuances. Tooling must support both worlds: technical users can attach and trigger evals programmatically via code, while non-technical domain experts can select models, configure pre-built templates, or write custom judge prompts through a dedicated user interface without touching code.
[10:00](https://www.youtube.com/watch?v=JsCCrBF7F1g&t=600s) Granularity and Scope in LLM Evaluations
When building an application, agent, or harness, system components may execute deterministically or non-deterministically. To understand whether these components function properly, evaluation cannot just be treated as a monolith; teams must decide the exact scope and depth at which their evals run. At the most granular level is the single span eval, which simply examines the input and output pairs of an isolated component, such as an individual LLM call. Moving up one layer, multi-span evals come into play when an evaluation depends on data distributed across multiple components—for instance, evaluating how effectively multiple agents pass contextual data back and forth to one another.
```mermaid flowchart TD accTitle: Evaluation Scopes Hierarchy accDescr: Diagram illustrating the four scopes of evaluation from granular span to session level.
subgraph Granular ["Component Level"] S1["Single Span Eval<br/>(One LLM call input/output)"] S2["Multi-Span Eval<br/>(Cross-agent data passing)"] end
subgraph Holistic ["System & Journey Level"] S3["Trajectory Eval<br/>(Execution order & business steps)"] S4["Session Level Eval<br/>(Full conversation & user state machine)"] end
S1 --> S2 S2 --> S3 S3 --> S4 ```
Beyond isolated components, teams must monitor broader behavior across an execution run through trajectory evals and session-level evals. A trajectory eval inspects the full sequence of spans to determine whether the agent executed calls in the proper sequence to achieve the target business process. Zooming out further, session-level evals inspect the full state machine of a user interaction across time, answering holistic questions like whether a customer expressed frustration or whether all of their inquiries were resolved. However, teams should avoid running exhaustive evaluations across every conceivable metric because doing so quickly becomes cost-prohibitive. As Dat Ngo explains:
> “You want to see like, hey, what are the minimal set of evals I can get away with to understand signal of like, is my application working as intended because there's a cost associated with this stuff, right?”
- **Single Span Eval**: Inspects the input and output of a single component or LLM call. - **Multi-Span Eval**: Pulls data across distinct interacting components (e.g., verifying context exchange between cooperating agents). - **Trajectory Eval**: Evaluates all spans across an execution path to ensure steps followed the intended workflow. - **Session-Level Eval**: Evaluates overall conversation dynamics, state transitions, customer sentiment, and task completion.
---
[11:47](https://www.youtube.com/watch?v=JsCCrBF7F1g&t=707s) Driving Experimentation and Iteration from Datasets
Once observability data exists, it directly feeds into the experimentation and improvement workflow. Teams that capture traces can filter for problematic signals, identify missing information or failed logic, and curate those traces directly into clean evaluation datasets. For teams that do not yet have production traces, datasets can be uploaded directly as raw tables of input-output pairs.
With structured datasets in hand, developers can run iterative experiments either through the Arize UI or programmatically. Experimentation fundamentally revolves around testing modifications across core application levers: swapping foundation models, refining system prompts, updating orchestration logic, or adjusting parameter configurations. Tracking these experiments against golden datasets allows teams to measure whether proposed updates genuinely improve agent behavior or introduce regressions before deploying them to production.
---
[12:50](https://www.youtube.com/watch?v=JsCCrBF7F1g&t=770s) Automating Developers Out of the Observability Loop with Alex
Observability tooling is experiencing a major shift away from manual interaction. Most developers do not want to spend their working hours clicking around dashboards, flipping switches, or manually writing evaluation criteria. Because software authoring is compressing and becoming heavily agent-driven, Arize exposes its primitives directly through a command-line interface, skills, and tool definitions compatible with coding assistants such as Claude Code and Codex.
```mermaid flowchart LR accTitle: Automated Observability Flywheel accDescr: Flowchart showing how coding agents and Alex interact with traces and evaluation generation.
subgraph DevEnvironment ["Developer Environment"] Agent["Coding Agent<br/>(Claude Code / Codex / CLI)"] end
subgraph ArizePlatform ["Arize Platform & Tracing Engine"] Alex["Alex AI System"] Traces["Application Traces<br/>& Latency Hooks"] GenEval["Dynamic Eval Creation"] end
Agent <-->|"Queries / Invokes"| Alex Traces -->|"Telemetry Data"| Alex Alex -->|"Flags Latency & Errors"| GenEval ```
To eliminate the manual overhead entirely, Arize built an internal AI agent called Alex. Developers or external coding agents can directly task Alex with inspecting system health simply by asking if it spots issues in the application. Because the platform has direct hooks into trace telemetry, Alex autonomously plans and executes analytical tasks, identifying anomalies such as elevated latency clusters or error spikes. Dat Ngo envisions a self-driving observability flywheel where engineers no longer manually curate their tests:
> “Our ultimate goal as a company is actually to automate you out of this process.”
> “We are very heavy believers that you shouldn't even have to choose your evals.”
- **Autonomous Evaluation**: Alex evaluates trace history dynamically to detect regressions and author new test suites on the fly without human prompting. - **Coding Agent Interoperability**: Telemetry hooks, tools, and primitives can be invoked straight from CLI tools and environments like Claude Code. - **Trace-Driven Diagnostics**: Alex autonomously scans trace feeds to surface bottlenecks, latency spikes, and error patterns.
---
[15:15](https://www.youtube.com/watch?v=JsCCrBF7F1g&t=915s) Open Source Phoenix vs. Enterprise Arize AX
Arize serves two distinct deployment environments depending on organizational scale and architectural needs. For engineers looking for a lightweight, developer-first solution, Arize Phoenix is offered completely open source. Phoenix runs as a self-contained, single-container deployment that can be run entirely on a local machine without needing a complex Kubernetes cluster.
For large-scale enterprise deployments, the company provides Arize AX, designed to support high-throughput, mission-critical infrastructure for enterprise customers like Uber, Booking.com, and Reddit. Dat Ngo wraps up the session with a playful self-critique regarding Arize's heavy preference for dark mode across its user interfaces, noting that they should probably remember to switch to light mode occasionally for demos, before inviting developers to connect and explore the ecosystem.
## Notable quotes > [00:00](https://www.youtube.com/watch?v=JsCCrBF7F1g&t=0s) Because now we know that code doesn’t audit agents or harnesses. It’s actually the telemetry that does that. — Dat Ngo
> [12:50](https://www.youtube.com/watch?v=JsCCrBF7F1g&t=770s) We are very heavy believers that you shouldn't even have to choose your evals. — Dat Ngo
## Mentioned Dat Ngo, Arize AI, OpenAI DevDay, OpenTelemetry, Anthropic, Managed Agents, Arize AX, Alex, Claude Code, Codex, Arize Phoenix, Kubernetes, Uber, Booking.com, Reddit
## Video description Your agent called tool B before tool A, and B has a dependency on A. You did not catch it because nothing in your code audits agents. The telemetry does. Dat from Arize AI walks through what observability actually means when the system you are debugging is nondeterministic and the execution path changes with every run.
The talk covers the five flavors of eval signal (LLM as judge, human feedback, golden datasets, deterministic checks, business metrics), what scope to run them at (single span, multispan, trajectory, session), and where this is heading. Arize Phoenix is open source, runs as a single container, no Kubernetes required. The enterprise product adds an AI layer called Alex that scans traces, surfaces high latency and errors, and creates evals automatically. The stated goal: automate you out of the observability loop entirely.
Speaker info: - https://www.linkedin.com/in/datdarylngo/ - https://x.com/dat_attacked
---
Watch along with the corrected transcript, summary, timestamps and resources on this talk's official AIE page: https://ai.engineer/talks/JsCCrBF7F1g-llm-observability-evaluation-experimentation-platform-dat-ngo-arize-ai
Join our upcoming AI Engineer conferences (see https://ai.engineer landing page):
- AIEi Shanghai, November 5–6 — the first for meeting top Chinese labs and engineers - AIE CODE in SF, November 10–12 — the top AI Coding conference returns - AIEi Sydney, December 7–8 — the first AIEi run alongside NeurIPS 2026 in Sydney
---
[Source](https://www.youtube.com/watch?v=JsCCrBF7F1g)