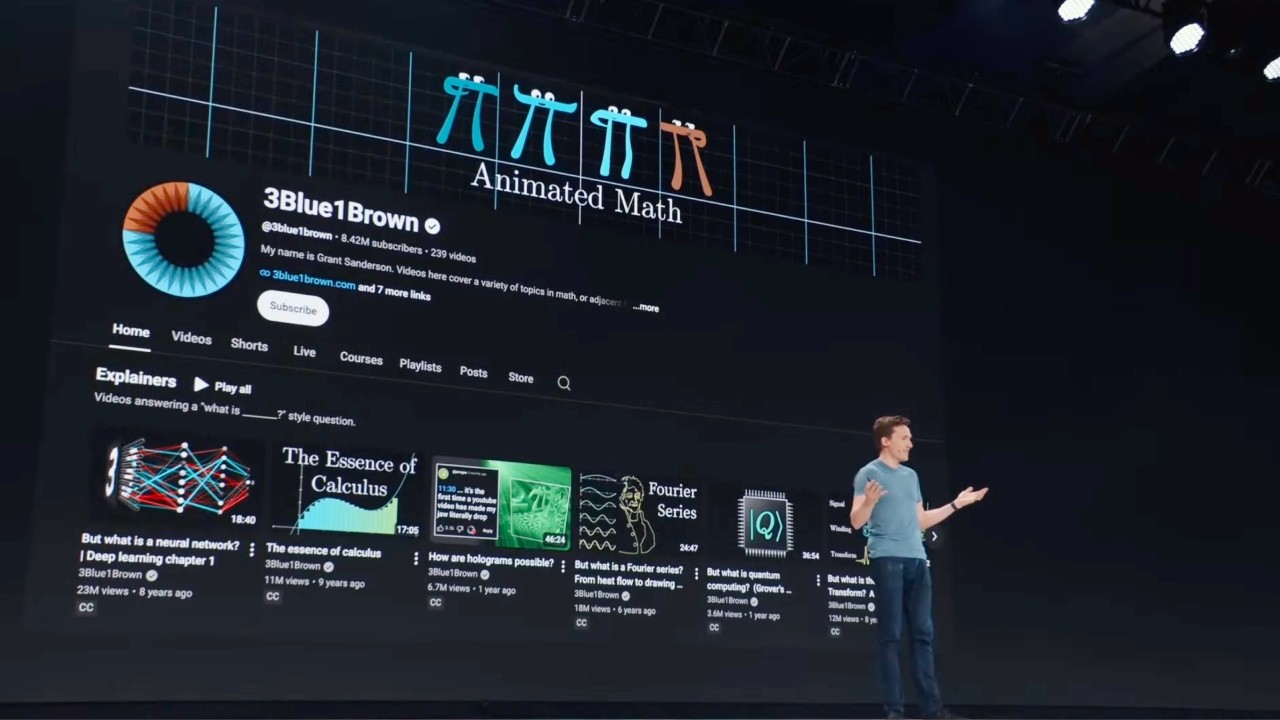
Grant Sanderson Maps Euler Formula to Escher Art at Figma Config
Figma
Mathematical explanation functions as a design discipline where abstract formulas only resonate when communicators show what they look like, give their variables explicit motivation, and ground them in unexpected visual applications.
Grant Sanderson frames mathematical communication as a visual design discipline, using Euler's formula ($e^{i\pi} = -1$) to illustrate how deliberate visual choices turn abstract calculations into intuitive spatial concepts. (2:05)
The algebraic identity $e^{i\pi} = -1$ can be geometrically justified through imaginary velocity vectors, which enforce a perpetual 90-degree orthogonal relationship to position, producing uniform circular motion around the complex unit circle. (12:47)
Dutch mathematicians Bart de Smit and Hendrik Lenstra mathematically resolved M.C. Escher's paradoxical lithograph 'Print Gallery' by mapping the image into complex logarithmic space, rotating it, and exponentiating it back to close the self-referential loop. (18:04)
Sanderson outlines three core principles for mathematical explanation: visually answering 'what does it look like,' establishing clear motivations for mathematical components, and anchoring concepts in surprising, non-traditional applications. (24:14)
Detailed notes
## Background
Published on YouTube by Figma on June 26, 2026, this Config 2026 keynote features Grant Sanderson, creator of the channel 3Blue1Brown. According to the video description, the presentation explores how mathematics—often perceived as static and rote—is actually an expressive space defined by creativity and perspective shifts, examining how design principles shape the discovery and communication of mathematical ideas.
## TL;DR
Using Euler's identity ($e^{i\pi} = -1$) as a primary design challenge, Grant Sanderson illustrates how deliberate aesthetic and pedagogical choices can make complex mathematics intuitive. He contrasts the visual artifact of a converging Taylor series spiral against a dynamic calculus model where imaginary time locks velocity perpendicular to position, demonstrating why circular motion and the value $-1$ are geometric inevitabilities. Sanderson then connects complex exponentiation to fine art, explaining how mathematicians Bart de Smit and Hendrik Lenstra applied complex logarithms and exponential maps to unravel the seamless, self-referential spiral in M.C. Escher's lithograph *Print Gallery*. Throughout the presentation, he distills three core design principles for explanation—asking what a concept looks like, giving mathematical characters clear motivations, and leaning into surprising applications—before concluding that all designers are fundamentally teachers.
## Atmosphere & style
The presentation carries an energetic, intellectually invigorating keynote atmosphere, beginning with playful morning banter from Figma Chief Design Officer Lorna Croshawn before plunging directly into unapologetic mathematical depth. Sanderson communicates with warmth, humility, and infectious curiosity, engaging the room of designers as peers navigating complexity rather than as passive students. The viewing experience moves from analytical clarity to genuine aesthetic delight, highlighted by an audible ripple of applause when Sanderson's animations twist Escher's nested paradox into a seamless, rotating reality.
## Bulletin
- [02:05](https://www.youtube.com/watch?v=bLSLN96Gn-w&t=125s) Grant Sanderson frames mathematical communication as a visual design discipline, using Euler's formula ($e^{i\pi} = -1$) to illustrate how deliberate visual choices turn abstract calculations into intuitive spatial concepts.
- [12:47](https://www.youtube.com/watch?v=bLSLN96Gn-w&t=767s) The algebraic identity $e^{i\pi} = -1$ can be geometrically justified through imaginary velocity vectors, which enforce a perpetual 90-degree orthogonal relationship to position, producing uniform circular motion around the complex unit circle.
- [18:04](https://www.youtube.com/watch?v=bLSLN96Gn-w&t=1084s) Dutch mathematicians Bart de Smit and Hendrik Lenstra mathematically resolved M.C. Escher's paradoxical lithograph 'Print Gallery' by mapping the image into complex logarithmic space, rotating it, and exponentiating it back to close the self-referential loop.
- [24:14](https://www.youtube.com/watch?v=bLSLN96Gn-w&t=1454s) Sanderson outlines three core principles for mathematical explanation: visually answering 'what does it look like,' establishing clear motivations for mathematical components, and anchoring concepts in surprising, non-traditional applications.
## Key takeaways
- [02:05](https://www.youtube.com/watch?v=bLSLN96Gn-w&t=125s) Mathematics and design share the identical challenge of navigating overwhelming choices and high complexity to chart a clean, intuitive path for viewers.
- [03:52](https://www.youtube.com/watch?v=bLSLN96Gn-w&t=232s) In the complex plane, the imaginary unit $i$ geometrically represents a $90^\circ$ counterclockwise rotation rather than an abstract impossible quantity.
- [05:52](https://www.youtube.com/watch?v=bLSLN96Gn-w&t=352s) The traditional arithmetic definition of exponentiation fails for complex powers, requiring higher mathematics to redefine $e^x$ through an infinite Taylor series expansion.
- [05:52](https://www.youtube.com/watch?v=bLSLN96Gn-w&t=352s) Plotting the Taylor series for $e^{i\pi}$ creates an inward spiral that converges tightly to $-1$ because factorials in the denominators grow faster than powers of $\pi$.
- [05:52](https://www.youtube.com/watch?v=bLSLN96Gn-w&t=352s) Design Principle 1: Treat math explanation as a visual design challenge by actively seeking what an abstract expression looks like spatially.
- [09:30](https://www.youtube.com/watch?v=bLSLN96Gn-w&t=570s) Base $e$ fundamentally represents exponential dynamics where position directly dictates velocity, creating a runaway feedback loop for growth and decay.
- [12:47](https://www.youtube.com/watch?v=bLSLN96Gn-w&t=767s) Introducing imaginary time ($e^{it}$) sets velocity orthogonal to position, forcing motion into a uniform circle of radius 1 at a constant speed of 1 unit per second.
- [12:47](https://www.youtube.com/watch?v=bLSLN96Gn-w&t=767s) Euler's identity $e^{i\pi} = -1$ reflects traveling an arc length of $\pi$ units around a unit circle over $\pi$ seconds, directly reaching $-1$.
- [12:47](https://www.youtube.com/watch?v=bLSLN96Gn-w&t=767s) Design Principle 2: Give every mathematical component transparent motivations, bridging the gap between mechanical verification and intuitive understanding.
- [16:17](https://www.youtube.com/watch?v=bLSLN96Gn-w&t=977s) M.C. Escher's 1956 lithograph 'Print Gallery' intuitively nested an observer within the artwork they are viewing, leaving a central hole that baffled mathematicians for decades.
- [21:02](https://www.youtube.com/watch?v=bLSLN96Gn-w&t=1262s) The complex exponential function maps vertical grid lines onto expanding concentric circles, geometrically resembling rolling the complex plane into a cylinder and squishing it flat.
- [21:02](https://www.youtube.com/watch?v=bLSLN96Gn-w&t=1262s) Transforming nested imagery into complex logarithmic space unwraps infinite concentric zooms into repeating, linearly tiled vertical strips.
- [24:14](https://www.youtube.com/watch?v=bLSLN96Gn-w&t=1454s) Rotating and scaling coordinates in log space before exponentiating back into screen space generates the seamless logarithmic spiral underlying Escher's scene.
- [24:14](https://www.youtube.com/watch?v=bLSLN96Gn-w&t=1454s) Design Principle 3: Leverage unexpected and surprising applications—such as artistic spatial transformations—to make abstract mathematical concepts endure in memory.
- [26:34](https://www.youtube.com/watch?v=bLSLN96Gn-w&t=1594s) All design functions as communication and pedagogy; professionals must view themselves as teachers tasked with explaining why their work matters.
## Detailed walkthrough
### [00:13](https://www.youtube.com/watch?v=bLSLN96Gn-w&t=13s) Introduction: Math as a Creative Medium
Lorna Croshawn, Figma’s Chief Design Officer, opens the second day of Config by addressing the attendees, jokingly acknowledging that many had stayed up late socializing and experimenting with motion and shaders. Setting a playful tone, she introduces the morning’s opening topic as a "chill subject: math." Croshawn reflects on her personal journey from music school to design, noting that she struggled with math until she saw it intersect with subjects she loved—first sound, followed by visuals and animation. Framed through that lens, math shifts from a dry, mechanical discipline into an expressive space full of choices, ideas, and creativity that reshape how one perceives the world.
She then introduces the session's speaker, Grant Sanderson, creator of the YouTube channel *3Blue1Brown*. Croshawn highlights Sanderson’s impact in demystifying advanced mathematical topics through intuitive animation, noting his creation of the open-source Python graphics library Manim, his lectures at MIT, his contributions to an Emmy Award–winning documentary, and his work with Khan Academy. As she puts it, anyone who has ever watched a *3Blue1Brown* video and suddenly understood a concept they had previously given up on already knows the power of what Sanderson brings to education.
- Lorna Croshawn is the Chief Design Officer at Figma.
- Grant Sanderson is the creator of the mathematical animation channel *3Blue1Brown* and the creator of Manim.
- Sanderson's background includes lecturing at MIT, producing animations for an Emmy-winning documentary, and collaborating with Khan Academy.
[02:05](https://www.youtube.com/watch?v=bLSLN96Gn-w&t=125s) The Intersection of Mathematics, Design, and Euler's Formula
Grant Sanderson takes the stage and shares that for roughly eleven years, he has pursued a single obsession through his channel: seeking out subjects that risk becoming hopelessly complex and uncovering the exact visual representation that unlocks their core meaning. He notes that while mathematicians and designers might seem like fundamentally different species at first glance, both disciplines share identical core objectives. Both practitioners find themselves submerged in an overwhelming abundance of choices with tremendous potential for complexity, and both are tasked with charting a clean, intuitive path through that space.
Sanderson centers his talk on applying design principles to the craft of math communication, focusing on an iconic equation that has appeared repeatedly across his videos: $e^{i\pi} = -1$. Because this single formula can be visualized and explained in radically distinct ways depending on the specific question being asked, it serves as the ultimate test case for design decisions. Over the talk, he frames the equation around three separate questions, each pairing a visual perspective with a broader design principle. He assures the audience that he assumes maximum curiosity and will not water down the math, diving straight into imaginary exponentials. As Sanderson states: “In both cases, you find yourself awash in a situation with an abundance of choice and a large potential for complexity. And you're trying to find a clear path through it.”
```mermaid
flowchart TD
accTitle: Euler's Formula Inquiry Framework
accDescr: A diagram mapping the central equation to three investigative questions and their resulting visual and design insights.
Eq["Euler's Identity: e^(i*pi) = -1"]
subgraph Questions["Three Design Inquiries"]
Q1["Question 1: What does it mean?"]
Q2["Question 2: Why does it want to be true?"]
Q3["Question 3: How does it generalize?"]
end
- Sanderson has spent about 11 years producing math animations for *3Blue1Brown*.
- The talk investigates Euler's identity ($e^{i\pi} = -1$) through three sequential visual perspectives.
- The overarching thesis posits that wherever there is an abundance of choices in explanation, intentional design is required.
[03:52](https://www.youtube.com/watch?v=bLSLN96Gn-w&t=232s) Deconstructing the Symbols: Pi, i, and Rotation in the Complex Plane
To tackle the first question—*What does this expression even mean?*—Sanderson breaks down each symbol in $e^{i\pi} = -1$. Starting with $\pi$, he explains that while it is traditionally defined as the ratio of a circle's circumference to its diameter, mathematicians typically prefer thinking in terms of the unit circle (radius of 1), where $\pi$ represents the exact distance halfway around the circle. Next, he turns to $i$, the so-called "imaginary constant." Sanderson remarks that calling it imaginary is somewhat silly, as it is no more imaginary than ordinary real numbers. While defined by the property $i^2 = -1$, its true spatial purpose is extending numbers from the familiar one-dimensional number line into a full two-dimensional plane.
For designers, Sanderson emphasizes that developing fluency with complex numbers offers a powerful mental model for manipulating 2D space. A complex number takes the form $a + bi$, where the real component $a$ dictates horizontal movement and the imaginary component $b$ dictates vertical movement. Sanderson urges the audience to internalize a single geometric intuition: multiplying by $i$ represents a $90^\circ$ rotation. Multiplying a real number $a$ by $i$ rotates it $90^\circ$ counterclockwise onto the vertical imaginary axis to become $ai$. Multiplying an imaginary number $bi$ by $i$ yields $b \cdot i^2$, which becomes $-b$, rotating it another $90^\circ$ onto the negative real axis. By extension, multiplying the combined vector $a + bi$ by $i$ rotates the entire number by $90^\circ$. As Sanderson summarizes: “If you see I, you think a thing that wants to rotate by 90 degrees.”
- $\pi$ represents the distance traveled halfway around a unit circle (radius 1).
- $i$ is defined algebraically by $i^2 = -1$, but acts geometrically as a $90^\circ$ counterclockwise rotation.
- In the complex plane ($a + bi$), $a$ governs horizontal left-right motion, while $b$ governs vertical up-down motion.
[05:52](https://www.youtube.com/watch?v=bLSLN96Gn-w&t=352s) Principle 1: Exponentiation as a Taylor Series and Visual Design
Sanderson tackles the final component of the expression: base $e$ raised to an imaginary power. School curricula typically introduce exponentiation as repeated multiplication, where $e^x$ means multiplying $e \approx 2.7$ by itself $x$ times. However, this model completely breaks down when the exponent is an imaginary number, because multiplying a base by itself $i\pi$ times is nonsensical. In higher mathematics, the true meaning of $e^x$ is rooted in calculus, defined via an infinite polynomial (its Taylor series expansion). While discovering that the repeated multiplication of real numbers equals this infinite polynomial is a genuine mathematical breakthrough, mathematicians perform a subtle sleight of hand when dealing with exotic inputs: they redefine exponentiation by declaring that the infinite series *is* the formal definition of $e^x$.
Visualizing this infinite series for $e^{i\pi}$ demonstrates the power of visual design in explanation:
1. The first term, $1$, draws a vector one unit to the right along the real axis.
2. Adding the linear term, $i\pi$, points upward by $\pi$ units along the imaginary axis.
3. The quadratic term, $\frac{1}{2}(i\pi)^2$, involves $i^2 = -1$, rotating the vector direction by $90^\circ$ twice to point back toward the left.
4. The cubic term contains $(i\pi)^3 = -i\pi^3$, rotating three times ($270^\circ$) to point downward.
Because each successive power of $i$ adds another $90^\circ$ rotation, the sum traces a spiraling path in the complex plane. Crucially, the factorial in the denominators grows far faster than the powers in the numerator, causing the vector segments to shrink rapidly. As a result, the chaotic spiral collapses tightly around a single point on the real axis: $-1$.
Sanderson uses this walk-through to establish the first design principle: treat math explanation as a visual design challenge by always asking, *what does it look like?* While not every concept must be visualized, asking this question yields substantial educational rewards. As Sanderson observes: “Simply asking that question is often the difference between sitting in a room in silence trying to read sheet music versus listening to the song.” Nevertheless, Sanderson cautions that visual illustration alone remains incomplete: seeing that the spiral lands on $-1$ does not explain *why* it resolves to such a clean number, leading to the necessity of building deeper intuition before attempting formal proof.
- Classical repeated multiplication fails for complex exponents; modern math redefines $e^x$ through an infinite series.
- The terms of the series $\sum \frac{(i\pi)^n}{n!}$ rotate by $90^\circ$ at each step due to powers of $i$.
- Rapidly growing factorial denominators force the spiral to converge tightly onto $-1$.
- First Design Principle: Treat math explanation as a visual design challenge by asking what the concept looks like.
[09:30](https://www.youtube.com/watch?v=bLSLN96Gn-w&t=570s) Exponential Growth, Decay, and the Meaning of $e$
To unravel Euler's formula, Grant Sanderson shifts perspective from the function $e^x$ to $e^t$, where $t$ represents time. The core defining characteristic—what Sanderson calls "the thing that brings $e$ to life"—is that it is a function whose rate of change equals itself. He models $e^t$ as a position moving along the real number line, starting at an initial condition of $1$ because any base raised to the power of zero equals $1$. Because its rate of change must always match its position, Sanderson imagines a velocity vector whose value is permanently locked to that position vector.
As time plays forward from $t = 0$, the velocity vector pushes the position to the right, causing it to grow. But as the position grows larger, the velocity must correspondingly increase, which in turn accelerates growth even more. This runaway positive feedback loop constitutes the visceral sensation of exponential growth. When both the position and rate of change are locked in exact parity, that defines exponential growth specifically with base $e$.
```mermaid
flowchart LR
accTitle: The Feedback Loop of Exponential Growth
accDescr: A cyclic feedback loop showing how position and velocity continuously amplify each other in base e exponential growth.
subgraph Dynamics["Exponential Feedback (Base e)"]
direction LR
P["Position (e^t) grows"] -->|"Increases"| V["Velocity (d/dt e^t)"]
V -->|"Pushes rightward"| P
end
```
Sanderson introduces a touch of calculus via the chain rule to demonstrate what happens when a constant scales time. If a factor of $2$ is placed in the exponent ($e^{2t}$), time intuitively runs twice as fast; the rate of change becomes twice the expression itself ($2e^{2t}$), causing the runaway growth to accelerate even more aggressively. Conversely, introducing a negative constant such as $-0.5$ ($e^{-0.5t}$) acts like running time backward while shrinking the velocity. Visually, the negative sign flips the velocity vector $180^\circ$ toward the left (toward zero), while the magnitude of $0.5$ squishes it. As the position moves leftward toward zero, the shrinking distance forces the velocity vector to diminish as well. The movement slows down as it approaches zero without ever reaching it, capturing the physical sensation of exponential decay.
- Initial condition for $e^t$: at $t = 0$, position is locked at $1$ ($e^0 = 1$).
- Defining equation for $e^t$: $\frac{d}{dt}e^t = e^t$ (velocity vector equals position vector).
- Chain rule with positive scaling: for $e^{2t}$, velocity is locked to $2 \times \text{position}$.
- Chain rule with negative scaling: for $e^{-0.5t}$, velocity points leftward and scales by $0.5 \times \text{position}$, producing asymptotic decay toward zero.
---
[12:47](https://www.youtube.com/watch?v=bLSLN96Gn-w&t=767s) Imaginary Time and Rotation: Why $e^{i\pi} = -1$ Must Be True
With the dynamic relationship between position and velocity established, Sanderson poses the core question: what does it mean to place the imaginary unit $i$ in front of time ($e^{it}$)? While "imaginary time" sounds like something found in a "quantum crystal shop," it becomes concrete when recalling the fundamental purpose of $i$: multiplication by $i$ represents a $90^\circ$ counterclockwise rotation. Combining the defining identity of $e$ with the geometric action of $i$ reveals a direct, visual rule: wherever the position vector is at any given time, its velocity vector must be a $90^\circ$ rotation of that position vector.
Because the initial velocity at $t = 0$ is perpendicular to the real axis, the position is immediately pulled off the real number line and into the two-dimensional complex plane. As time progresses, the velocity vector remains perpendicular to the position vector while matching it in length. Sanderson observes that there is only one trajectory that satisfies this constraint: uniform circular motion around the origin. Because the velocity vector matches the radius in magnitude (a unit circle of radius $1$), the position must traverse the perimeter at a constant speed of exactly one unit per second.
```mermaid
flowchart TD
accTitle: Circular Motion Governed by Imaginary Time
accDescr: Flowchart illustrating how e raised to the power of it locks velocity at a 90-degree angle to position, resulting in circular motion.
subgraph ComplexPlane["Complex Plane Dynamics"]
P["Position vector: z = e^(it)"]
V["Velocity vector: dz/dt = i * e^(it)"]
P -->|"Multiplied by i (90° rotation)"| V
V -->|"Locks direction orthogonal to radius"| C["Uniform circular motion at 1 unit/sec"]
end
```
Letting time run for exactly $\pi$ seconds means traveling a distance of $\pi$ units along the circumference of a unit circle—landing precisely halfway around at $-1$. This provides the structural justification for Euler's formula: it is not a bizarre numerical accident that the infinite Taylor series sum spirals into $-1$; the geometry dictates that it could never be otherwise.
From this insight, Sanderson extracts a central design principle for mathematical exposition:
> “The same is true in math. Nothing is different in math. Give your characters motivation.”
Just as characters in a novel fail to connect unless their motivations are transparent, mathematical components must each have a clearly defined reason for existence. Applying this perspective back to the Taylor series expansion, letting $t$ vary in $e^{it}$ shows the partial sums dynamically tracing a circle. While the series visual shows *what* is happening, the calculus-based velocity view clarifies *why* it must happen. Combining both views marries genuine mystery with deeply satisfying explanation.
- Rule of imaginary velocity: $\frac{d}{dt}e^{it} = i \cdot e^{it}$, locking velocity at a $90^\circ$ angle to position.
- Circular motion speed: exactly $1\text{ unit/second}$ along the unit circle.
- Half-turn duration: elapsed time of $\pi\text{ seconds}$ covers arc length $\pi$, landing directly at position $-1$.
- Second explanation design principle: give every component of a theorem, formula, or concept an explicit motivation or "reason for existence."
---
[16:17](https://www.youtube.com/watch?v=bLSLN96Gn-w&t=977s) Motivation and M.C. Escher's *Print Gallery*
Transitioning to broader educational design, Sanderson addresses what he calls "Education 101": before an audience can learn, they must be motivated to learn, typically through practical applications. While electrical engineers might connect with signal processing and physicists with quantum mechanics, Sanderson chooses an unexpected, left-field application tailored to a room of designers: fine art, specifically understanding a single, famous print.
He walks the audience through a mental tour of *Print Gallery* by Dutch graphic artist M.C. Escher. The viewer imagines standing inside an exhibition space looking at a framed print of a boat docked in a harbor. Looking closely, the harbor borders a town with various buildings. Looking further, one of those buildings turns out to be an open-air print gallery. Scanning through the exhibition hall of that very building, you discover yourself standing there, looking at the picture of the boat.
Sanderson highlights Escher's legendary status among mathematicians, noting his unique ability to construct two-dimensional paradoxes that flirt with infinity and self-contradiction. Yet among his entire body of work, Escher held this particular drawing in unique regard. Sanderson notes that in a personal letter to his son, Escher singled out *Print Gallery*, writing that it was:
> “The most peculiar thing I have ever created.”
- Conference audience context: Config (designers), leading Sanderson away from standard engineering or physics examples toward visual art.
- Core artwork discussed: *Print Gallery* (1956) by M.C. Escher.
- Narrative loop of the piece: A young man views a print of a harbor town containing the very gallery in which he stands, creating a paradoxical self-referential cycle.
Grant Sanderson highlights the mathematics underlying M.C. Escher's famous lithograph *Print Gallery*, an image whose formal mathematical structure even Escher himself did not fully understand. Sanderson notes that this topic was the focus of one of his favorite YouTube projects, a deep dive spanning roughly 45 minutes. To illustrate the core concept, Sanderson shows a straightened-out version of Escher’s scene: a young man stands in an open-air print gallery looking at a picture of a boat in a harbor; the harbor sits beside a town filled with buildings; and inside one of those buildings sits the very same print gallery containing the man, creating an image deeply nested within itself.
While infinite nesting is an intriguing concept, Sanderson emphasizes that nesting alone does not capture the true Escher-style genius:
> “Escher somehow intuitively realized that there must be a way to take this concept and kind of pull out that inner version of that world nested within itself and pull it out to connect with the outer version.”
Sanderson presents an animation executing this exact topological feat. The audience breaks into applause as the inner nested scene stretches outward, twisting dynamically until it locks into place with the outer world. Sanderson quips that while he made the animation, he cannot claim credit for the mathematical foundation behind it. Escher approached printmaking as an intuitive, tactile folk artist, and this exact visualization would have blown his mind. The underlying mechanism treats every pixel on the image plane as a complex number governed by complex functions—a breakthrough discovered roughly fifty years after the artwork's creation by Dutch mathematicians Bart de Smit and Hendrik Lenstra.
```mermaid
flowchart LR
accTitle: Unfolding Escher's Nested Print Gallery
accDescr: Diagram illustrating how the nested scene is expanded and aligned with the outer image using complex transformations.
subgraph NestedScene["Original Perspective"]
A["Man in gallery"] --> B["Picture of boat in harbor"]
B --> C["Town with print gallery"]
C --> D["Deeply nested inner scene"]
end
subgraph Transformation["Complex Analysis Transformation"]
D -->|"Pull out inner world"| E["Rotated and scaled space"]
E -->|"Align boundaries"| F["Seamless Escher closed loop"]
end
```
[21:02](https://www.youtube.com/watch?v=bLSLN96Gn-w&t=1262s) Visualizing the Complex Exponential $e^z$ and Its Inverse
To explain how de Smit and Lenstra pulled off their analysis, Sanderson shifts from real-valued variables to complex numbers, denoting the exponential map as $e^z$. Rather than examining localized movements, he challenges the audience to adopt a global, visual perspective: what does this function do to the entire two-dimensional complex plane? Recall that tracing upward along a purely imaginary vertical line (multiples of $i$) maps the output to a unit circle. Shifting one unit right on the input plane scales that trajectory up by a factor of $e$; shifting two units right scales it to a circle with radius $e^2$. Thus, every vertical grid line transforms into a concentric circle centered at the origin.
To hold this global mapping in mind, Sanderson constructs an intuitive geometric visual:
> “And what I like to imagine is sort of rolling up that plane into a tube, so that we've turned all those vertical lines into circles, and then specifically it's circles with radius one to start, so every kind of $2\pi$ units, that's when you're repeating.”
By centering that cylindrical tube directly above the output plane and squishing it flat, the vertical lines become concentric circles expanding exponentially at a rate of $e$. In this context, de Smit and Lenstra were acting like artists wielding a novel paintbrush: complex functions. Their primary inverse tool was the complex natural logarithm ($\ln(z)$), which performs the reverse operation by unwrapping concentric rings of pixels back into straight vertical lines. When applied to an image with self-similar zooming, each zoom factor of $e$ shifts the straightened line by one unit, turning a self-nested infinite zoom into a repeating, manageable tiled strip.
- Purely imaginary inputs (vertical line at $\text{Re}(z) = 0$) wrap periodically around a unit circle every $2\pi$ units.
- Moving horizontally across vertical lines at $x = 1, 2, \dots$ scales circle radii exponentially by $e, e^2, \dots$.
- The exponential map rolls the plane into a tube of circumference $2\pi$ and flattens it radially onto the output plane.
- The complex natural logarithm reverses this operation, unwrapping concentric circular bands of pixels into linear strips.
[24:14](https://www.youtube.com/watch?v=bLSLN96Gn-w&t=1454s) Painting in Log Space and the Power of Surprising Applications
Sanderson details the high-level recipe de Smit and Lenstra developed to reconstruct Escher’s grid, which also happens to be the secret behind his own animation. They started with the straightened-out, nested image of the gallery and mapped it into log space, yielding a bizarre, unwrapped panoramic grid. In this logarithmic coordinate system, they performed a precise rotation and scaling. Applying the exponential function to transform the rotated log coordinates back into standard screen space bends the straight lines into the signature logarithmic spiral of *Print Gallery*, perfectly closing the loop between the observer and the observed scene.
```mermaid
flowchart TD
accTitle: The de Smit and Lenstra Escher Loop Transformation
accDescr: High-level sequence showing how log space rotation creates the seamless Escher spiral.
A["Straightened nested scene"] -->|"Natural Logarithm ln(z)"| B["Unwrapped periodic log space"]
B -->|"Precise rotation & scaling"| C["Tilted periodic grid"]
C -->|"Exponential Function e^z"| D["Closed Escher spiral image"]
```
This artistic application illustrates Sanderson's third core design principle for explaining math:
> “It's not obvious that studying imaginary exponentials and complex functions lets you achieve an artistic aim. But, I think when you see how it does, it burns in your brain just a little bit longer than if I was just talking about applications to technology.”
While educators instinctively reach for applications in science and engineering to motivate concepts, Sanderson argues that the most surprising applications leave the deepest imprint. He recaps the three design principles explored throughout the talk:
- **Visual Design:** Ask directly, *“What does it look like?”* to discover intuitive geometric representations.
- **Narrative Motivation:** Uncover the motivations of your mathematical characters, which marks the critical difference between a mechanical proof and an illuminating explanation.
- **Surprising Applications:** Choose unexpected, delightful applications—such as artistic spatial manipulation—to make abstract ideas stick in the audience's mind.
[026:34] The Intersection of Design and Teaching
Grant Sanderson concludes his presentation by turning outward to the audience, leaving them with the perspective that regardless of their formal titles, everyone present is fundamentally an educator. While some individuals may hold roles that are explicitly focused on explanation, he argues that all forms of design are inherently attempts at clear communication. At an absolute baseline, every professional is a teacher because everyone must eventually communicate what they do and justify why their work matters to other people. As Grant puts it: “And at minimum, everyone is a teacher, cuz everyone has the role of trying to explain what they do and why it matters to others.”
To put this mindset into practice, Grant challenges the audience to set aside half an hour during the day to reflect on their own pedagogy and see where their personal teaching philosophies intersect with design craft. He emphasizes that the relationship between these disciplines is a two-way street: just as mathematics can serve design by providing distinct creative paintbrushes for transforming and manipulating two-dimensional space, design is fundamentally in service of pedagogy and explanation. Grant urges the crowd to lean into that synthesis, stating: “And the more that we try to understand the intersection between those two, the more successfully we'll achieve the ends of both.” With that final reflection, he thanks the audience and concludes the talk to warm applause.
- **Actionable Takeaway**: Take 30 minutes to contemplate personal principles of teaching and examine how they align with, influence, and reinforce design principles.
- **The Dual Relationship**: Mathematics supplies the tools and computational "paintbrushes" for manipulating space in design, while design provides the framework required for effective, clear mathematical explanation.
## Notable quotes
> [26:34](https://www.youtube.com/watch?v=bLSLN96Gn-w&t=1594s) And at minimum, everyone is a teacher, cuz everyone has the role of trying to explain what they do and why it matters to others. — Grant Sanderson
> [24:14](https://www.youtube.com/watch?v=bLSLN96Gn-w&t=1454s) It's not obvious that studying imaginary exponentials and complex functions lets you achieve an artistic aim. But, I think when you see how it does, it burns in your brain just a little bit longer than if I was just talking about applications to technology. — Grant Sanderson
## Mentioned
Figma, Config 2026, Grant Sanderson, 3Blue1Brown, Lorna Croshawn, Manim, Khan Academy, MIT, Leonhard Euler, M.C. Escher, Print Gallery, Bart de Smit, Hendrik Lenstra
## Video description
For many who have a bad relationship with math, it is often because the subject can come across as static and rote. Those who have been fortunate enough to see what the subject truly is know that it is rife with creativity, choices, and regular shifts in perspective that fundamentally reshape how you view problems. Where there is choice, there is design, and this talk will explore various design challenges and principles that go into presenting and discovering math.
This is 'Designing Math' with Grant Sanderson aka 3Blue1Brown - Live from Config 2026
____________________________________________________
Find us on ⬇️
X (formerly Twitter): https://x.com/figma
Instagram: https://www.instagram.com/figma
LinkedIn: https://www.linkedin.com/company/figma
TikTok: https://tiktok.com/@figma
Figma forum: https://forum.figma.com/
At Figma's Config conference, 3Blue1Brown creator Grant Sanderson argues that mathematical communication and design share the core challenge of carving a clean path through abundant choices and complexity. Using Euler's identity ($e^{i\pi} = -1$) as a case study, Sanderson outlines three foundational principles: framing explanations as visual design challenges, giving mathematical components clear motivations, and anchoring abstract ideas in surprising applications.
Visualizing Equations Beyond Classical Arithmetic (5:52)
Sanderson argues that explaining mathematical concepts requires treating exposition as a visual design challenge by continually asking what a concept looks like. Traditional schooling defines exponentiation as repeated multiplication, but this framework collapses when handling imaginary exponents like $e^{i\pi}$. In higher mathematics, exponentiation is formally redefined using an infinite polynomial Taylor series. By translating each term of the series into vectors in the complex plane, algebraic operations become concrete geometric motions.
Because the imaginary unit $i$ geometrically represents a $90^\circ$ counterclockwise rotation, each successive power of $i$ in the series pivots the vector by a right angle. Meanwhile, rapidly growing factorial denominators cause the segment lengths to shrink quickly. The resulting sum traces an inward-collapsing spiral that converges tightly on $-1$. While this visual walk-through proves that the expression reaches $-1$, Sanderson notes that visualization alone merely shows what happens, highlighting the need for deeper intuition to explain why.
Providing Internal Motivation Through Dynamic Calculus (12:47)
To explain why Euler's identity resolves so cleanly, Sanderson turns to a dynamic model of calculus, emphasizing his second design principle: mathematical components must be given clear motivations, much like characters in a narrative. The constant $e$ comes alive when defined by its rate of change matching its position ($d/dt(e^t) = e^t$). In standard real-valued exponential growth, position and velocity form a positive feedback loop along the number line, accelerating to the right or decaying asymptotically toward zero when scaled by a negative rate.
When the imaginary constant $i$ is introduced into the exponent ($e^{it}$), its geometric property of $90^\circ$ rotation forces the velocity vector to remain continuously perpendicular to the position vector. In two-dimensional space, the only trajectory satisfying this condition is uniform circular motion around the origin at a constant speed of one unit per second. Consequently, letting time run for $\pi$ seconds traverses an arc length of $\pi$ along the unit circle, naturally landing precisely halfway around at $-1$. This calculus-based perspective supplies the underlying reason why the Taylor series spiral must terminate at that exact value.
Engaging Audiences Through Unexpected Artistic Applications (21:02)
Sanderson's third principle posits that abstract theories become far more memorable when introduced through surprising applications rather than standard technical examples. To illustrate complex functions to designers, he examines M.C. Escher's 1956 lithograph Print Gallery, which depicts a young man in an exhibition viewing a print of a harbor town that contains the very gallery in which he stands. Decades after Escher completed the work intuitively, Dutch mathematicians Bart de Smit and Hendrik Lenstra proved that the print's self-referential paradox is governed by complex analytic transformations.
De Smit and Lenstra resolved the drawing's infinite nesting by operating in logarithmic space. Because the complex exponential function $e^z$ maps vertical lines into concentric circles and rolls the plane into an expanding tube, its inverse—the complex natural logarithm $\ln(z)$—unwraps concentric, self-similar zooms into flat, repeating vertical strips. By tilting and rotating the scene's grid inside logarithmic coordinates before mapping it back with the exponential function, the mathematicians reconstructed Escher’s seamless, closed logarithmic spiral. Sanderson highlights this as evidence that complex numbers serve as creative design tools for manipulating 2D space.
The Reciprocal Discipline of Design and Teaching
Sanderson concludes by framing design and education as reciprocal crafts. He asserts that all professionals are fundamentally teachers because everyone must eventually explain their work and articulate its value to others. In this relationship, mathematics supplies design with computational and conceptual frameworks for spatial transformation, while design offers mathematics the communication discipline needed to make complex abstractions clear and intuitive.
Sanderson challenges designers and communicators to dedicate time to analyzing their personal teaching philosophies alongside their design practice. He maintains that deliberately synthesizing the visual problem-solving of design with the formal rigor of mathematical exposition enhances both disciplines, turning potentially dry mechanics into compelling, accessible ideas.
Source quotes
[26:34] Grant Sanderson: And at minimum, everyone is a teacher, cuz everyone has the role of trying to explain what they do and why it matters to others.
[24:14] Grant Sanderson: It's not obvious that studying imaginary exponentials and complex functions lets you achieve an artistic aim. But, I think when you see how it does, it burns in your brain just a little bit longer than if I was just talking about applications to technology.
Original transcript
[0:13] Hello.
[0:19] >> Hello Config. Are you ready for day two?
[0:23] There we go. Let's go. I'm Lorna
[0:26] Croshawn, Figma's Chief Design Officer,
[0:28] and I'm excited to welcome you to the
[0:31] second day of Config. I'm going to
[0:33] introduce our first speaker of the day.
[0:35] Now, I know many of you were up late
[0:37] hanging out with friends and playing
[0:39] with motion and shaders.
[0:42] I've seen all of your work online. Keep
[0:44] it coming.
[0:45] So, to start us off today, we went with
[0:47] with a chill subject, math.
[0:51] Now, math is often misunderstood. I
[0:54] should know, I went to music school and
[0:55] I didn't get math until it connected
[0:58] with something that I loved.
[1:00] Uh in my case, first sound, then
[1:03] visuals, animation.
[1:05] When you look at it that way, math
[1:07] becomes a field full of creativity,
[1:10] ideas, choices that fundamentally change
[1:12] how you see the world.
[1:14] Our next speaker helped millions
[1:17] discover math in this way. He's the
[1:20] creator of 3Blue1Brown,
[1:22] a YouTube channel that uses animation to
[1:24] bring math to life.
[1:26] He built the open source library Manim
[1:29] to power it.
[1:30] He lectured at MIT, contributed to an
[1:33] Emmy Award-winning documentary,
[1:36] and worked with Khan Academy.
[1:38] And if you've ever watched one of his
[1:39] videos and all of the sudden understood
[1:41] something that you had given up on,
[1:44] well, then you know what he does.
[1:46] Welcome to the stage, Grant Sanderson.
[1:51] >> [music]
[1:59] >> Thank you.
[2:05] >> For the last 11 years or so, I have had
[2:08] an obsession. Um as mentioned, I run a
[2:10] YouTube channel. I've been making videos
[2:12] about visualizing math. And the
[2:14] obsession is around finding topics which
[2:16] risk being complicated, but finding the
[2:18] right visual that somehow unlocks their
[2:20] underlying meaning.
[2:21] And at first it was a little bit of a
[2:22] surprise to me to be invited to an event
[2:24] like this.
[2:25] On the surface, mathematicians and
[2:27] designers feel like very different
[2:28] species.
[2:30] But really both are trying to get at the
[2:31] same general idea. In both cases, you
[2:33] find yourself awash in a situation with
[2:35] an abundance of choice and a large
[2:37] potential for complexity. And you're
[2:39] trying to find a clear path through it.
[2:41] This is what mathematicians do. This is
[2:43] what designers do.
[2:45] And so I want to talk about principles
[2:46] of design that we can apply to the
[2:49] specific case of trying to explain math.
[2:52] And I want to focus on one specific
[2:53] example, which is something that's come
[2:55] up an almost embarrassing number of
[2:56] times on my channel over the years,
[2:58] which is the equation e to the pi i
[3:01] equals -1.
[3:03] So the reason this has come up so many
[3:04] times is because depending on what
[3:06] you're trying to answer about it, there
[3:08] are fundamentally different ways to
[3:09] visualize it and to explain it.
[3:11] And whenever you have an abundance of
[3:13] choice,
[3:14] this is where design is at its most
[3:16] needed.
[3:17] So what we're going to do today, over
[3:18] the next 20 minutes or so, is answer
[3:20] three distinct questions about this
[3:22] equation.
[3:23] Each question is going to lend itself to
[3:25] a distinct way that we can visualize
[3:26] what's going on.
[3:28] And each one ties to a principle of
[3:29] design that I think we can apply to math
[3:31] explanation more broadly.
[3:34] So are we ready to get into it? Are we
[3:35] ready to spend our early morning getting
[3:37] into imaginary exponentials and uh
[3:39] listening to me not hold back on you?
[3:41] >> Yeah.
[3:42] >> All right.
[3:43] >> [cheering]
[3:44] [applause]
[3:45] >> My basic assumption is everyone here is
[3:46] maximally curious. I'm not going to
[3:48] treat design community any different
[3:50] than I would treat a math community.
[3:52] Question number one, very simply, what
[3:54] does this mean?
[3:55] It's actually not clear from the symbols
[3:56] what the expression is even trying to
[3:58] say.
[3:59] So, let's let's break it down. Let's
[4:00] take each character one at a time. Pi,
[4:02] we know pi, we love pi. It's all about
[4:04] circles. Traditionally, you define it as
[4:06] the ratio of a circle's circumference to
[4:08] its diameter, but mathematicians
[4:10] actually often like to think about unit
[4:11] circles, circles with a radius one, and
[4:13] in that context, it would give you the
[4:14] distance halfway around the circle. So,
[4:16] that's the image I want in your mind for
[4:18] pi.
[4:19] Now, I, this is the one that's shrouded
[4:21] in a little bit of mystery. It's often
[4:23] called the imaginary constant. It's a
[4:25] little bit of a silly name. It's
[4:26] honestly no more imaginary than most
[4:28] real numbers are, but it's defining
[4:29] characteristic is that when you square
[4:31] it, you get -1.
[4:33] Okay. The image you should have in your
[4:35] mind, though, is really it's all about
[4:36] extending our usual notion of numbers
[4:39] instead of them being on a
[4:40] one-dimensional number line into a
[4:41] two-dimensional plane.
[4:43] And this, by the way, is part of why
[4:44] it's potentially such a delightful topic
[4:46] for designers is once you gain a certain
[4:48] fluency with this new kind of number,
[4:50] you have a new tool in your belt for how
[4:51] to manipulate two-dimensional space.
[4:53] We'll get there in about 15 minutes.
[4:55] But for right now, when you think about
[4:57] um I, you should think of it as one
[4:59] member of a big family of what we call
[5:01] complex numbers, where each one has a
[5:03] real component, that's how you move left
[5:05] and right, and an imaginary component,
[5:06] how you move up and down.
[5:08] And when you think about what does I do,
[5:10] what is its reason for existence, for
[5:13] today, I want you to think about the
[5:14] action of multiplying by it as being
[5:16] something that rotates. So, for example,
[5:18] let's say you you multiply I by a real
[5:20] number A, what's going to happen is it
[5:22] moves 90° up onto that imaginary axis,
[5:25] and it turns into A * I.
[5:27] If you multiplied it by a purely
[5:28] imaginary number B * I, that also gets
[5:31] rotated 90° because B * I * I is BI
[5:35] squared. By definition, I squared is -1.
[5:39] And so, for a general combination of
[5:40] these, A + BI, if each part of it gets
[5:42] rotated 90°, the number as a whole also
[5:45] gets rotated 90°. So, let that burn in
[5:48] your mind. If you see I, you think a
[5:49] thing that wants to rotate by 90
[5:51] degrees.
[5:52] All right. Now, the the last character
[5:53] on here is that number E, and the idea
[5:56] that we're trying to exponentiate it.
[5:58] And the thing that's so weird about the
[5:59] equation that we're digging into right
[6:01] now is usually when you learn about
[6:03] exponentiation in school, we learn that
[6:06] it's about repeated multiplication. What
[6:07] does E to the X mean? Well, E is some
[6:09] number, it's around 2.7, and this should
[6:11] mean multiplying by it X times. But,
[6:13] this just completely breaks down if
[6:15] we're talking about more exotic kinds of
[6:17] inputs like complex numbers. And in
[6:19] fact, this is just not what that
[6:20] expression even means anymore. What it
[6:22] actually means is tied to a piece of
[6:24] calculus. Um there's this very beautiful
[6:26] result around how when you use E as a
[6:28] base um for your usual notion of
[6:30] exponents, you know, repeated
[6:32] multiplication, how you extend that to
[6:33] real numbers and all of that, um it
[6:35] turns out to equal a certain infinite
[6:37] polynomial. I won't give the full story
[6:39] on why it does, just going to present
[6:41] this is what it happens to equal.
[6:43] So, in that case, that's a discovery.
[6:44] That is a discovery in math that these
[6:46] two are the same.
[6:47] When we extend the definition though, we
[6:49] start using that as a definition.
[6:52] We sort of invent a notion of what we
[6:53] want exponentiation to mean when we
[6:55] throw in more exotic inputs by saying
[6:57] take that expression, which actually can
[7:00] make sense when we plug in something
[7:01] more exotic, and use E to the X as
[7:04] almost like a notational shorthand. It's
[7:05] a little bit of slight of hand. So, the
[7:07] actual meaning of the thing that we're
[7:09] exploring today is much much richer than
[7:11] you might think. And we can even step
[7:13] through and try to visualize it. So,
[7:15] we'll start start going through this
[7:16] polynomial. When you add one, that moves
[7:18] you one unit to the right. When you add
[7:20] pi times I, that's going to move you up
[7:22] pi units. The next term in this is going
[7:24] to look like 1/2 pi I squared. Okay, so
[7:27] I squared, that you've rotated 90
[7:29] degrees twice, you're now moving in the
[7:31] leftward direction.
[7:33] If you take the next term, it's got a pi
[7:34] I cubed, that I cubed, you think, okay,
[7:37] I've rotated 90 degrees three different
[7:38] times, we're now moving down.
[7:40] And something very interesting happens
[7:42] when you keep adding on more and more
[7:43] terms of this.
[7:44] Each power of I means you're rotating
[7:47] another 90°, but that denominator in the
[7:49] expression grows really rapidly. It
[7:51] grows so rapidly that all of your terms
[7:52] start to shrink and get really small.
[7:54] So, your spiraling sum zeros in on one
[7:57] specific point of the plane.
[7:59] And that point happens to be at -1.
[8:02] So, this is the claim, right? This is
[8:04] what the expression we're studying
[8:05] actually means, where we're no longer
[8:07] hiding it behind all of this notational
[8:09] sort of
[8:11] And this brings us to the very first
[8:12] principle of treating math explanation
[8:14] as a design challenge, which is
[8:17] simply treat it as a visual design
[8:19] challenge. Ask the question, what does
[8:22] it look like?
[8:23] I'm not saying every single piece of
[8:25] math has to be visualized. I'm not even
[8:27] necessarily saying visualizing it will
[8:29] always give you the best explanation.
[8:31] But what's undeniably true is that there
[8:33] is a lot of low-hanging fruit simply
[8:36] asking the question, what does it look
[8:38] like?
[8:39] What's also true, and I've noticed this
[8:40] over the last 11 years of seeing people
[8:43] respond to the stuff that I've made, is
[8:44] that it makes an incredible difference
[8:46] to students.
[8:47] Simply asking that question is often the
[8:48] difference between sitting in a room in
[8:50] silence trying to read sheet music
[8:52] versus listening to the song.
[8:56] For this specific example, though,
[8:58] that question alone is not enough. It's
[9:00] insufficient. Cuz even if you can see
[9:02] what the expression is claiming, that
[9:04] this spiraling sum lands on -1, I've
[9:06] done nothing to explain why. Why would
[9:08] it land there? That is a strangely clean
[9:10] value for it to land on given that we've
[9:12] got all these powers of pi and a
[9:13] seemingly chaotic spiraling sum.
[9:16] So, we have to go at it in a different
[9:17] way.
[9:18] And before you ever try to prove
[9:19] something, I think it's always a good
[9:21] idea to believe that it's true.
[9:24] So, rather than just asking, why is this
[9:25] true? I want to try to get at, why does
[9:27] it want to be true?
[9:30] For that, we're going to take another
[9:31] look at that function, e to the x.
[9:33] Instead of thinking x, I actually want
[9:35] you to think t, where t is going to be
[9:37] time. And the defining characteristic,
[9:39] the the thing that brings E to life,
[9:42] is the idea of a function whose rate of
[9:43] change is equal to itself. So, here's
[9:46] what I mean by that. I want you to think
[9:48] of this expression E to the T as a
[9:50] position. It's going to be a position
[9:51] that changes with time. And we're going
[9:53] to think of it living on the real number
[9:54] line. I'm going to draw a little arrow
[9:56] there. We know that the position starts
[9:58] at one, because if you take anything to
[10:00] the zeroth power, that lands you at one.
[10:02] So, we have an initial condition.
[10:04] And this defining equation for our
[10:05] expression, sort of the the meaning of
[10:07] life for the number E, is that its rate
[10:10] of change, what I have written up on the
[10:11] left there, um is always going to be
[10:13] equal to the expression itself. So, you
[10:16] imagine a velocity vector whose rule is
[10:18] it always has to be locked to equal that
[10:20] position. So, right off the bat, as
[10:22] we're going to play time forward, you
[10:23] know what's going to happen, because the
[10:25] velocity is pointing you to the rate,
[10:27] that position is going to have to grow.
[10:29] But, as it starts to grow, because the
[10:30] position is bigger, the velocity has to
[10:32] get bigger. But, as the velocity gets
[10:34] bigger, it means you're growing even
[10:35] faster. But, the faster you grow, the
[10:36] bigger that position gets. And you've
[10:38] got this positive feedback loop that
[10:40] gets out of hand in a kind of delightful
[10:43] way. And this is the sensation of
[10:45] exponential growth.
[10:46] And more specifically, the idea that
[10:48] both these quantities are always locked
[10:49] to be the same is the sensation of
[10:51] exponential growth when the base is E.
[10:54] This is really the the meaning of that
[10:55] number E.
[10:57] And there's just one other little
[10:58] sprinkle of calculus that I need to give
[11:00] you to tell the full story here, which
[11:02] is how you think about it if you put a
[11:04] little constant in front of that time.
[11:06] So, for example, let's say we put a
[11:07] constant two in front of that time.
[11:10] Well, intuitively, this is kind of like
[11:11] you're playing time twice as fast. Um
[11:13] so, you might expect that velocity
[11:14] vector to get twice as big. And that's
[11:16] exactly what happens. Um if you've taken
[11:18] some calculus, you'll know something
[11:19] known as the chain rule, um where as a
[11:21] formula, what this would look like is
[11:23] our rate of change is still it's not
[11:25] quite equal to the expression itself,
[11:27] but it's equal to two times that
[11:28] expression. You basically take that
[11:30] constant, and now that's a a multiplying
[11:32] factor. But to visualize what's
[11:34] happening, we still think of the idea of
[11:36] whatever that position is, the velocity
[11:38] is locked to be dependent on it, but
[11:39] this time the velocity is always two
[11:41] times that position. So, you still have
[11:43] your runaway growth, where the bigger
[11:44] the position gets, the bigger that
[11:46] velocity gets, and the bigger the
[11:47] velocity gets, the position has to grow
[11:49] all the faster. But now your runaway
[11:50] growth is running away all the more
[11:52] quickly.
[11:53] We could also think about a negative
[11:55] constant sitting up there.
[11:57] So, this is a little bit like if you are
[11:58] playing time backwards.
[12:01] But as a as a formula, if you follow
[12:03] what the calculus is telling you to do,
[12:05] it says, "Okay, your rate of change
[12:07] looks like the expression itself, but
[12:08] this time we're multiplying by" I've
[12:11] chosen the example -0.5.
[12:13] So, visually you'd imagine that negative
[12:15] is kind of rotating everything 180°, and
[12:17] the 0.5 means that it's squished down.
[12:20] So, now, if I'm going to play time
[12:22] forward, the very first thing that's
[12:24] going to happen is the position is
[12:26] moving to the left. It's going toward
[12:28] zero.
[12:29] But instead of running away, the smaller
[12:31] the position gets as it approaches zero,
[12:33] that velocity has to get correspondingly
[12:35] smaller. So, as it approaches zero, it
[12:38] gets smaller, the velocity gets smaller,
[12:39] it slows down, and it approaches but
[12:41] never quite reaches it. And this is that
[12:44] visceral sensation of exponential decay.
[12:47] And once you have this in mind, we can
[12:49] start to ask the more interesting
[12:50] question of what should it mean, even if
[12:54] we haven't defined it, what should it
[12:55] mean if we put that imaginary number I
[12:59] sitting in front of that T.
[13:01] Now, on the one hand, imaginary time
[13:02] feels like a you know, a very woo-woo
[13:04] sort of concept you'd find in a quantum
[13:06] crystal shop, but it's actually very
[13:09] sensible if we remember what's the
[13:10] reason for existence for I. What does I
[13:12] want to be doing?
[13:14] Remember, multiplying by I
[13:17] wants to rotate things 90°.
[13:19] So, if we still think of this expression
[13:21] as a position, and that position is
[13:22] going to change over time,
[13:24] this meaning of existence for E
[13:27] combined with the meaning of existence
[13:29] for I, is actually giving us a really
[13:31] visceral and visual rule. It's saying
[13:33] whatever that position is, the velocity
[13:36] vector is going to be a 90° rotation of
[13:38] it.
[13:39] So, right off the bat, this lends itself
[13:40] to the idea that we should be thinking
[13:42] not confined to the real number line,
[13:44] cuz at the moment zero, our position is
[13:47] actually being pulled to move off of
[13:49] that real number line. It's being pulled
[13:50] to move into the broader two-dimensional
[13:52] complex plane.
[13:53] And this rule is also telling us even if
[13:55] we don't know exactly where it's going
[13:57] to be at any given point in time, we
[13:58] know that wherever that position ends up
[14:01] at any given point in time, the
[14:03] corresponding velocity is locked to be a
[14:05] 90° rotation of it.
[14:07] Naturally, there's one and only one
[14:09] motion where this is going to be
[14:11] followed, and that's if starting from
[14:13] zero, you rotate in a circle.
[14:15] And you can say something more specific
[14:17] than that, too. You know that you're
[14:18] going to be rotating at a specific rate,
[14:20] because that velocity vector is locked
[14:22] to equal the position vector in length.
[14:25] The rate at which you're going around
[14:27] has to be one unit per second.
[14:29] So, in particular, think about what it
[14:31] would mean to let time run forward for
[14:33] exactly pi seconds.
[14:36] That would mean if you're traversing one
[14:37] unit per second, and you go pi units
[14:40] around the circle, you've gone exactly
[14:41] halfway around.
[14:43] And so, this is not just the the meaning
[14:45] of what this expression is saying, it's
[14:47] also showing you why it wants to be
[14:48] true.
[14:49] It's not just a coincidence that that
[14:51] expression that we had was spiraling in
[14:52] and landing on -1. Uh instead, it feels
[14:55] like it must be that way. How could it
[14:57] have ever been otherwise?
[14:59] And this gets us to a second principle
[15:01] when it comes to designing a math
[15:02] explanation.
[15:03] Really, the substance behind any
[15:04] explanation is understanding not just
[15:06] what's true, but why it's true.
[15:09] And I think whenever you want to
[15:10] understand why something's true, take
[15:12] each component of what you're trying to
[15:13] explain. So, in this case, we have an
[15:15] equation, but it could be each part of a
[15:17] theorem, it could be each piece of
[15:18] anything else. Take each component, and
[15:20] And sure each one has a very clearly
[15:22] defined reason for existence, the thing
[15:24] that it wants to do.
[15:25] If you were writing a novel, it's never
[15:27] going to work unless each one of the
[15:28] characters has a clearly defined
[15:30] motivation.
[15:31] The same is true in math. Nothing is
[15:33] different in math. Give your characters
[15:34] motivation.
[15:36] Now, while we're here, uh it's actually
[15:38] very fun to see what this motion around
[15:40] the circle looks like in the context of
[15:41] our previous visual. I had shown that
[15:44] spiraling sum for one input, pi * I, but
[15:46] if instead I make it I * t and I let
[15:49] that number t change, um it's quite fun
[15:51] to see how this spiraling sum does
[15:54] indeed trace out a circle. But from this
[15:56] visual, it's actually very mysterious
[15:57] why that would be the case.
[15:59] It's not obvious that it would end up on
[16:00] a circle.
[16:02] So, we needed a different way of viewing
[16:03] it to understand why it's true, but then
[16:06] the first way of of viewing it shows us
[16:08] what the real claim is. And combining
[16:10] those, I think, is where you you see
[16:11] that sense of both mystery and a sense
[16:13] of satisfying explanation combined into
[16:15] one.
[16:17] All right, so these are two questions we
[16:18] could ask. Each one of them lends itself
[16:20] to a different principle.
[16:22] But arguably, there's a much more
[16:23] important question before we even start.
[16:25] Education 101 is that before anybody is
[16:28] going to learn from you, they have to
[16:29] want to learn. You have to motivate the
[16:31] subject. And often, the best motivation
[16:33] is some form of application. How do you
[16:34] actually use it?
[16:36] If we were at a conference full of
[16:38] electrical engineers, we could talk all
[16:40] about the many uses of imaginary
[16:41] exponents for signal processing.
[16:44] If this was a conference full of
[16:45] physicists, we could talk all about the
[16:46] abundant uses of it in the context of
[16:48] quantum mechanics.
[16:50] But because we're at a conference full
[16:51] of designers, I actually want to talk a
[16:53] much a much more left-field application
[16:55] that you wouldn't think about, which is
[16:57] how it's relevant to art and to
[16:58] understanding one very specific art
[17:00] piece.
[17:02] So, for this, I want you to imagine you
[17:05] are in a print gallery and you're in
[17:07] this kind of strange warped world and
[17:09] you're looking at this picture of a
[17:10] boat.
[17:11] And as [snorts] you look up and say,
[17:12] "What's in that picture?" you see in the
[17:13] picture, the boat is in a harbor and
[17:15] that harbor has a town.
[17:17] That town has a lot of buildings.
[17:19] And as you keep looking around, you
[17:20] realize one of those buildings is
[17:22] actually this open-air print gallery.
[17:24] And you scan through the hall of that
[17:26] print gallery.
[17:28] And as you keep looking around, you find
[17:29] yourself sitting there, looking at a
[17:31] picture of a boat.
[17:33] So, zoomed out, this is a piece called
[17:35] the print gallery. It's by M.C. Escher.
[17:38] So, M.C. Escher is a favorite artist to
[17:39] many, especially a favorite artist to
[17:41] mathematicians, because he had a real
[17:44] knack for finding paradoxical ideas to
[17:47] flirt with the concept of infinity and
[17:50] seeming contradiction with a
[17:52] two-dimensional concept. Now, he has a
[17:54] whole repertoire of delightful
[17:56] paradoxical imagery. But, in a letter
[17:58] that he wrote to his son, he described
[18:00] this piece as, quote, "The most peculiar
[18:02] thing I have ever created." Which, for
[18:04] him, is saying a lot.
[18:06] And there's a very interesting story,
[18:07] actually, around the math underlying
[18:10] this image that actually himself knew
[18:11] nothing about. One of the most recent
[18:14] projects that I did on YouTube, really
[18:16] digs into this. It's actually one of my
[18:17] favorite pieces, I think, I've done over
[18:19] the years. The full story takes maybe 45
[18:22] minutes to say, so we don't have time
[18:23] here. But, I do at least want to give
[18:24] you a little bit of a glimpse and the
[18:26] way that it's relevant to our story
[18:27] today.
[18:29] So, the concept that Escher was working
[18:31] with starts this way.
[18:33] I mean, this is going to be a
[18:34] straightened-out version of the scene we
[18:35] just looked at. We have a man looking at
[18:37] a picture of a boat. Um but, in this
[18:39] case, instead of looping around, we can
[18:41] zoom in. That boat is in a harbor. That
[18:44] harbor is next to a town with many
[18:45] buildings. One of those buildings is
[18:47] this open-air print gallery. And as you
[18:49] get closer in, you see a copy of where
[18:52] we started.
[18:54] And so, this concept, it's also fun.
[18:56] It's not quite paradoxical. It's just an
[18:57] image that's nested with I inside
[18:59] itself. It's very deeply nested inside
[19:01] itself in this case. Uh but, this isn't
[19:03] this isn't enough to be the Escher style
[19:05] genius. The simple idea of a picture
[19:07] nested deeply within itself.
[19:09] Escher somehow intuitively realized that
[19:11] there must be a way to take this concept
[19:14] and kind of pull out that inner version
[19:17] of that world nested within itself and
[19:19] pull it out to connect with the outer
[19:21] version.
[19:22] I know that animation I'm actually very
[19:24] proud of. Uh,
[19:25] I think yeah, thank you. Thank you.
[19:28] It's
[19:29] >> [applause]
[19:30] >> I don't deserve the credit. I'll give
[19:32] credit where credit is due in a moment.
[19:34] I made it, but but the math behind it
[19:36] comes from elsewhere. I think this would
[19:38] have blown Escher's mind because he went
[19:40] about creating this piece in a very
[19:42] different way. It was this very
[19:43] intuitive kind of folk artist, very
[19:46] tactile, physical approach. But what
[19:49] underlies that animation I just showed,
[19:50] which I'm just going to play it again
[19:52] because I want to I just want to see
[19:54] what it looks like.
[19:55] Let's see.
[19:57] Um, now we got we already have our zoom.
[20:00] We already have our zoom.
[20:02] Let's see it. Let's appreciate it. All
[20:03] right, so we're pulling out that inner
[20:04] world.
[20:06] Oh, yeah. Oh, that's nice.
[20:08] And it doesn't line up and it doesn't
[20:09] line up and then at one point it just
[20:11] perfectly lines up. It's so good. It's
[20:13] so good.
[20:15] Okay, so the what's underlying this is a
[20:17] a set of complex functions. A set of
[20:19] functions treating each pixel on the
[20:21] plane of that image like they're complex
[20:23] numbers. Um, and then there's a very
[20:25] specific manipulation that pulls off um,
[20:28] this this move that Escher was doing.
[20:30] So like I said, I don't deserve the
[20:31] credit. This comes from two
[20:32] mathematicians named de Smit and Lens
[20:34] trap who around 50 years after Escher
[20:37] made that piece provide this really nice
[20:39] analysis on how actually there's a lot
[20:41] of hidden math related to complex
[20:43] numbers um, underlying what's really
[20:45] going on with the piece.
[20:47] Now as I said, I wish I had the time to
[20:48] tell you the full story right now. I
[20:50] don't. But what I will do is try to give
[20:52] you that 10,000 foot view glimpse of the
[20:55] core parts of the story and the way that
[20:57] it relates to our our exploration today
[20:59] of designing explanations. Specifically
[21:02] with respect to that e to the z
[21:04] function.
[21:05] See here instead of talking about e to
[21:06] the t or e to the x, I'm saying z cuz z
[21:09] is often something we use to describe
[21:10] complex numbers. And the new way that
[21:13] I'm going to have us visualize it is
[21:14] going to be to think more globally,
[21:16] where we want to say, "What does this do
[21:17] to the entire plane?" Cuz here we're
[21:19] using it for an artistic goal, where we
[21:20] want to manipulate space and do
[21:22] something new with space.
[21:23] So, just to review, we um we already
[21:26] talked about what happened if we plug in
[21:28] a purely imaginary number, some multiple
[21:30] of i, which is as you walk up that line,
[21:32] the output kind of walks around a
[21:33] circle.
[21:35] And what ends up happening is if you
[21:36] walk up a different line, where maybe
[21:38] it's shifted one unit to the right, you
[21:40] walk around a bigger circle,
[21:41] specifically one scaled up by e.
[21:44] If you walk up a different vertical
[21:45] line, maybe this time two units to the
[21:47] right, you walk around an even bigger
[21:48] circle, this one scaled up by e squared.
[21:52] And in general, the thought to have in
[21:54] your mind is how all of these vertical
[21:56] lines are turning into circles.
[21:58] And what I want to try to visualize is
[22:00] what does this function do to the
[22:01] entirety of the input plane, the
[22:04] entirety of all possible inputs? How can
[22:06] we hold that in our head? I think
[22:07] there's a really nice way to visualize
[22:09] it, where we think of all these vertical
[22:10] lines, so I'm going to highlight them,
[22:12] and think of the plane that exists in
[22:14] between them.
[22:15] And what I like to imagine is sort of
[22:17] rolling up that plane into a tube, so
[22:20] that we've turned all those vertical
[22:21] lines into circles, and then
[22:23] specifically it's circles with radius
[22:24] one to start, so every kind of 2 pi
[22:26] units, that's when you're repeating.
[22:28] And then you take that whole tube, and
[22:30] we know each one of those circles needs
[22:31] to be centered in the output plane, so
[22:33] we kind of move that tube, we center it
[22:36] above the output plane that we're going
[22:37] to have, and then we squish it all down.
[22:39] Squish it on so that all those circles
[22:41] are centered around the origin, and they
[22:43] grow at this exponential rate, where
[22:44] each one is e times bigger than the
[22:46] last.
[22:47] So, this is our new way of thinking
[22:49] about the exponential function. It's a
[22:50] third distinct way of visualizing it
[22:52] based on the fact that we have a new
[22:53] goal,
[22:54] which is to do something artistic, which
[22:56] is to understand manipulations of space.
[22:58] And really those two mathematicians,
[23:00] when they were studying Escher,
[23:02] they were like artists who were fluent
[23:03] with a new kind of paintbrush, which is
[23:05] how to use functions of complex numbers
[23:08] to manipulate things in just the precise
[23:10] ways that you want.
[23:11] And this exponential function was one of
[23:13] their paintbrushes, and the only other
[23:14] one they really needed was the reverse
[23:17] of this, where you go the other way
[23:18] around. So, the name we have for that
[23:20] inverse function is the natural log. Um
[23:22] so, in this case, exponentiating gets
[23:24] you one direction, natural logs take you
[23:26] another. And the thing to hold in your
[23:28] mind is what would that do? It takes the
[23:30] circles and kind of unwraps them into
[23:32] lines. And this is very fun to think
[23:34] about if instead of just general lines
[23:36] and numbers, we actually put a picture
[23:38] on one of those planes, and we say,
[23:40] "What would it mean to take the
[23:41] logarithm of a picture?"
[23:43] In this case, what it would mean is that
[23:44] you look at various circles in that
[23:46] picture,
[23:47] and each one of those circles of pixels
[23:49] gets kind of straightened out into a
[23:50] line.
[23:51] And more specifically, it's in such a
[23:53] way where as you zoom in, every time you
[23:55] zoom in by a factor of E, your line has
[23:57] shifted one unit to the right.
[23:59] And for the Escher concept, this means
[24:01] if ever you have a picture which is
[24:03] nested within itself, and you've got
[24:04] this kind of infinitely repeating
[24:05] pattern as you zoom in,
[24:07] this unwrapping method turns that into a
[24:09] tiling pattern that turns out to be kind
[24:11] of easier to work with and manipulate.
[24:14] So, here's the high-level view of what
[24:16] those mathematicians did. At a high
[24:17] level, they started by uh looking at a
[24:20] logarithm of the straightened out
[24:21] concept of a a man looking at a picture
[24:24] of a boat with that nested deeply inside
[24:26] itself. You get this wild and bizarre
[24:28] image when you take that logarithm.
[24:30] Um what they understood is if you take
[24:32] that and then you rotate it in just the
[24:34] right way,
[24:36] you have to be very careful, you find
[24:37] just the right way to rotate it, if then
[24:39] you kind of translate back to the normal
[24:40] world where you exponentiate, that's
[24:42] what gets you this this wild spiral.
[24:44] So, I have not explained why that's the
[24:46] case. I simply want to show you how it
[24:48] when someone uses these functions of
[24:50] exponential numbers as a kind of new
[24:52] paintbrush, they get enough fluency to
[24:54] be able to rediscover what's really a
[24:56] not obvious concept that I should as I
[24:58] stumbled on.
[24:59] This also, by the way, explains how I
[25:01] made that animation that I was showing
[25:02] you earlier. Where really what was going
[25:03] on under the hood is I was working in
[25:05] the log space, and if you rotate things
[25:07] in that log space, and you just present
[25:09] to screen what you get after you
[25:11] exponentiate, that's what gets this
[25:13] transition between the straightened out
[25:14] version and the Escher version.
[25:17] And so, this cuts us to the third
[25:19] principle for treating math explanation
[25:21] as a design challenge. So, we all know
[25:24] that we want to motivate our subjects. I
[25:26] think that's very obvious. We all know
[25:27] that applications are one of the best
[25:29] sources of motivation. But, usually we
[25:31] think of math application as being in
[25:33] the service of science or in the service
[25:35] of technology. And it is, and that's
[25:37] great. There's lots of good stories to
[25:38] be told. But, the third principle here
[25:40] is that sometimes the most memorable
[25:42] application is the most surprising one.
[25:44] It's not obvious that studying imaginary
[25:47] exponentials and complex functions lets
[25:50] you achieve an artistic aim. But, I
[25:52] think when you see how it does, it burns
[25:54] in your brain just a little bit longer
[25:56] than if I was just talking about
[25:57] applications to technology.
[25:59] So, here we spent time looking at three
[26:01] distinct principles. One of them, simply
[26:03] treat it as a visual design challenge.
[26:05] Simply ask the question, what does it
[26:07] look like?
[26:08] The other one is that if you want to
[26:09] understand why things are true,
[26:11] ask what are the motivations of your
[26:13] characters.
[26:14] That motivation is often the difference
[26:16] between a proof and an explanation.
[26:18] And then finally, the most memorable
[26:20] applications are the ones that are the
[26:21] most surprising.
[26:23] Now, these are just the ones that I come
[26:25] up with if we situate ourselves for 20
[26:27] minutes talking about things. I think if
[26:29] we sat here for another hour, we could
[26:31] easily come up with another seven more
[26:33] principles about math and explanation
[26:34] and design. And what I want to leave you
[26:36] with is the idea that everyone in this
[26:37] room really is a teacher in some form.
[26:40] Maybe very explicitly your job is
[26:42] related to explanation. Um, but if not,
[26:44] all forms of design are in some form
[26:46] trying to communicate as clearly as you
[26:48] can. And at minimum, everyone is a
[26:50] teacher, cuz everyone has the role of
[26:51] trying to explain what they do and why
[26:53] it matters to others.
[26:54] And I want to encourage you to step back
[26:56] and spend 30 minutes sometime today to
[26:58] ask, what are your own principles around
[27:00] teaching? And how do those principles
[27:02] overlap with design?
[27:04] Cuz in just the same way that math can
[27:05] be in the service of design, you know,
[27:07] offering these different paint brushes
[27:08] for different manipulations of 2D space,
[27:10] design is absolutely in the service of
[27:12] explanation and teaching.
[27:14] And the more that we try to understand
[27:15] the intersection between those two,
[27:17] the more successfully we'll achieve the
[27:19] ends of both.
[27:20] And with that, I'll leave you. Thank you
[27:21] very much.
[27:24] >> [applause]